AVD Connection Stages By Hostpools Test
One of the key determinants of the quality of a user's experience with an AVD session host is the sign-in experience of that user. Figure 1 depicts the different stages of a typical AVD user sign-in process
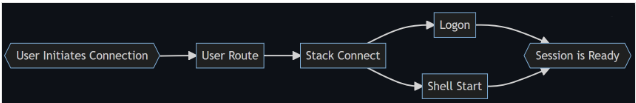
Figure 1 : The typical user sign-in process
Once the user initiates a connection by selecting the Azure virtual desktop icon, the steps below will follow:
-
User Route: The Azure service identifies a host for the user to connect to.
-
Stack connected: Once the host is identified, the Azure service then resolves that session host for the user and establishes a connection between the session host and the user’s remote client.
-
Logon: As soon as the connection is established, the shell starts to load. In the process, the user profile is loaded, group policies are applied, FSLogix is launched, and the shell is started.
-
Shell ready: Once the shell is fully loaded , it is ready for use.
A delay in any of the aforesaid stages/steps can adversely impact the sign-in experience of a user. If such latencies are allowed to persist, they can irreparably scar the overall user experience with AVD. This in turn can compel enterprises to question the stability and reliability of the AVD service, and even reconsider their current and future AVD investments. To avoid this, help desk has to continuously monitor user sign-ins to desktops, proactively detect sign-in slowness, accurately identify where - i.e., at which step/stage - the sign-in process slowed down the most, and rapidly clear the bottleneck. This is where the AVD Connection Stages by Hostpools test helps!
This test auto-discovers the AVD host pools managed by each resource group, and monitors user sign-ins to every host pool, end-to-end - i.e., across all stages of the sign-in process. While at it, the test reports the time taken at each step of the sign-in process. If users to a host pool are constantly complaining of slowness when signing in, then help desk can use this test to quickly and accurately isolate the precise step/stage that is delaying sign-ins to that host pool - is it because of high routing times? is it because stack connections are taking too long? are logons slow? or is it because the shell is taking a long time to get ready? Moreover, using the detailed diagnostics reported by the test, help desk can swiftly identify the users who are most impacted by the slowness at any particular stage. This information will help administrators rapidly resolve user complaints pertaining to sign-in delays.
Target of the Test: A Microsoft AVD Broker
Agent deploying the test: A remote agent
Output of the test: One set of results for each AVD host pool managed by the target AVD broker, in each resource group of the configured subscription
| Parameters | Description |
|---|---|
|
Test Period |
How often should the test be executed. |
|
Host |
The host for which the test is to be configured. |
|
Subscription ID |
Specify the GUID which uniquely identifies the Microsoft Azure Subscription to be monitored. To know the ID that maps to the target subscription, do the following:
|
|
Tenant ID |
Specify the Directory ID of the Azure AD tenant to which the target subscription belongs. To know how to determine the Directory ID, refer to Configuring the eG Agent to Monitor a Microsoft AVD Broker Using Azure ARM REST API |
|
Client ID and Client Password |
To collect the required metrics, the eG agent requires an Access token in the form of an Application ID and the client secret value. If a Microsoft Azure Subscription component or a Microsoft Azure Active Directory component is already being monitored, then an Application would have already been created for monitoring purposes. The Application ID and Client Secret of such an application can be specified here. However, if no such application exists, then you will have to create one for monitoring the AVD broker. To know how to create such an application and determine its Application ID and Client Secret, refer to Configuring the eG Agent to Monitor a Microsoft AVD Broker Using Azure ARM REST API. Specify the Application ID of the created Application in the Client ID text box and the client secret value in the Client Password text box. |
|
Proxy Host |
In some environments, all communication with the Azure cloud be routed through a proxy server. In such environments, you should make sure that the eG agent connects to the cloud via the proxy server and collects metrics. To enable metrics collection via a proxy, specify the IP address of the proxy server and the port at which the server listens against the Proxy Host and Proxy Port parameters. By default, these parameters are set to none, indicating that the eG agent is not configured to communicate via a proxy, by default. |
|
Proxy Username, Proxy Password and Confirm Password |
If the proxy server requires authentication, then, specify a valid proxy user name and password in the Proxy Username and Proxy Password parameters, respectively. Then, confirm the password by retyping it in the Confirm Password text box. |
|
Log Analytics Workspace Name |
Typically, to consolidate log entries, correlate log data, and perform complex analysis, a host pool's logs are often sent to one/more Log Analytics Workspaces. By default, the Log Analytics Workspace Name parameter is set to All. This indicates that the test reads log data from all Log Analytics Workspaces configured for the target subscription, by default. However, if you want the test to use only those Log Analytics Workspaces to which a host pool's logs are sent, then provide the names of these workspaces here as a comma-separated list. To determine the names of the workspaces, do the following:
|
|
DD Frequency |
Refers to the frequency with which detailed diagnosis measures are to be generated for this test. The default is 1:1. This indicates that, by default, detailed measures will be generated every time this test runs, and also every time the test detects a problem. You can modify this frequency, if you so desire. Also, if you intend to disable the detailed diagnosis capability for this test, you can do so by specifying none against DD frequency. |
|
Detailed Diagnosis |
To make diagnosis more efficient and accurate, eG Enterprise embeds an optional detailed diagnostic capability. With this capability, the eG agents can be configured to run detailed, more elaborate tests as and when specific problems are detected. To enable the detailed diagnosis capability of this test for a particular server, choose the On option. To disable the capability, click on the Off option. The option to selectively enable/disable the detailed diagnosis capability will be available only if the following conditions are fulfilled:
|


| Measurement | Description | Measurement Unit | Interpretation |
|---|---|---|---|
|
User route duration |
Indicates the average time that elapsed from when users to this host pool selected the Azure Virtual Desktop icon to when the Azure service identifies hosts for the users to connect to. |
Secs |
If the value of this measure is consistently high, it means that routing is taking too long. High routing time can slow down sign-ins. Typically, routing time can increase due owing to high network load, high service load, or unique network traffic routing. Use the detailed diagnosis of this measure to identify the user who is experiencing abnormally high routing times when signing in. To troubleshoot user route issues, look at your network paths. |
|
Stack connected duration |
Indicates the average time that elapsed from when the Azure service resolves a target session host in this host pool for a user to when the service establishes a connection between the session host and the user's remote client. |
Secs |
If this measure registers a high value, then it could mean that stack connection is taking too long. Consequently, the sign-in experience of users will be sub-par. Connections can take a long time owing to high network load, high service load, or unique network traffic routing. You may also need to pay attention to your network routing. Use the detailed diagnosis of this measure to identify the user who is experiencing abnormally high connection time when signing in. To reduce connection time, make sure you have appropriately configured all proxy configurations on both the client and session hosts, and that routing to the service is optimal. |
|
Logon duration |
Indicates the average time that elapsed from when a connection is established to a host in this host pool to when the shell starts to load. |
Secs |
If this measure registers an unusually high value, it implies that logons are very slow. This in turn can significantly impact sign-in experience. Logon time typically includes several processes that can contribute to high connection times. Any delay in profile loading, group policy processing, starting the shell, or launching FSLogix can significantly increase logon time. If you want to know which one of these factors is causing the logon delay, then check out the measures of the Winlogon Stages by Hostpools test. Use the detailed diagnosis of this measure to identify the user whose logon experience is very poor. |
|
Shell start duration |
Indicates the average time taken for the shell loading to start. |
Secs |
If this measure registers an abnormally high value, then it means that shell loading is taking too long. This in turn can slow down sign-ins. Delays in this phase can be caused by session host overload (high CPU, memory, or disk activity) or configuration issues. Use the detailed diagnosis of this measure to identify the user who has been waiting the longest for the shell to load. |
|
Shell ready duration |
Indicates the time from when the shell starts loading to when it is fully loaded and ready for use. |
Secs |
Delays in this phase can be caused by session host overload (high CPU, memory, or disk activity) or configuration issues. Use the detailed diagnosis of this measure to identify the user who has been waiting the longest for the shell to get ready. |