AVD Session Hosts By Host Pools
The AVD connection broker brokers desktop connections between the user and session hosts residing in a host pool. If users are unable to connect to a session host or if they often complain of annoying session disconnects, then the reliability of the AVD service will be questioned. To avoid this, administrators should continuously track the status of session hosts and user sessions of each host pool managed by the broker, identify hosts/sessions in an abnormal state, diagnose the reason for the abnormality, and fix it. This can be done using the AVD Sessions Hosts by Host Pools test.
This test checks the availability of every host pool, and alerts administrators if any host pool is unavailable. For available host pools, the test further tracks the status of the hosts in the pool, and notifies administrators if any host is in an abnormal state. The abnormality can imply that a host is unavailable / powered off / disconnected, or that an upgrade failure has occurred on the host. Additionally, the test also reveals if any host in a pool is idle - idle hosts are resource drainers, and hence, their numbers should be kept at a minimum. The test also monitors user sessions to the hosts in every pool, and reports the status of these sessions. Host pools with sessions in a disconnected or an 'Unknown' state are thus pinpointed. If any session is waiting too long to connect to a host, or there are one/more sessions that have abruptly logged off, then administrators are informed of the same, This way, the test draws administrator attention to host pools with 'unhealthy' hosts and sessions. Detailed diagnosis of the test, if enabled, lead administrators to the exact hosts in the pool that are in an abnormal state. Using the detailed metrics, you can also identify the hosts in the pool with sessions in an unhealthy state.
Note:
Typically, to consolidate log entries, correlate log data, and perform complex analysis, a host pool's logs are often sent to one/more Log Analytics Workspaces. This test reports valid metrics by reading data from these Log Analytics Workspaces only. If the host pool's logs are not sent to any Log Analytics Workspace, then this test will only report the value 0 for most of its measures. To avoid this, before configuring this test, make sure that the host pool's logs are configured to be sent to at least one Log Analytics Workspace. Follow the steps discussed in Configuring the Host Pool Logs to be Sent to a Log Analytics Workspace to achieve this.
Target of the Test: A Microsoft AVD Broker
Agent deploying the test: A remote agent
Output of the test: One set of results for each AVD host pool managed by the target AVD broker, in each resource group of the configured subscription
| Parameters | Description |
|---|---|
|
Test Period |
How often should the test be executed. |
|
Host |
The host for which the test is to be configured. |
|
Subscription ID |
Specify the GUID which uniquely identifies the Microsoft Azure Subscription to be monitored. To know the ID that maps to the target subscription, do the following:
|
|
Tenant ID |
Specify the Directory ID of the Azure AD tenant to which the target subscription belongs. To know how to determine the Directory ID, refer to Configuring the eG Agent to Monitor a Microsoft AVD Broker Using Azure ARM REST API |
|
Client ID and Client Password |
To collect the required metrics, the eG agent requires an Access token in the form of an Application ID and the client secret value. If a Microsoft Azure Subscription component or a Microsoft Azure Active Directory component is already being monitored, then an Application would have already been created for monitoring purposes. The Application ID and Client Secret of such an application can be specified here. However, if no such application exists, then you will have to create one for monitoring the AVD broker. To know how to create such an application and determine its Application ID and Client Secret, refer to Configuring the eG Agent to Monitor a Microsoft AVD Broker Using Azure ARM REST API. Specify the Application ID of the created Application in the Client ID text box and the client secret value in the Client Password text box. |
|
Proxy Host |
In some environments, all communication with the Azure cloud be routed through a proxy server. In such environments, you should make sure that the eG agent connects to the cloud via the proxy server and collects metrics. To enable metrics collection via a proxy, specify the IP address of the proxy server and the port at which the server listens against the Proxy Host and Proxy Port parameters. By default, these parameters are set to none, indicating that the eG agent is not configured to communicate via a proxy, by default. |
|
Proxy Username, Proxy Password and Confirm Password |
If the proxy server requires authentication, then, specify a valid proxy user name and password in the Proxy Username and Proxy Password parameters, respectively. Then, confirm the password by retyping it in the Confirm Password text box. |
|
Log Analytics Workspace Name |
Typically, to consolidate log entries, correlate log data, and perform complex analysis, a host pool's logs are often sent to one/more Log Analytics Workspaces. By default, the Log Analytics Workspace Name parameter is set to All. This indicates that the test reads log data from all Log Analytics Workspaces configured for the target subscription, by default. However, if you want the test to use only those Log Analytics Workspaces to which a host pool's logs are sent, then provide the names of these workspaces here as a comma-separated list. To determine the names of the workspaces, do the following:
|
|
Active Session DD |
By default, this test does not report detailed diagnostics for the Active sessions measure. Accordingly, this parameter is set to No by default. Typically, in large AVD roll-outs, this measure can report numerous records as part of detailed diagnostics. In such environments therefore, the detailed statistics for this measure can consume excessive space in the eG database. This default setting conserves valuable database space by ensuring that the test does not collect detailed metrics for the Active sessionsmeasure. However, If you have a well-sized and well-tuned eG database, you can configure the test to capture detailed metrics for this measure. To achieve this, set this flag to Yes. |
|
Disconnected Session DD |
By default, this test does not report detailed diagnostics for the Disconnected sessions measure. Accordingly, this parameter is set to No by default. However, if needed, you can configure the test to capture detailed metrics for this measure. To achieve this, set this flag to Yes. |
|
Unknown Session DD |
By default, this test does not report detailed diagnostics for the Unknown sessions measure. Accordingly, this parameter is set to No by default. However, if needed, you can configure the test to capture detailed metrics for this measure. To achieve this, set this flag to Yes. |
|
Logoff Session DD |
By default, this test does not report detailed diagnostics for the Logoff sessions measure. Accordingly, this parameter is set to No by default. However, if needed, you can configure the test to capture detailed metrics for this measure. To achieve this, set this flag to Yes. |
|
Pending Session DD |
By default, this test does not report detailed diagnostics for the Pending sessions measure. Accordingly, this parameter is set to No by default. However, if needed, you can configure the test to capture detailed metrics for this measure. To achieve this, set this flag to Yes. |
|
Disk Mount Session DD |
By default, this test does not report detailed diagnostics for the User profile disk mount sessions measure. Accordingly, this parameter is set to No by default. However, if needed, you can configure the test to capture detailed metrics for this measure. To achieve this, set this flag to Yes. |
|
DD Frequency |
Refers to the frequency with which detailed diagnosis measures are to be generated for this test. The default is 1:1. This indicates that, by default, detailed measures will be generated every time this test runs, and also every time the test detects a problem. You can modify this frequency, if you so desire. Also, if you intend to disable the detailed diagnosis capability for this test, you can do so by specifying none against DD frequency. |
|
Detailed Diagnosis |
To make diagnosis more efficient and accurate, eG Enterprise embeds an optional detailed diagnostic capability. With this capability, the eG agents can be configured to run detailed, more elaborate tests as and when specific problems are detected. To enable the detailed diagnosis capability of this test for a particular server, choose the On option. To disable the capability, click on the Off option. The option to selectively enable/disable the detailed diagnosis capability will be available only if the following conditions are fulfilled:
|


| Measurement | Description | Measurement Unit | Interpretation | ||||||
|---|---|---|---|---|---|---|---|---|---|
|
Status |
Indicates whether/not this host pool is available currently. |
|
The values that this measure reports and their corresponding numeric values are listed in the table below:
Note: By default, this measure reports the Measure Values listed in the table above to indicate the current status of the host pool. In the graph of this measure however, the same is represented using the numeric equivalents only. Use the detailed diagnosis of this measure to view the friendly name of the host pool, host pool type, load balancer type, and maximum number of sessions allowed on the host pool. |
||||||
|
Total session hosts |
Indicates the total number of session hosts in this host pool. |
Number |
Use the detailed diagnosis of this measure to know which session hosts are in the host pool, where they are located, and what the current status of each session host is. Unavailable session hosts in the pool can be identified in this process. The detailed diagnostics also help administrators pinpoint the session hosts where upgrade has failed, and those session hosts that are running an outdated OS, agent, or side by side stack. |
||||||
|
Total sessions |
Indicates the total number of user sessions on this host pool. |
Number |
|
||||||
|
Active sessions |
Indicates the total number of sessions that are currently active on this host pool. |
Number |
Compare the value of this measure across host pools to know which host pool is overloaded with user sessions. Host pools that have or are about to reach their maximum session limit can also be quickly identified this way. Use the detailed diagnosis of this measure, if enabled, to know the names and types of active sessions on the host pool. Who initiated the session, when, and to which session host in the pool, are also revealed. |
||||||
|
Unknown sessions |
Indicates the number of session on this host pool that are in an Unknown state. |
Number |
Use the detailed diagnosis of this measure, if enabled, to know which sessions are in an Unknown state. |
||||||
|
Disconnected sessions |
Indicates the number of disconnected sessions in this host pool. |
Number |
Use the detailed diagnosis of this measure, if enabled, to know which sessions are in an Disconnected state. |
||||||
|
Pending sessions |
Indicates the number of pending sessions on this host pool. |
Number |
Use the detailed diagnosis of this measure, if enabled, to know which sessions are pending completion on the host pool. |
||||||
|
Logoff sessions |
Indicates the number of sessions that have logged out of this host pool. |
Number |
The detailed diagnosis of this measure , if enabled, reveals the names and types of the logged of sessions. |
||||||
|
User profile disk mount sessions |
Indicates the number of sessions on this host pool, where user profiles in FSLogix containers are dynamically attached to the computing environment at sign in, using natively supported VHD and VHDX. |
Number |
The detailed diagnosis of this measure, if enabled, reveals the details of sessions where user profiles are dynamically attached to the computing environment. . |
||||||
|
Powered off hosts |
Indicates the number of hosts in this host pool that are currently powered off. |
Number |
To know which hosts in the pool are powered off, use the detailed diagnosis of this measure. |
||||||
|
Drain mode hosts |
Indicates the number of hosts in this pool for which the 'Drain mode' has been turned on. |
Number |
Drain mode isolates a session host when you want to apply patches and do maintenance without disrupting user sessions. When isolated, the session host will not accept new user sessions. Any new connections will be redirected to the next available session host. Existing connections in the session host will keep working until the user signs out or the administrator ends the session. When the session host is in drain mode, admins can also remotely connect to the server without going through the Azure Virtual Desktop service. To know for which session hosts in the pool the 'drain mode' has been set, use the detailed diagnosis of this measure. |
||||||
|
No heart beat hosts |
Indicates the number of session hosts in this host pool, from which no heartbeat was received during the last measurement period. |
Number |
The monitoring agent used by Azure Monitor often sends a heart beat from each session host every minute to indicate the availability of the session. The value of this measure represents the number of session hosts in a pool from which no such heartbeats were received - i.e., the number of hosts that are down. Ideally therefore, the value of this measure should be 0. If a non-zero value is reported, then use the detailed diagnosis of this measure to identify the session hosts that have not sent any heartbeats during the last measurement period. |
||||||
|
Idle hosts |
Indicates the number of idle session hosts in this host pool. |
Number |
Since idle hosts unnecessarily drain a pool's collective resources, its best that the value of this measure is low at all times. If this measure reports an unusually high value, then use the detailed diagnosis of the measure to identify the idle hosts in the pool. |
||||||
|
Disconnected hosts |
Indicates the number of session hosts in this pool that are disconnected from the AVD broker. |
Number |
Ideally, the value of this measure should be 0. If a non-zero value is reported, then use the detailed diagnosis of this measure to know which hosts in the pool are disconnected from the broker. |
||||||
|
Unavailable hosts |
Indicates the number of session hosts in this host pool that are unavailable. |
Number |
Ideally, the value of this measure should be 0. If a non-zero value is reported, then use the detailed diagnosis of this measure to know which hosts in the pool are unavailable. |
||||||
|
Upgrade failed hosts |
Indicates the number of session hosts in this pool, on which the virtual desktop agent could not be upgraded. |
Number |
Ideally, the value of this measure should be 0. If a non-zero value is reported, then use the detailed diagnosis of this measure to know on which hosts the virtual desktop agent upgrade failed. |
||||||
|
Upgrading hosts |
Indicates the number of session hosts on which the virtual desktop agent upgrade is in progress. |
Number |
To know the hosts on which upgrade is in progress, use the detailed diagnosis of this measure. |
||||||
|
Available hosts |
Indicates the number of session hosts in this host pool, which are available. |
Number |
To know the available hosts in a host pool, use the detailed diagnosis of this measure. |
||||||
|
Healthy heart beat hosts |
Indicates the number of session hosts in this host pool, which are sending out heart beats at scheduled intervals. |
Number |
|
||||||
|
Connection allowed hosts |
Indicates the number of session hosts in this host pool that are ready to accept connections. |
Number |
|
||||||
|
Host without sessions |
Indicates the number of hosts in this host pool that are currently not running any user sessions. |
Number |
To know which hosts in the pool are currently not running any user sessions, use the detailed diagnosis of this measure. |
||||||
|
Need assistance |
Indicates the number of hosts in this host pool that are stuck in the 'Needs assistance' state. |
Number |
If a session host is in the 'Needs assistance' state, it means that the session host didn't pass one or more of the following non-fatal health checks:
To know which session hosts are in the 'Needs assistance' state, use the detailed diagnosis of this measure. You can find which health checks failed in the Azure portal by going to the Session hosts tab and selecting the name of your session host. |
||||||
|
FSLogix not healthy |
Indicates the number of session hosts in this host pool where FSLogix is 'not healthy'. |
Number |
When Azure Virtual Desktop (AVD) session hosts with FSLogix show as "not healthy," it usually indicates issues with the host's ability to connect to the FSLogix profile container or with the FSLogix agent itself. This can lead to login failures, slow logins, or profile corruption. Troubleshooting steps include checking FSLogix logs, verifying network connectivity, and ensuring proper configuration of FSLogix and Azure Virtual Desktop. Here are some of the more common causes for FSLogix issues and their troubleshooting steps:
To know which session hosts are in the 'FSLogix not healthy' state, use the detailed diagnosis of this measure. |
||||||
|
Not joined to domain |
Indicates the number of session hosts in this host pool that have not joined the domain. |
Number |
When session hosts in Azure Virtual Desktop (AVD) fail to join the domain, it can lead to connection issues and prevent users from accessing their resources. This problem often arises during the initial provisioning of session hosts or after they have been created and added to a host pool. Several factors can cause this. Here's a breakdown of common causes:
Troubleshooting Steps
By systematically addressing these potential issues, you can effectively troubleshoot and resolve domain join problems in your Azure Virtual Desktop environment. To know which session hosts failed to join the domain, use the detailed diagnosis of this measure. |
||||||
|
SxS stack listener not ready |
Indicates the number of session hosts (in this host pool) that encountered the 'SxS stack listener not ready' error. |
Number |
The SxS stack listener component is part of the Azure Virtual Desktop agent and is responsible for handling connections to the session host. If this component is not ready, it means the listener is not active, is not listening for connections, or is experiencing some other issue preventing it from functioning correctly. A failed SxS stack listener check is considered fatal, meaning users will not be able to connect to the session host until it's resolved. The value 0 is hence desired for this measure. If this measure reports a non-zero value instead, follow the troubleshooting steps outlined below:
To know which session hosts encountered the SxS stack listener not ready error, use the detailed diagnosis of this measure. |
||||||
|
Domain trust relationship lost |
Indicates the number of session hosts in this host pool that have lost their domain trust relationship. |
Number |
When session hosts in Azure Virtual Desktop (AVD) lose their domain trust relationship, users will be unable to connect to those session hosts. This typically manifests as a "trust relationship between this workstation and the primary domain failed" error. To resolve this, do the followig:
To know which session hosts lost their domain trust relationship, use the detailed diagnosis of this measure. |
Use the detailed diagnosis of the Status measure to view the friendly name of the host pool, host pool type, load balancer type, and maximum number of sessions allowed on the host pool.

Figure 3 : The detailed diagnosis of the Status measure reported by the AVD Session Hosts By Host Pools test
Use the detailed diagnosis of the Total session hosts measure to know which session hosts are in the host pool, where they are located, and what the current status of each session host is. Unavailable session hosts in the pool can be identified in this process. The detailed diagnostics also help administrators pinpoint the session hosts where upgrade has failed, and those session hosts that are running an outdated OS, agent, or side by side stack.
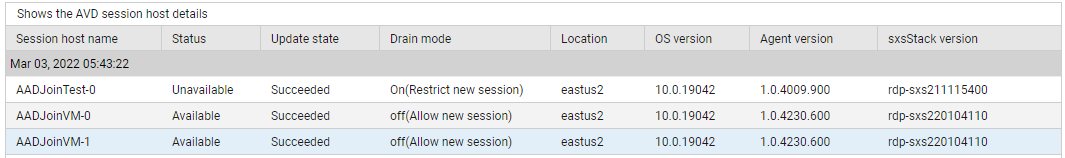
Figure 4 : The detailed diagnosis of the Total session hosts measure
To know for which session hosts in the pool the 'drain mode' has been set, use the detailed diagnosis of the Drain mode hosts measure.
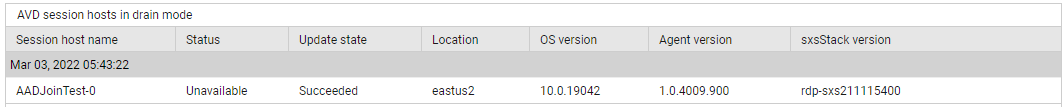
Figure 5 : The detailed diagnosis of the Drain mode hosts measure
Use the detailed diagnosis of the No heart beat hosts measure to identify the session hosts that have not sent any heartbeats during the last measurement period.
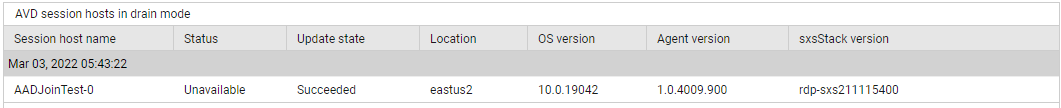
Figure 6 : The detailed diagnosis of the No heart beat hosts measure
Use the detailed diagnosis of the Idle hosts measure to identify the idle hosts in the pool.
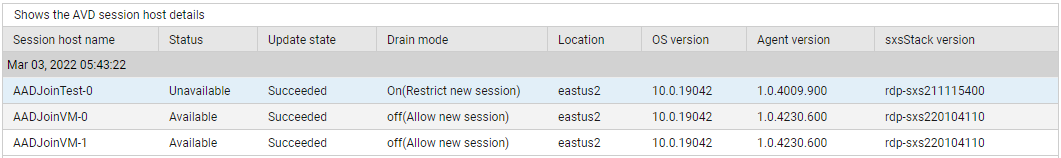
Figure 7 : The detailed diagnosis of the Idle hosts measure
Use the detailed diagnosis of the Unavailable hosts measure to know which hosts in the pool are unavailable.

Figure 8 : The detailed diagnosis of the Unavailable hosts measure
Use the detailed diagnosis of the Available hosts measure to know which hosts in the pool are available.
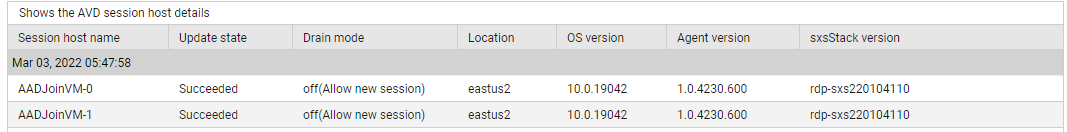
Figure 9 : The detailed diagnosis of the Available hosts measure