AVD User Logon Details Test
The process of a user logging into a RemoteApp/Desktop managed by an AVD broker is complex. Figure 1 depicts a typical logon process.
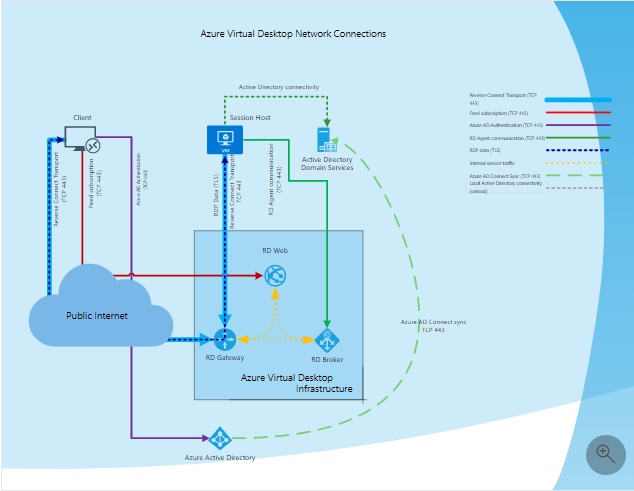
Figure 1 : A typical user logon process
The logon sequence is as discussed hereunder:
-
Using supported Azure Virtual Desktop client user subscribes to the Azure Virtual Desktop Workspace
-
Azure Active Directory authenticates the user and returns the token used to enumerate resources available to a user
-
Client passes token to the Azure Virtual Desktop feed subscription service
-
Azure Virtual Desktop feed subscription service validates the token
-
Azure Virtual Desktop feed subscription service passes the list of available desktops and RemoteApps back to the client in the form of digitally signed connection configuration
-
Client stores the connection configuration for each available resource in a set of .rdp files
-
When a user selects the resource to connect, the client uses the associated .rdp file and establishes the secure TLS 1.2 connection to the closest Azure Virtual Desktop gateway instance and passes the connection information
-
Azure Virtual Desktop gateway validates the request and asks the Azure Virtual Desktop broker to orchestrate the connection
-
Azure Virtual Desktop broker identifies the session host and uses the previously established persistent communication channel to initialize the connection
-
Remote Desktop stack initiates the TLS 1.2 connection to the same Azure Virtual Desktop gateway instance as used by the client
-
After both client and session host connected to the gateway, the gateway starts relaying the raw data between both endpoints, this establishes the base reverse connect transport for the RDP
-
After the base transport is set, the client starts the RDP handshake
As is evident from the discussion above, the logon process spans both the key tiers of the AVD infrastructure - the Microsoft-managed control plane tier on the cloud, and the customer-managed on-premises tier. A slowdown anywhere in the logon process, in any tier, can adversely impact the overall logon experience of a user. For instance, if a user's desktop request spends too much time in the control plane being load balanced, that user's logon experience will suffer. Likewise, if any group policy takes too long to be processed and applied during a logon, it can significantly delay the logon process at the customer end. To assure users of instant, on-demand access to virtual desktops at all times, administrators should monitor each user's logon experience with AVD in real-time, rapidly identify the user whose logon performance has degraded, and accurately isolate what problem in which tier is responsible for the degradation. eG Enterprise helps administrators achieve all of the above!
The AVD User Logon Details test monitors the logon experience of each AVD user, from when the broker processes that user's desktop request to when he/she is allowed access to a session host. In the process, the test shines the spotlight on users whose logon experience is sub-par. Additionally, the test measures the time spent by a user at each step of the logon process. This way, the test accurately pinpoints the root-cause of logon delays that a user may experience - is it owing to issues in the control plane? or is it because of slowness in the customer network? - if so, where in the customer end is the bottleneck? profile loading? setting up session environment? shell start-up? group policy processing? or others? Using the detailed diagnostics, administrators can also zero-in on the precise user session in which the logon experience was unsatisfactory, and why.
For deeper insights into a user's logon performance inside the customer network, you can use the User Logon Details - AVD test (mapped to the AVD Host Pool component). With the help of the User Logon Details - AVD test, administrators can figure out if an authentication delay (probably caused by a processing bottleneck on the AD / Azure AD in the customer's network) impacted the logon experience of the user. This test also leads administrators to the precise group policy and client side extension that was processed too slowly, thereby slowing down the user logon.
Note:
Typically, to consolidate log entries, correlate log data, and perform complex analysis, a host pool's logs are often sent to one/more Log Analytics Workspaces. This test reports valid metrics by reading data from these Log Analytics Workspaces only. If the host pool's logs are not sent to any Log Analytics Workspace, then this test will only report the value 0 for most of its measures. To avoid this, before configuring this test, make sure that the host pool's logs are configured to be sent to at least one Log Analytics Workspace. Follow the steps discussed in Configuring the Host Pool Logs to be Sent to a Log Analytics Workspace to achieve this.
Target of the test : A Microsoft AVD Broker
Agent deploying the test: A remote agent
Output of the test: One set of results for each user connecting to the AVD service
| Parameters | Description |
|---|---|
|
Test Period |
How often should the test be executed. |
|
Host |
The host for which the test is to be configured. |
|
Subscription ID |
Specify the GUID which uniquely identifies the Microsoft Azure Subscription to be monitored. To know the ID that maps to the target subscription, do the following:
|
|
Tenant ID |
Specify the Directory ID of the Azure AD tenant to which the target subscription belongs. To know how to determine the Directory ID, refer to Configuring the eG Agent to Monitor a Microsoft AVD Broker Using Azure ARM REST API |
|
Client ID and Client Password |
To collect the required metrics, the eG agent requires an Access token in the form of an Application ID and the client secret value. If a Microsoft Azure Subscription component or a Microsoft Azure Active Directory component is already being monitored, then an Application would have already been created for monitoring purposes. The Application ID and Client Secret of such an application can be specified here. However, if no such application exists, then you will have to create one for monitoring the AVD broker. To know how to create such an application and determine its Application ID and Client Secret, refer to Configuring the eG Agent to Monitor a Microsoft AVD Broker Using Azure ARM REST API. Specify the Application ID of the created Application in the Client ID text box and the client secret value in the Client Password text box. |
|
Proxy Host |
In some environments, all communication with the Azure cloud be routed through a proxy server. In such environments, you should make sure that the eG agent connects to the cloud via the proxy server and collects metrics. To enable metrics collection via a proxy, specify the IP address of the proxy server and the port at which the server listens against the Proxy Host and Proxy Port parameters. By default, these parameters are set to none, indicating that the eG agent is not configured to communicate via a proxy, by default. |
|
Proxy Username, Proxy Password and Confirm Password |
If the proxy server requires authentication, then, specify a valid proxy user name and password in the Proxy Username and Proxy Password parameters, respectively. Then, confirm the password by retyping it in the Confirm Password text box. |
|
Log Analytics Workspace Name |
Typically, to consolidate log entries, correlate log data, and perform complex analysis, a host pool's logs are often sent to one/more Log Analytics Workspaces. By default, the Log Analytics Workspace Name parameter is set to All. This indicates that the test reads log data from all Log Analytics Workspaces configured for the target subscription, by default. However, if you want the test to use only those Log Analytics Workspaces to which a host pool's logs are sent, then provide the names of these workspaces here as a comma-separated list. To determine the names of the workspaces, do the following:
|
|
DD Frequency |
Refers to the frequency with which detailed diagnosis measures are to be generated for this test. The default is 1:1. This indicates that, by default, detailed measures will be generated every time this test runs, and also every time the test detects a problem. You can modify this frequency, if you so desire. Also, if you intend to disable the detailed diagnosis capability for this test, you can do so by specifying none against DD frequency. |
|
Detailed Diagnosis |
To make diagnosis more efficient and accurate, eG Enterprise embeds an optional detailed diagnostic capability. With this capability, the eG agents can be configured to run detailed, more elaborate tests as and when specific problems are detected. To enable the detailed diagnosis capability of this test for a particular server, choose the On option. To disable the capability, click on the Off option. The option to selectively enable/disable the detailed diagnosis capability will be available only if the following conditions are fulfilled:
|


| Measurement | Description | Measurement Unit | Interpretation |
|---|---|---|---|
|
Total logon processing duration |
Indicates the total time taken by this user to log into an Azure virtual desktop. |
Secs |
If this value is abnormally high for any user, then, you can compare the time measurements reported by this test to know where exactly the user logon was bottlenecked - was it on the Microsoft-managed control plane? or on the customer-managed network? If the control plane is delaying the logon, then you can compare the value of the Orchestration duration, Load balancer duration, Transport duration, and RDP stack duration metrics to isolate where on the control plane the user request spent the most time -is it in orchestrating? transport? load balancing? or RDP stacking? If the customer network is where the problem is, then compare the time metrics displayed under the Logon Duration Breakups section to know when the delay was maximum - during session environment setup? profile loading? shell start-up? group policy processing? when being processed by the System event notification service or FSLogix service? or others? |
|
Orchestration duration |
Indicates the time taken by the broker to orchestrate this user's connection on the desktop. |
Secs |
|
|
Load balancer duration |
Indicates the time taken by the broker to load-balance the user's logon request. |
Secs |
|
|
Transport duration |
Indicates the time spent by this user's logon requests in transport. |
Secs |
|
|
RDP stack duration |
Indicates the time spent by this user's logon requests in the RDP stack. |
Secs |
|
|
Logon duration |
Indicates the total time this user's logon took in the customer's network. |
Secs |
If the value of the Total logon processing duration is abnormally high for a user, then compare the value of this measure with that of the Orchestration duration, Load balancer duration, Transport duration, and RDP stack duration measures to know what caused the user's logon experience to deteriorate - is it a orchestration / load balancing / transport / RDP stacking problem in the control plane? or a problem in the customer network? In the case of the latter, compare the values of all the duration metrics in the Logon Duration Breakup section to know where in the customer network the slowness originated. |
|
Desktop ready duration |
Indicates the time taken by this user's desktop to be readied for launch. |
Secs |
|
|
Application ready duration |
Indicates the time taken by this user's RemoteApp to be readied for launch. |
Secs |
|
|
RDP authentication duration |
Indicates the time taken by this user's RDP sessions to be authenticated. |
Secs |
If the RDP stack duration measure reports a very high value, then compare the value of these measures to know why this is so - is it because of a delay in authentication? authorization? or license check?
|
|
RDP authorization duration |
Indicates the time taken by this user's RDP sessions to be authorized. |
Secs |
|
|
RDP license check duration |
Indicates the time taken by this user's RDP sessions to check license availability. |
Secs |
|
|
Session environment duration |
Indicates the time taken by this user's logon to setup the session environment. |
Secs |
If the Logon duration measure reports an abnormally high value for a user, then compare the value of these metrics for that user to know where in the customer network the problem lies - in session environment setup? in processing by the system event notification service / FSLogix service / shell service? in profile loading? in group policy processing? or in other types of processing?
|
|
System event notification service duration |
The System Event Notification Service (SENS) creates a uniform connectivity and notification interface for applications. This measure indicates the time taken by this user's logon request to be processed by this system event notification service. |
Secs |
|
|
Profile load duration |
Indicates the time taken to load this user's profile. |
Secs |
|
|
Group policy processing duration |
Indicates the time taken by the user's group policies to be applied. |
Secs |
|
|
Terminal session duration |
Indicates the average time taken by all the Terminal sessions of this user. |
Secs |
|
|
FSLogix service duration |
Indicates the time taken by the FSLogix service to process this user's logon request. |
Secs |
|
|
Shell start duration |
Indicates the time taken to launch/start the default Windows 10 shell of this user's desktop. |
Secs |
|
|
Other processing duration |
Indicates the time spent by this user's logon in other types of processing. |
Secs |
|
|
Total sessions |
Indicates the total number of sessions for this user. |
Number |
Use the detailed diagnosis of this test to know more about the desktop sessions that are currently open for the user. The client from which each session connected, the subscription, resource group, and resource that was accessed in every session, and the total logon processing time per session are displayed as part of the detailed statistics. This way, you can quickly compare the logon time across sessions, and accurately identify the exact session in which the user took the longest to logon. A breakup of the logon duration is also available for each session, thus enabling you to accurately isolate the root-cause of the poor logon performance in that session. |
|
Shared sessions |
Indicates the number of shared sessions for this user. |
Number |
Use the detailed diagnosis of this test to know which are the shared sessions. |
|
Reconnected sessions |
Indicates the number of sessions for this user that reconnected. |
Number |
Use the detailed diagnosis to know which sessions of the user, reconnected. |
|
Shell ready duration |
Indicates the time elapsed between the start of the shell process and the time duration at which the shell is fully functional and ready for user interaction during this user's desktop logon process. |
Seconds |
A lower duration generally indicates a faster and more responsive logon experience, while a higher duration may suggest delays in the shell initialization that could negatively impact user productivity. |
|
Published application ready duration |
Indicates the time taken for a published application to become fully ready and responsive for this user soon after he/she initiated the launch process. |
Seconds |
The value of this measure encompasses all the necessary steps involved, from the application server preparing the application to the user's client device fully rendering and displaying it for interaction. Ideally, a low value is desired for this measure. Often, a low value indicates a faster and efficient application launch experience for the user. A high value for this measure often signals potential issues with the application server, network connectivity, or client-side performance. |
|
Security handshake duration |
Indicates the time taken for the server to complete the security handshake process during this user's logon. |
Seconds |
This duration is a critical factor in determining the overall logon experience for users, as it reflects the efficiency and responsiveness of the server in establishing a secure connection. A high value for this measure indicates potential issues with the server's security configuration, network latency, or the server's processing power, ultimately contributing to slower logon times and a degraded user experience. Administrators can use this measure to identify and resolve bottlenecks in the authentication and authorization process. |
|
Credential acquisition duration |
Indicates the amount of time taken for this user's credentials to be acquired during the logon process. |
Seconds |
This duration reflects the time spent authenticating the user and retrieving the necessary security tokens and permissions required to access the virtualized environment. A high value for this measure may indicate delays in authentication services or problems with the retrieval of user credentials, potentially impacting the overall user logon experience. |
|
RDP Shortpath duration |
Indicates the total time spent using the RDP Shortpath transport protocol during this user's logon. |
Seconds |
A low value is desired for this measure. Since RDP Shortpath is designed to improve performance by directly connecting the client to the session host, bypassing the traditional gateway, a low value for this measure generally indicates a faster and more efficient connection. A high value for this measure suggests potential network or configuration issues that hinder the performance of RDP Shortpath. |
|
FSLogix office container profile duration |
Indicates the time taken to load the Office container profile during this user's logon process. |
Seconds |
Ideally, a low value is desired for this measure. A lower value indicates a faster, more streamlined profile loading process, contributing to a better user experience. On the other hand, a high value for this measure suggests a potential bottleneck in profile loading, which could lead to slower logon times and user dissatisfaction. |
|
FSLogix profile container duration |
Indicates the time taken to load and attach this user's FSLogix profile container during the logon process. |
Seconds |
A high value for this measure indicates potential bottlenecks or performance issues within the storage infrastructure, network connectivity, or the FSLogix configuration itself, ultimately impacting the user's experience and logon times. |
|
OnClient disconnected duration |
Indicates the time elapsed from when this user's client device disconnects from the server to when the server recognizes that the client is no longer connected. |
Seconds |
A low value for this measure indicates efficient disconnection handling. A high value f or this measure often indicates network issues or server-side delays in recognizing and managing the disconnection. |
|
RDP stack disconnected duration |
Indicates the total time, for which the Remote Desktop Protocol (RDP) stack remained in a disconnected state for this user session on the server. |
Seconds |
A high value for this measure often indicates network instability, server resource constraints, or issues within the RDP service. |
|
New connection duration |
Indicates the time taken for a new network connection to be established to the server during this user's logon process. |
Seconds |
This measure indicates efficiency of the network infrastructure and the server's ability to handle incoming connection requests. A high value for this measure may indicate network latency, server overload, or potential issues with the network configuration. |
|
VM start duration |
Indicates the time taken for a virtual machine to become fully operational and ready for this user to login. |
Seconds |
Ideally, the value of this measure should be low. A high value for this measure may indicate performance bottlenecks within the infrastructure such as resource contention or low storage, hindering the speed at which users can begin their work. |
|
Shell ready interim delay |
Indicates the time elapsed between the shell environment becoming ready and the subsequent completion of interim processes or tasks necessary for this user's desktop to fully initialize and become interactive. |
Seconds |
A high value for this measure may indicate bottlenecks in resource allocation, application initialization, or profile loading that occur after the core shell environment is available, but before the user experience is completely ready. |
|
AppReadiness service duration |
Indicates the time taken for the AppReadiness service to complete the initialization process during this user's logon process. |
Seconds |
Ideally, the value of this measure should be low. A low value for this measure indicates a smoother and faster user experience, while a gradual/sudden increase in the value of this measure may indicate potential bottlenecks or issues related to application loading or configuration during the logon process. |