Azure Redis Cache Test
The Azure Redis Cache is a high-performance caching service that provides in-memory data store for faster retrieval of data. It is based on the open-source implementation Redis cache. This ensures low latency and high throughput by reducing the need to perform slow I/O operations. It also provides high availability, scalability, and security.
Figure 1 shows the cache workflow.
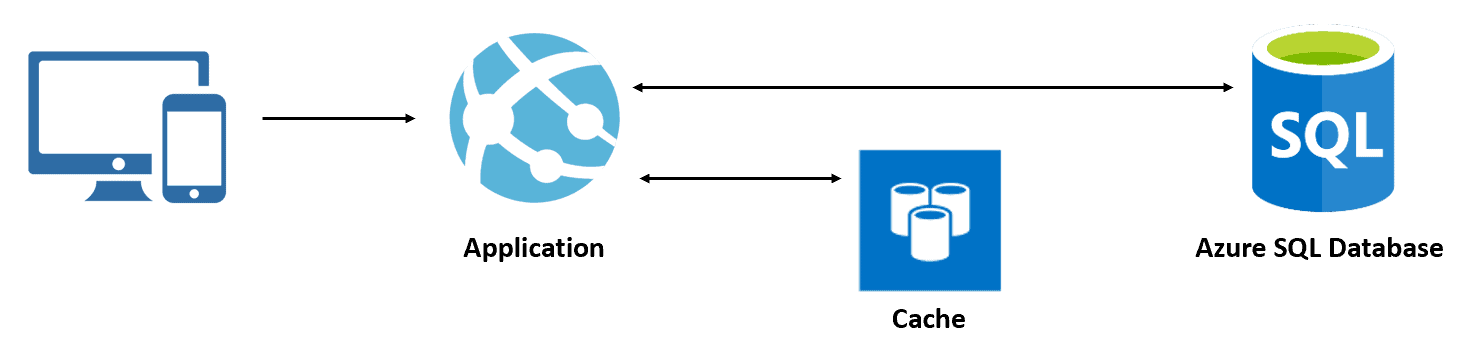
Figure 1 : How the Azure Redis Cache works?
When a user uses an application, the application tries to read data from the cache. If the requested data is not available in the cache, the application gets the data from the actual data source. Then the application stores that data in the cache for subsequent requests. When the next request comes to an application, it retrieves data from the cache without going to the actual data source. This process improves the application performance because data lives in memory. Also, it increases the availability of an application in case of unavailability of the database.
If the cache does not serve its purpose - i.e., if the cache repeatedly fails to service application requests or is slow when at it - the performance of the application will significantly deteriorate. To ensure the high availability and optimal usage of the cache, administrators need to track requests to and responses from the cache, promptly detect cache misses and latencies, diagnose the reasons for the same, and eliminate those reasons quickly. This is where the Azure Redis Cache test helps!
For each Redis cache that is created for a target Azure subscription, this test tracks the status of that cache, and alerts administrators if any cache is in an Error/Unknown state. The test also monitors the requests to and responses from every cache. In the process, the test measures the time taken by each cache to process application requests. If any cache takes an unusually long time to service requests, the test notifies administrators of the same. Similarly, if any cache fails to service requests consistently, the same is brought to the attention of the administrator. Additionally, the test also reveals the probable reasons for these anomalies - is it because the cache is running out of memory? is it because the cache is blocking/rejecting connections to it? is it owing to heavy load on the cache? or is it because of a failed failover attempt? The test also reveals if the cache is sized with adequate bandwidth and CPU for its operations. Alerts are sent out if the cache is running low on such critical resources.
Target of the Test: A Microsoft Azure Subscription
Agent deploying the test: A remote agent
Output of the test: One set of results for every Azure Cache for Redis that is configured in each resource group of the target Azure subscription
| Parameters | Description |
|---|---|
|
Test Period |
How often should the test be executed. |
|
Host |
The host for which the test is to be configured. |
|
Subscription ID |
This field will be automatically populated if you have chosen to automatically fulfill the pre-requisites for monitoring the Microsoft Azure Subscription. Specify the GUID which uniquely identifies the Microsoft Azure Subscription to be monitored in this text box
|
|
Tenant ID |
This field will be automatically populated if you have chosen to automatically fulfill the pre-requisites for monitoring the Microsoft Azure Subscription. Specify the Directory ID of the Azure Entra ID tenant to which the target subscription belongs in this text box |
|
Client ID, Client Password, and Confirm Password |
To connect to the target subscription, the eG agent requires an Access token in the form of an Application ID and the client secret value. For this purpose, you should register a new application with the Microsoft Entra tenant. To know how to create such an application and determine its Application ID and client secret, refer to Configuring the eG Agent to Monitor a Microsoft Azure Subscription Using Azure ARM REST API. Specify the Application ID of the created Application in the Client ID text box and the client secret value in the Client Password text box |
|
Proxy Host and Proxy Port |
In some environments, all communication with the Azure cloud be routed through a proxy server. In such environments, you should make sure that the eG agent connects to the cloud via the proxy server and collects metrics. To enable metrics collection via a proxy, specify the IP address of the proxy server and the port at which the server listens against the Proxy Host and Proxy Port parameters. By default, these parameters are set to none, indicating that the eG agent is not configured to communicate via a proxy, by default. |
|
Proxy Username, Proxy Password and Confirm Password |
If the proxy server requires authentication, then, specify a valid proxy user name and password in the Proxy Username and Proxy Password parameters, respectively. Then, confirm the password by retyping it in the Confirm Password text box. |
|
Detailed Diagnosis |
To make diagnosis more efficient and accurate, the eG Enterprise embeds an optional detailed diagnostic capability. With this capability, the eG agents can be configured to run detailed, more elaborate tests as and when specific problems are detected. To enable the detailed diagnosis capability of this test for a particular server, choose the On option. To disable the capability, click on the Off option. The option to selectively enable/disable the detailed diagnosis capability will be available only if the following conditions are fulfilled:
|


| Measurement | Description | Measurement Unit | Interpretation | ||||||||||
|---|---|---|---|---|---|---|---|---|---|---|---|---|---|
|
Status |
Indicates the current status of this cache. |
|
The values reported by this measure and its numeric equivalents are mentioned in the table below:
Note: By default, this measure reports the Measure Values listed in the table above to indicate the current provisioning status . The graph of this measure however, is represented using the numeric equivalents only. Use the detailed diagnosis to know the host name, port, and version of the cache. |
||||||||||
|
Latency |
Indicates the time taken by this cache to respond to requests. |
Secs |
A high value is indicative of a slow cache. This can adversely impact application performance. |
||||||||||
|
Total number of command processed |
Indicates the rate at which commands were processed by this cache. |
Commands/sec |
A consistent rise in the value of this measure is a sign of good health. On the other hand, a steady drop in the value of this measure hints at processing bottlenecks. In such a situation, look up the Memory used and CPU usage measures, and cache reads and writes to figure out if there are any resource contentions. A poorly sized cache can often be sluggish when responding to requests. You may want to consider increasing the resource allocations/limits for the cache, so that the cache has more processing power at its disposal. |
||||||||||
|
Cache hit ratio |
Indicates the ratio of failed cache lookups to the total number of requests received by this cache. |
Percent |
A value less than 80% is a cause for concern, as it implies that the cache has failed to service a large majority of requests to it. In such a situation, check the value of the Server load measure to see if there is any abnormal increase in load, causing the cache server to timeout without completing requests. This can cause cache misses. You can also check the Memory used and Memory fragmentation ratio measures to see if the cache has sufficient memory for storing data. Memory contention on the cache is one of the common causes for poor cache performance. |
||||||||||
|
Memory used |
Indicates the amount of memory used by this cache. |
MB |
If the value of this measure is close to that of the Maximum memory measure, it means that the cache is about to exhaust its memory allocation. Without enough memory, the cache will not be able to store data. This can result in cache misses, which in turn will affect application performance. To avoid a memory contention therefore, consider the following:
|
||||||||||
|
Memory fragmentation ratio |
Indicates the percentage of memory in this cache that is fragmented. |
Percent |
Fragmentation is likely to be caused when a load pattern is storing data with high variation in size. For example, fragmentation might happen when data is spread across 1 KB and 1 MB in size. When a 1-KB key is deleted from existing memory, a 1-MB key cannot fit into it causing fragmentation. Similarly, if 1-MB key is deleted and 1.5-MB key is added, it cannot fit into the existing reclaimed memory. This causes unused free memory and results in more fragmentation. The fragmentation can cause issues when:
|
||||||||||
|
Evicted keys |
Indicates the number of keys that have been evicted from this cache. |
Number |
If the cache is under severe memory pressure, you will want to see this measure report a high value. To increase the number of keys evicted, you may want to change the eviction policy. The default policy for Azure Cache for Redis is volatile-lru, which means that only keys that have a TTL value set are eligible for eviction. If no keys have a TTL value, then the system won't evict any keys. If you want the system to allow any key to be evicted if under memory pressure, then you may want to consider the allkeys-lru policy. |
||||||||||
|
Blocked clients |
Indicates the number of client connections to this cache that were blocked. |
Number |
Ideally, the value of this measure should be 0. |
||||||||||
|
Connected clients |
Indicates the number of clients currently connected to this cache. |
Number |
The maxclients setting governs the maximum number of connected clients allowed at the same time. If the value of this measure is equal to the maxclients setting, Redis closes all the new connections, returning a 'max number of clients reached' error. |
||||||||||
|
Connected slaves |
Indicates the number of slaves connected to this cache currently. |
Number |
|
||||||||||
|
Last interaction time between master and slave |
Indicates the time since the master and slave last interacted. |
Seconds |
A high value for this measure could be a sign that there are issues in master-slave communication. If these issues persist, failover attempts may fail, and the whole purpose of an HA configuration for the cache will be defeated. Moreover, if slaves do not communicate with the master, then delays in data replication will become inevitable. Timely replication of data between the master and slaves is key to ensuring that the data replicas are always in sync with the master. If they are not, then the slaves may not be able to service cache requests effectively, when the master is down. |
||||||||||
|
Total number of keys in database |
Indicates the number of keys in this cache's database. |
Number |
|
||||||||||
|
Unix timestamp of last save to disk |
Indicates when data in this cache was written to disk last. |
Number |
|
||||||||||
|
Number of changes to the database since last dump |
Indicates the number of changes that have been written to this cache's database since the last database update happened. |
Number |
|
||||||||||
|
Rejected connections |
Indicates the number of connections to this cache that were rejected. |
Number |
Ideally, the value of this measure should be 0. However, if this measure reports a non-zero value consistently, it could be because the maxclients setting is not set commensurate to the connection load on the cache. The maxclients setting governs the maximum number of connected clients allowed at the same time. If the value of the Connected clients measure is equal to the maxclients setting, then new connections are closed/rejected. |
||||||||||
|
Cache misses |
Indicates the number of failed key lookups in this cache. |
Number |
A healthy, optimal cache is one that is capable of servicing all requests to it. Ideally therefore, the value of this measure should be 0. A high value for this measure indicates that the cache has failed to service requests to it. In such a situation, check the value of the Server load measure to see if there is any abnormal increase in load, causing the cache server to timeout without completing requests. This can cause cache misses. You can also check the Memory used and Memory fragmentation ratio measures to see if the cache has sufficient memory for storing data. Memory contention on the cache is one of the common causes for poor cache performance. |
||||||||||
|
Link down time between master and slave |
Indicates the duration for which the link between the master and slave was down. |
Seconds |
A high value is a cause for concern. The longer the link is down, the longer replication will be delayed. Also, failover attempts will also fail during this period, thus rendering the cache unavailable for servicing requests. |
||||||||||
|
Memory used resident set size |
Indicates the amount of memory used in resident set size. |
MB |
|
||||||||||
|
Cache hits |
Indicates the number of successful key lookups in this cache. |
Number |
A high value is desired for this measure. |
||||||||||
|
Cache miss ratio |
Indicates the percentage of key lookups in this cache that failed. |
Percent |
A value close to 100% is a cause for concern, as it implies that the cache has failed to service almost all of the requests to it. In such a situation, check the value of the Server load measure to see if there is any abnormal increase in load, causing the cache server to timeout without completing requests. This can cause cache misses. You can also check the Memory used and Memory fragmentation ratio measures to see if the cache has sufficient memory for storing data. Memory contention on the cache is one of the common causes for poor cache performance. |
||||||||||
|
Maximum connections |
Indicates the maximum number of simultaneous connections that this cache is allowed to entertain. |
Number |
If the value of the Connected clients measure is equal to that of this measure, Redis closes all the new connections, returning a 'max number of clients reached' error. |
||||||||||
|
Total commands |
Indicates the total number of commands processed by this cache. |
Number |
|
||||||||||
|
Server load |
Indicates the current load on this cache server. |
Percent |
High server load means the Redis server is busy and unable to keep up with requests, leading to timeouts. Following are some options to consider for high server load.
|
||||||||||
|
Get operations from the cache |
Indicates the number of get operations from this cache. |
Number |
|
||||||||||
|
Set operations to the cache |
Indicates the number of set operations from this cache. |
Number |
|
||||||||||
|
Data reads from the cache |
Indicates the rate at which data was read from this cache. |
KB/Sec |
These measures are good indicators of the bandwidth used by the cache. Whenever there is a bandwidth contention, you can compare the value of these measures to know where the maximum bandwidth is spent - when reading from the cache? or when writing to it? |
||||||||||
|
Data writes from the cache |
Indicates the rate at which data was written to this cache. |
KB/Sec |
|||||||||||
|
CPU usage |
Indicates the percentage of CPU resources utilized by this cache. |
Percent |
A value close to 100% indicates excessive CPU usage. This can adversely impact cache performance. You may want to determine the root-cause of this excess, so that it can be removed and normalcy restored to the cache. |
Use the detailed diagnosis of the Status measure to know the host name, port, and version of the cache.
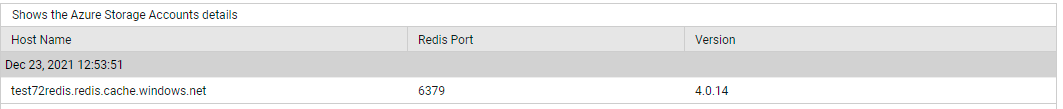
Figure 4 : The detailed diagnosis of the Status measure reported by the Azure Redis Cache test