Distributed Cache Usage Analytics Test
The Distributed Cache service, which is built on Windows Server AppFabric Cache, is set to run in a collocated mode on all SharePoint 2013 Servers by default. It's essential for maintaining the large amounts of information on your SharePoint Server, ensuring that the information is fresh and readily available for the end user.
Caching functionalities, provided by the Distributed Cache service, enable web applications deployed on SharePoint to quickly retrieve data without any dependency on databases stored in SQL Server, as everything is stored in memory.
Any SharePoint server in the farm running the Distributed Cache service is known as a cache host. Cache size is the memory allocated to the Distributed Cache service on the cache host.
At any given point in time, sufficient memory resources should be available to the Distributed cache service to ensure optimum cache usage and to assure SharePoint users of a satisfactory experience with their web applications. In the absence of adequate memory, cache lookups will be delayed or even missed, thus affecting overall SharePoint performance and adversely impacting the health of user interactions with the web applications.
It is hence imperative that administrators keep an eye on the usage of the cache service by each dependent web application, rapidly detect unexpected slowness in cache reads and writes, capture cache misses, and figure out if such anomalies are owing to the bad size of the Distributed cache service. This is what the Distributed Cache Usage Analytics test help administrators do!
This test queries the SharePoint Logging database and retrieves metrics revealing how each web application uses the distributed cache, from it. The metrics so collected reveal the following:
- Is any web application reading from and/or writing to the cache slowly? If so, which host is slow?
- Is any web application overloading the cache with read/write requests?
- Which web application is experiencing many cache misses?
- Are there any cache failures? If so, which web application failed to read from or write to the cache?
This way, the test brings cache usage and sizing irregularities to light, pinpoints the exact web application that is being impacted by these abnormalities, and thus prompts administrators to right-size the cache to ensure peak application performance.
Note:
- This test will run only if a SharePoint Usage and Health Service application is created and is configured to collect usage and health data. To know how to create and configure this application, follow the steps detailed in Configuring the eG Agent to Collect Usage Analytics.
- This test is not applicable when the target server is a Microsoft SharePoint 2010 server
Target of the test : A Microsoft SharePoint Server
Agent deploying the test : An internal/remote agent
Outputs of the test : One set of results for each web application in the monitored SharePoint server
| Parameters | Description |
|---|---|
|
Test period |
This indicates how often should the test be executed. |
|
Host |
The host for which the test is to be configured. |
|
Port |
The port at which the host server listens. |
|
SQL Port Number |
Specify the port number of the SQL server that hosts the SharePoint Logging database. |
|
Instance |
If the SQL server that hosts the SharePoint Logging database is instance-based, then provide the instance name here. If not, then set this to none. |
|
SSL |
If the SQL server hosting the SharePoint Logging database is SSL-enabled, then set this flag to Yes. If not, set it to No. |
|
Isntlmv2 |
In some Windows networks, NTLM (NT LAN Manager) may be enabled. NTLM is a suite of Microsoft security protocols that provides authentication, integrity, and confidentiality to users. NTLM version 2 (“NTLMv2”) was concocted to address the security issues present in NTLM. By default, the Isntlmv2 flag is set to No, indicating that NTLMv2 is not enabled by default on the SQL server that hosts the SharePoint Logging database. Set this flag to Yes if NTLMv2 is enabled on that SQL server. |
|
Database Domain |
Specify the fully qualified name of the domain in which the Microsoft SQL server hosting the SharePoint Logging database operates. For instance, your specification can be: SharePoint.eginnovations.com |
|
Database server Name |
Specify the name of Microsoft SQL server that hosts the SharePoint Logging database to be accessed by this test. |
|
Database Name |
Specify the name of the SharePoint Logging database that this test should access. |
|
Database User Name, Database Password, Confirm Password |
Specify the credentials of a user who has db_datareaderaccess to the SharePoint Logging database configured, in the Database User Name and Database Password text boxes. Then, confirm the password by retyping it in the Confirm Password text box. |
|
URL patterns to be ignored from monitoring |
By default, this test does not track requests to the following URL patterns: *.js,*.css,*.jpeg,*.jpg,*.png,*.asmx,*.ashx,*.svc,*.dlll. If required, you can remove one/more patterns from this default list, so that such patterns are monitored, or can append more patterns to this list in order to exclude them from monitoring. For instance, to additionally ignore URLs that end with .gif and .bmp when monitoring, you need to alter the default specification as follows: *.js,*.css,*.jpeg,*.jpg,*.png,*.asmx,*.ashx,*.svc,*.dlll,*.gif,*.bmp |
|
Ignore AjaxDelta Pages |
By default, this test ignores all requests to AjaxDelta pages. This is why, the Ignore AjaxDelta Pages is set to Yes by default. If you want the test to track requests to the AjaxDelta pages as well, set this flag to No. |
|
Fetch Farm Measures |
Typicaly, farm-level metrics - eg., metrics on farm status, site collections, usage analytics - will not vary from one SharePoint server in the farm to another. If these metrics are collected and stored in the eG database for each monitored server in the SharePoint farm, it is bound to unnecessarily consume space in the database and increase processing overheads. To avoid this, farm-level metrics collection is by default switched off for the member servers in the SharePoint farm, and enabled only if the server being monitored is provisioned as the Central Administration site. Accordingly, this parameter is set to If Central Administration by default. This default setting ensures that farm-level metrics are collected from and stored in the database for only a single SharePoint server in the farm. If you want to completely switch-off farm-level metrics collection for a SharePoint farm, then set this parameter to No. Some high-security environments may not allow an eG agent to be deployed on the Central Administration site. Administrators of such environments may however require farm-level insights into status and performance. To provide these insights for such environments, you can optionally enable farm-level metrics collection from any monitored member server in the farm, even if that server is not provisioned as the Central Administration site. For this, set this parameter to Yes when configuring this test for that member server. |
|
Domain, Domain User, Password, and Confirm Password |
If the Fetch Farm Measures flag of these tests is set to No or to If Central Administration Site, then this test should be configured with the credentials of a user with the following privileges:
On the other hand, if the Fetch Farm Measures flag of these tests is set to Yes, then the user configured for the tests not only requires the four privileges discussed above, but should also be part of the following groups on the eG agent host:
It is recommended that you create a special user for this purpose and assign the aforesaid privileges to him/her. Once such a user is created, specify the domain to which that user belongs in the Domain text box, and then, enter the credentials of the user in the Domain User and Password text boxes. To confirm the password, retype it in the Confirm Password text box. |
|
DD Frequency |
Refers to the frequency with which detailed diagnosis measures are to be generated for this test. The default is 1:1. This indicates that, by default, detailed measures will be generated every time this test runs, and also every time the test detects a problem. You can modify this frequency, if you so desire. Also, if you intend to disable the detailed diagnosis capability for this test, you can do so by specifying none against DD frequency. |
|
Detailed Diagnosis |
To make diagnosis more efficient and accurate, the eG Enterprise embeds an optional detailed diagnostic capability. With this capability, the eG agents can be configured to run detailed, more elaborate tests as and when specific problems are detected. To enable the detailed diagnosis capability of this test for a particular server, choose the On option. To disable the capability, click on the Off option. The option to selectively enable/disable the detailed diagnosis capability will be available only if the following conditions are fulfilled:
|
| Measurement | Description | Measurement Unit | Interpretation |
|---|---|---|---|
|
Reads |
Indicates the number of cache reads performed by this web application. |
Number |
|
|
Average read duration |
Indicates the average time taken by this web application to read from the cache. |
Msecs |
A low value is desired for this measure. A consistent increase in the value of this measure could indicate a reading bottleneck. One of the reasons for reading delays is insufficient memory for the cache on the host. You may want to right-size the cache to make sure that your requests are serviced quickly and efficiently. Reading delays can also occur if the cache is overloaded with read requests or too much data is to be read. Whenever this measure registers an abnormally high value for a web application, look up the value reported by the Reads and Average read size measures for the same web application to determine whether/not the slowness can be attributed to the count and size of the reads. |
|
Average read size |
Indicates how many kilobytes of data, on an average, are read from the cache by this web application. |
KB |
|
|
Writes |
Indicates the number of writes to the cache by this web application. |
Number |
|
|
Average write duration |
Indicates the average time taken by this web application to write to the cache. |
Msecs |
A low value is desired for this measure. A consistent increase in the value of this measure could indicate a writing bottleneck. One of the reasons for writing delays is insufficient memory for the cache. You may want to right-size the cache to make sure that your requests are serviced quickly and efficiently. Writing delays can also occur if the web application is overloading the cache with write requests or too much data is to be written. Whenever this measure registers an abnormally high value for a web application, look up the value reported by the Writes and Average writes size measure for the same application to determine whether/not the slowness can be attributed to the unusually high number and size of the writes. |
|
Average writes size |
Indicates how many kilobytes of data, on an average, are written to the cache by this web application. |
Number |
|
|
Misses |
Indicates the number of requests from this web application that were not serviced by the cache. |
Number |
Ideally, the value of this measure should be 0. If on the other hand, this measure value is close to the value of the Objects requested measure, it is a cause for serious concern, as it implies that almost all objects requested were not found in the cache. Under such circumstances, use the detailed diagnosis of this measure to know which web site addresses could not be found in the cache. One of the reasons for a high number of misses could be insufficient memory allocation to the cache service. In such a situation, you may want to increase the cache size by adding more memory. |
|
Hits |
Indicates the number of requests from this web application that were successfully served by this cache. |
Number |
Ideally, the value of this measure should be the same as the value of the Objects requested measure. If not, check whether the cache has enough memory, and if required, add more memory to it. |
|
Failures |
Indicates the number of cache failures experienced by this web application. |
Number |
Ideally, the value of this measure should be 0. If this measure reports a non-zero value, then use the detailed diagnosis of this measure to know which web site addresses were being looked up in the cache when the failures occurred. |
|
Objects requested |
Indicates the number of objects requested by this web application. |
Number |
|
Use the detailed diagnosis of the Misses measure to know which web site addresses could not be found in the cache.
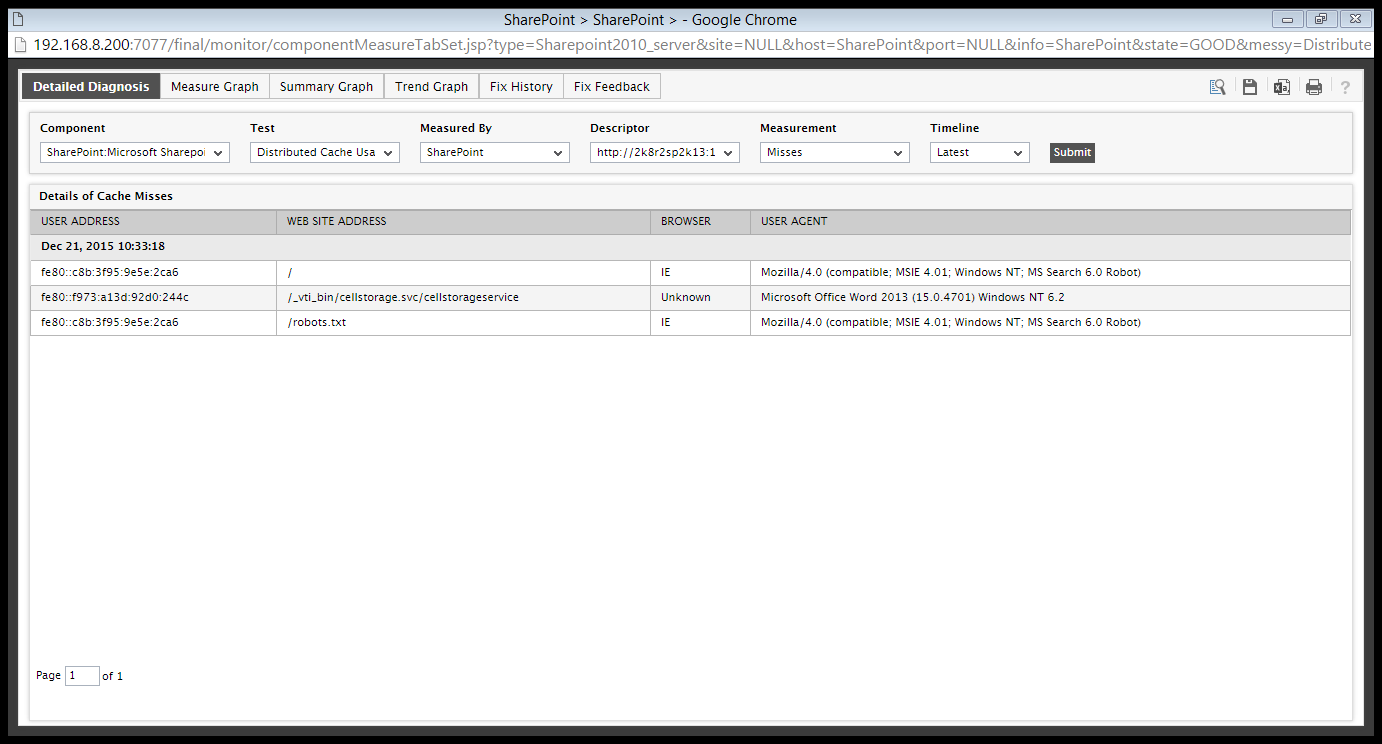
Figure 1 : The detailed diagnosis of the Misses measure
Use the detailed diagnosis of the Failures measure to know which web site addresses were being looked up in the cache when the failures occurred.
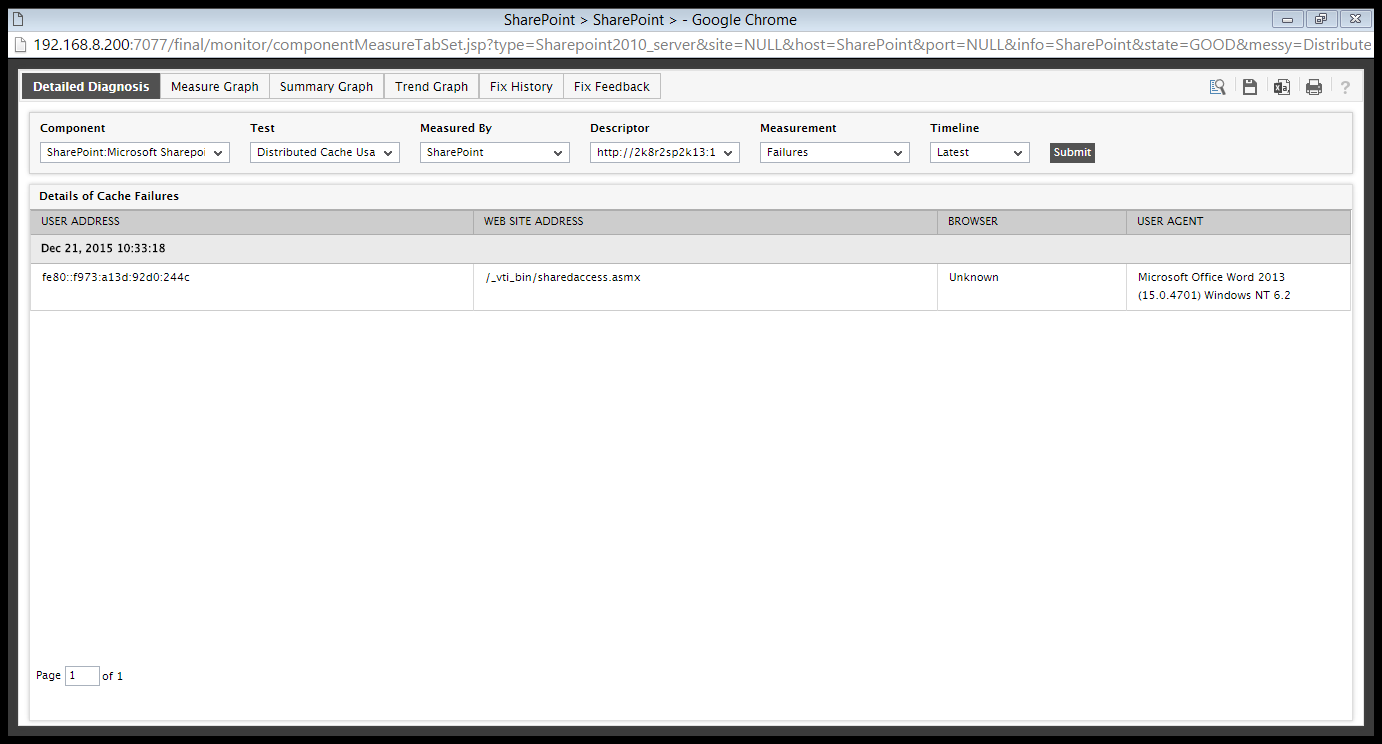
Figure 2 : The detailed diagnosis of the Failures measure