ULS Logs Test
The Unified Logging Service (ULS) writes SharePoint Foundation events to the SharePoint Trace Log, and stores them in the file system. ULS logging, when implemented effectively, can provide very useful information for developers, server administrators, and support personnel alike. The ULS logs can collect data at varying levels depending on the logging settings. Typically, every ULS log record indicates the diagnostic area and the specific category under the diagnostic area that has been traced.
Using the ULS Logs test, you can capture the number and nature of messages of various types and levels that are logged in the ULS logs. These statistics are grouped by area and category, so that you can instantly isolate the problem-prone categories and the diagnostic areas they belong to. This way, you will be enabled to investigate issues more efficiently and resolve them quickly.
For this test to run and report metrics, you need to enable the collection of health data on the SharePoint server. To know how to achieve this, refer to
Target of the test : A Microsoft SharePoint Server
Agent deploying the test : An internal agent
Outputs of the test : One set of results for each category in each diagnostic area
First-level descriptor: Area
Second-level descriptor: Category
| Parameters | Description |
|---|---|
|
Test period |
This indicates how often should the test be executed. |
|
Host |
The host for which the test is to be configured. |
|
Port |
The port at which the host server listens. |
|
Fetch Farm Measures |
Typically, farm-level metrics – eg., metrics on farm status, site collections, usage analytics – will not vary from one SharePoint server in the farm to another. If these metrics are collected and stored in the eG database for each monitored server in the SharePoint farm, it is bound to unnecessarily consume space in the database and increase processing overheads. To avoid this, farm-level metrics collection is by default switched off for the member servers in the SharePoint farm, and enabled only if the server being monitored is provisioned as the Central Administration site. Accordingly, this parameter is set to If Central Administration by default. This default setting ensures that farm-level metrics are collected from and stored in the database for only a single SharePoint server in the farm. If you want to completely switch-off farm-level metrics collection for a SharePoint farm, then set this parameter to No. Some high-security environments may not allow an eG agent to be deployed on the Central Administration site. Administrators of such environments may however require farm-level insights into status and performance. To provide these insights for such environments, you can optionally enable farm-level metrics collection from any monitored member server in the farm, even if that server is not provisioned as the Central Administration site. For this, set this parameter to Yes when configuring this test for that member server. |
|
Domain, Domain User, Password, and Confirm Password |
If the Fetch Farm Measures flag of these tests is set to No or to If Central Administration Site, then this test should be configured with the credentials of a user with the following privileges:
On the other hand, if the Fetch Farm Measures flag of these tests is set to Yes, then the user configured for the tests not only requires the four privileges discussed above, but should also be part of the following groups on the eG agent host:
It is recommended that you create a special user for this purpose and assign the aforesaid privileges to him/her. Once such a user is created, specify the domain to which that user belongs in the Domain text box, and then, enter the credentials of the user in the Domain User and Password text boxes. To confirm the password, retype it in the Confirm Password text box. |
|
Detailed Diagnosis |
To make diagnosis more efficient and accurate, the eG Enterprise embeds an optional detailed diagnostic capability. With this capability, the eG agents can be configured to run detailed, more elaborate tests as and when specific problems are detected. To enable the detailed diagnosis capability of this test for a particular server, choose the On option. To disable the capability, click on the Off option. The option to selectively enable/disable the detailed diagnosis capability will be available only if the following conditions are fulfilled:
|
| Measurement | Description | Measurement Unit | Interpretation |
|---|---|---|---|
|
Medium severity messages |
Indicates the number of messages of a medium severity that are currently logged in the ULS log for this category of this area. |
Number |
Medium severity messages represent all messages except Verbose and VerboseEx messages. Such messages record all high-level information about operations that were performed. These messages provide enough detail to construct the data flow and sequence of operations. Administrators or support professionals could use such messages to troubleshoot issues. Use the detailed diagnosis of this measure to view the complete description of the top-10 recent medium severity messages logged in the ULS log for a specific category of an area. |
|
High severity messages |
Indicates the number of messages of a high severity that are currently logged in the ULS log for this category of this area. |
Number |
High severity messages record all events that are unexpected but which do not stop the processing of a solution. Use the detailed diagnosis of this measure to view the complete description of the top-10 recent high severity messages logged in the ULS log for a specific category of an area. |
|
Monitorable messages |
Indicates the number of monitorable messages that are currently logged in the ULS log for this category of this area. |
Number |
Monitorable messages capture all unrecoverable events that limit the functionality of the solution but do not stop the application. Use the detailed diagnosis of this measure to view the complete description of the top-10 recent monitorable messages logged in the ULS log for a specific category of an area. |
|
Warning messages |
Indicates the number of warning messages that are currently logged in the ULS log for this category of this diagnostic area. |
Number |
This message type indicates a potential problem or issue that might require attention. You should review and track warning messages for patterns over time. Use the detailed diagnosis of this measure to view the complete description of the top-10 recent warning messages logged in the ULS log for a specific category of an area. |
|
Error messages |
Indicates the number of error messages that are currently logged in the ULS log for this category of this area. |
Number |
A message of this type indicates an urgent condition. You should investigate all error events. Use the detailed diagnosis of this measure to view the complete description of the top-10 recent error messages logged in the ULS log for a specific category of an area. |
|
Critical messages |
Indicates the number of critical messages that are currently logged in the ULS log for this category of this area. |
Number |
This message type indicates a serious error that has caused a major failure in the solution. Use the detailed diagnosis of this measure to view the complete description of the top-10 recent critical messages logged in the ULS log for a specific category of an area. |
|
Unexpected messages |
Indicates the number of unexpected messages logged in the ULS log for this category of this area. |
Number |
Unexpected messages record events that cause solutions to stop processing. Use the detailed diagnosis of this measure to view the complete description of the top-10 recent unexpected messages logged in the ULS log for a specific category of an area. |
Use the detailed diagnosis of the Medium severity messages measure to view the complete description of the top-10 recent medium severity messages logged in the ULS log for a specific category of an area.
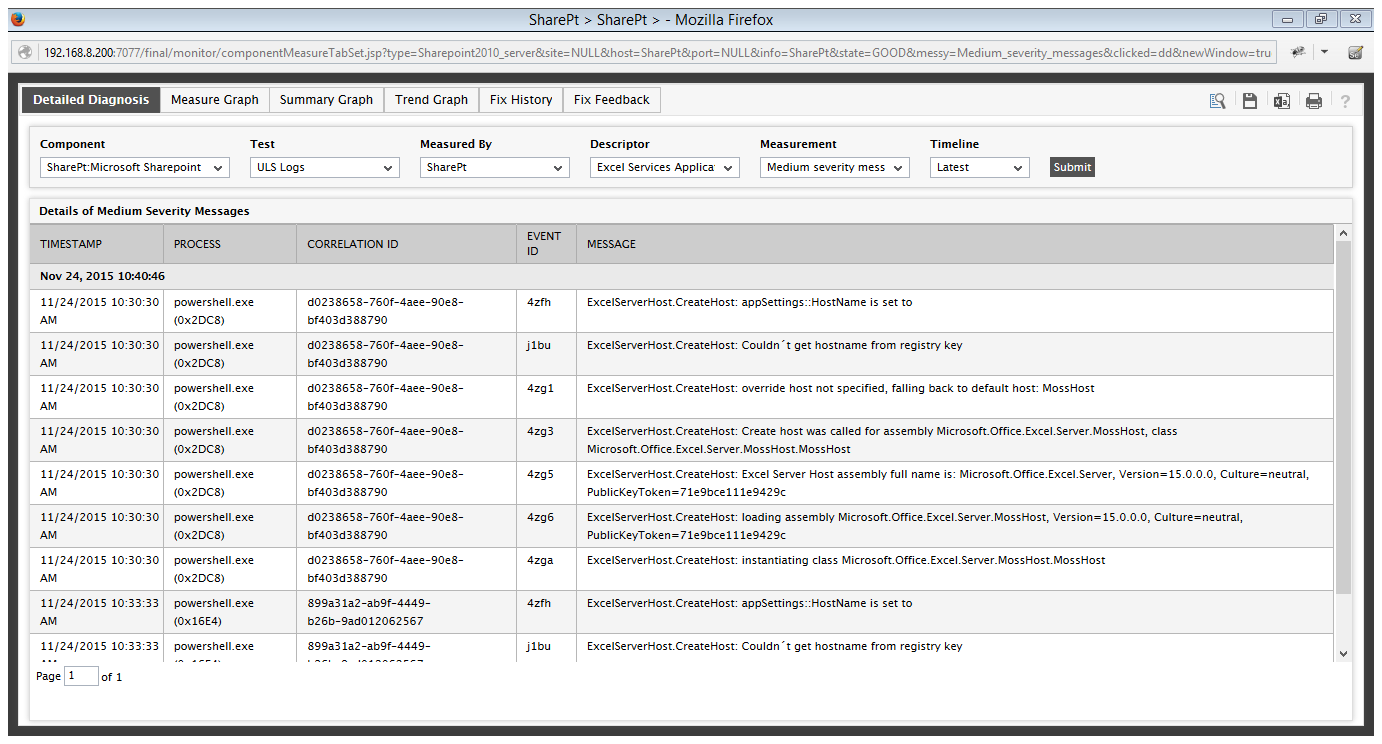
Figure 1 : The detailed diagnosis of the Medium severity messages measure
Use the detailed diagnosis of the High severity messages measure to view the complete description of the top-10 recent high severity messages logged in the ULS log for a specific category of an area.
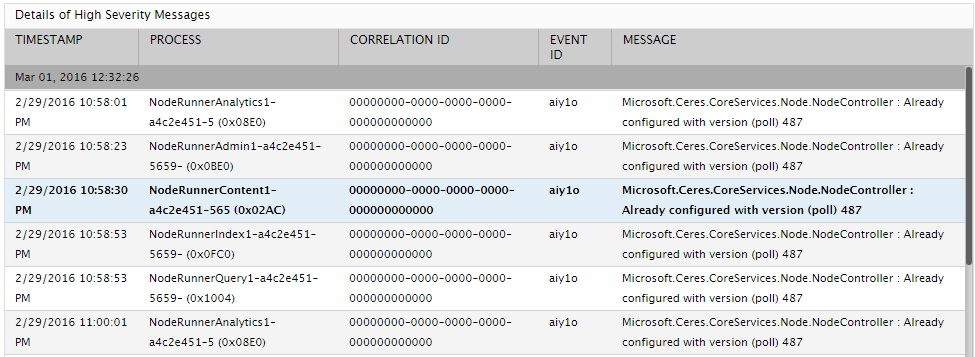
Figure 2 : The detailed diagnosis of the High severity messages measure
The detailed diagnosis of all the measures reported by the ULS Logs test also point to a correlation ID. Correlation Ids are GUIDs assigned to events which transpire during the lifecycle of a resource request. An administrator can then use the correlation Id to locate and isolate the request in the ULS log. Correlation Ids also span machine boundaries, so in the event a conversion crosses a machine boundary, such as a Web front-end calling a Web service on an application server, etc., a unique Correlation Id is assigned to the conversation enabling a complete view of the request and what transpired during the operation. This way, administrators can dig deeper and troubleshoot issues more effectively.
Configuring the eG Agent to Monitor ULS Logs
The ULS Logs test can run and report metrics only if health data collection is enabled on the target SharePoint server. To achieve this, follow the steps below:
-
In the SharePoint management console, select the Monitoring node under Central Administration. Then, click on the Configure usage and health data collection option under Reporting (see Figure 3).
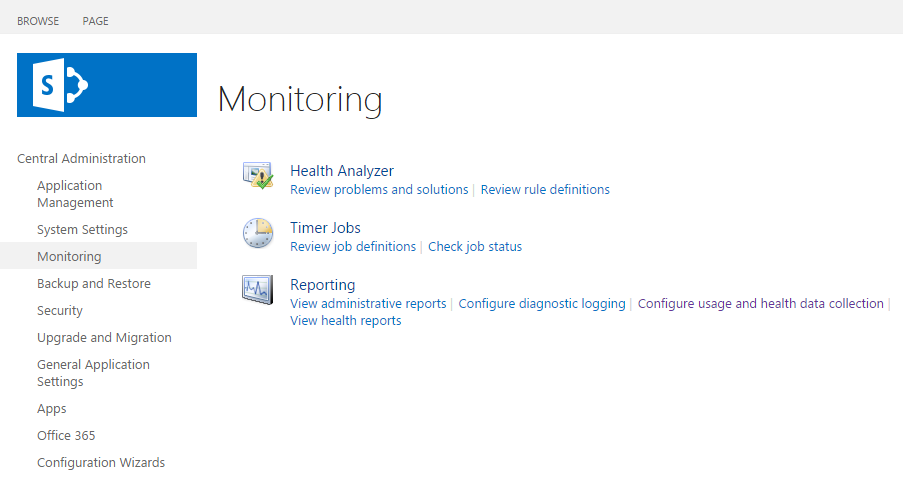
Figure 3 : Selecting the Configure usage and health data collection option
-
Figure 4 will then appear.
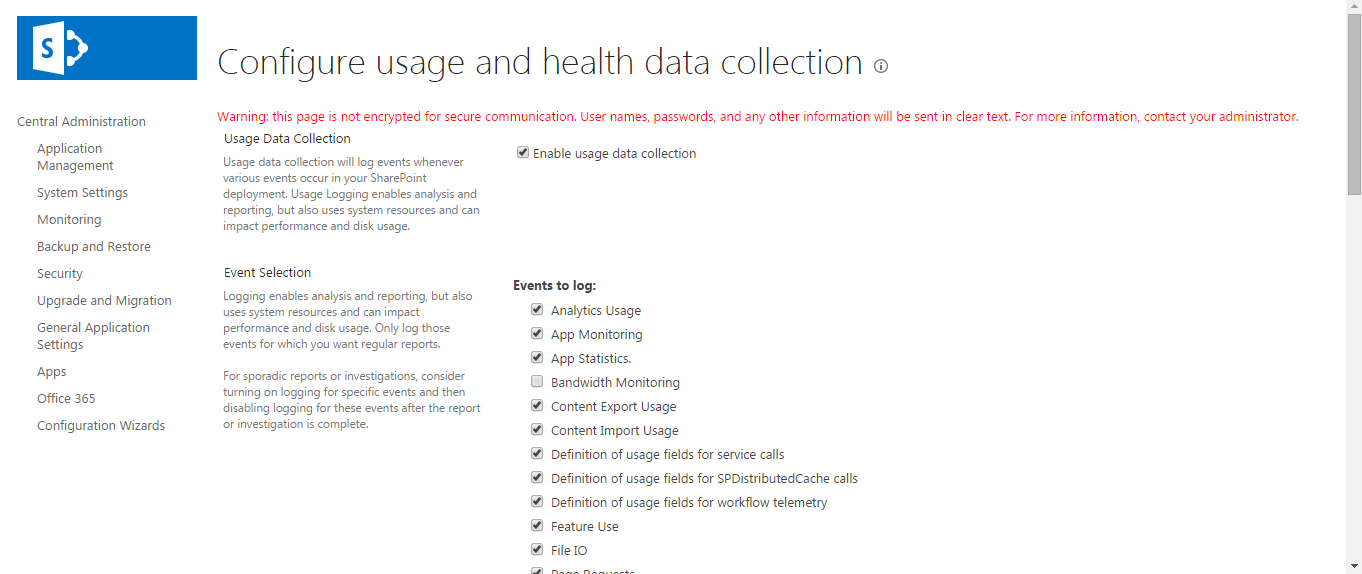
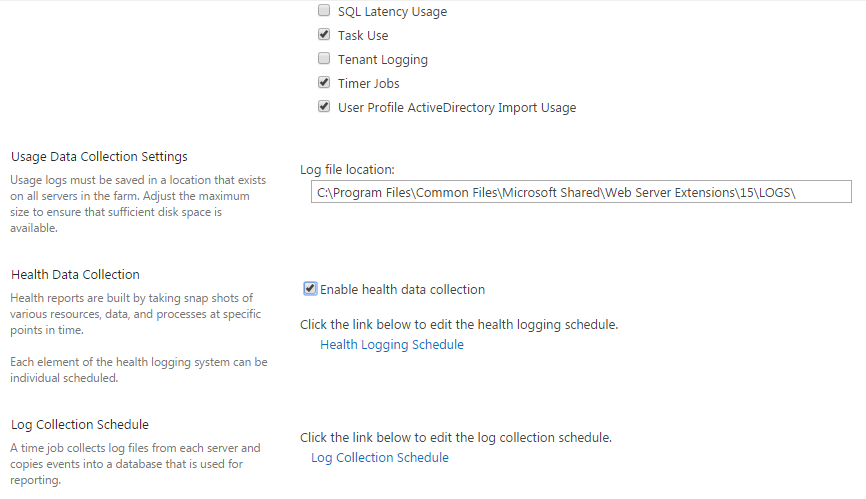
Figure 4 : Scrolling down the ‘Configure usage and health data collection’ page
-
Scroll down Figure 5 and then select the Enable health data collection check box that becomes visible.