AWS EC2 Instance Performance Test
Amazon Elastic Compute Cloud (Amazon ) is a web service that provides resizable compute capacity in the cloud. An instance is a virtual server in Amazon’s Elastic Compute Cloud () for running applications on the Amazon Web Services (AWS) infrastructure. Since users may run mission-critical applications on these instances, high uptime of the instances is imperative to the uninterrupted functioning of these applications and to ensure 100% user satisfaction with this cloud-based service. AWS administrators therefore, should frequently perform health checks on every instance, measure its load and resource usage, and capture potential failures and resource contentions, well before end-users notice and complain. This is exactly where the AWS EC2 Instance Performance test helps!
This test monitors the powered-on state of each instance and promptly alerts administrators if any instance has been powered-off inadvertently. Additionally, the test also reveals how each instance uses the CPU, disk, and network resources it is configured with, thus providing early pointers to irregularities in instance sizing, and prompting administrators to make necessary amends. This way, the test makes sure that critical applications are always accessible to end-users and perform at peak capacity.
Target of the test: Amazon Cloud
Agent deploying the test: A remote agent
Output of the test: One set of results for each instance / auto scaling group / instance type / image ID in each region of the AWS cloud being monitored, depending upon the option chosen from the Filter Name drop-down
First-level descriptor: AWS region name
Second-level descriptor: instance ID / auto scaling group name / instance type / image ID
| Parameter | Description |
|---|---|
|
Test Period |
How often should the test be executed. |
|
Host |
The host for which the test is to be configured. |
|
Access Type |
eG Enterprise monitors the AWS cloud using AWS API. By default, the eG agent accesses the AWS API using a valid AWS account ID, which is assigned a special role that is specifically created for monitoring purposes. Accordingly, the Access Type parameter is set to Role by default. Furthermore, to enable the eG agent to use this default access approach, you will have to configure the eG tests with a valid AWS Account ID to Monitor and the special AWS Role Name you created for monitoring purposes.
Some AWS cloud environments however, may not support the role-based approach Note that the Secret option may not be ideal when monitoring high-security cloud environments. This is because, such environments may issue a security mandate, which would require administrators to change the Access Key and Secret Key, often. Because of the dynamicity of the key-based approach, Amazon recommends the Role-based approach for accessing the AWS API. |
|
AWS Account ID to Monitor |
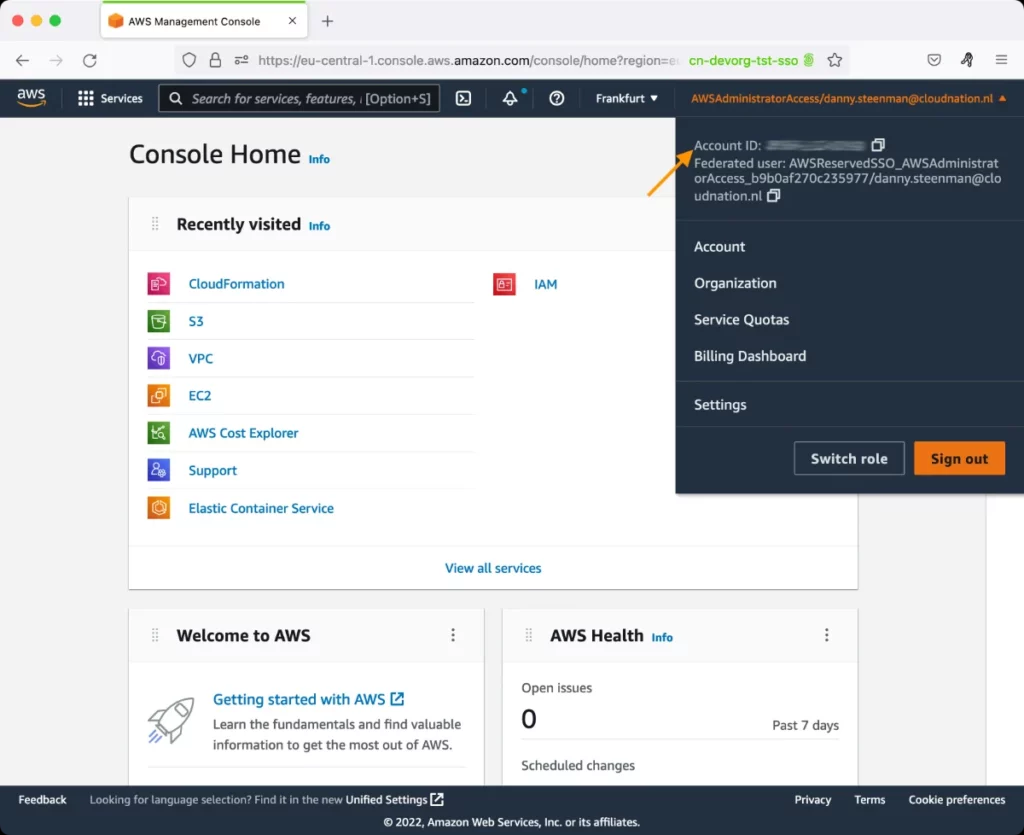
This parameter appears only when the Access Type parameter is set to Role. Specify the AWS Account ID that the eG agent should use for connecting and making requests to the AWS API. To determine your AWS Account ID, follow the steps below:
|
|
AWS Role Name |
This parameter appears when the Access Type parameter is set to Role. Specify the name of the role that you have specifically created on the AWS cloud for monitoring purposes. The eG agent uses this role and the configured Account ID to connect to the AWS Cloud and pull the required metrics. To know how to create such a role, refer to Creating a New Role. |
|
AWS Access Key, AWS Secret Key, Confirm AWS Access Key, Confirm AWS Secret Key |
These parameters appear only when the Access Type parameter is set to Secret.To monitor an Amazon cloud instance using the Secret approach, the eG agent has to be configured with the access key and secret key of a user with a valid AWS account. For this purpose, we recommend that you create a special user on the AWS cloud, obtain the access and secret keys of this user, and configure this test with these keys. The procedure for this has been detailed in the Obtaining an Access key and Secret key topic. Make sure you reconfirm the access and secret keys you provide here by retyping it in the corresponding Confirm text boxes. |
|
Proxy Host and Proxy Port |
In some environments, all communication with the AWS cloud and its regions could be routed through a proxy server. In such environments, you should make sure that the eG agent connects to the cloud via the proxy server and collects metrics. To enable metrics collection via a proxy, specify the IP address of the proxy server and the port at which the server listens against the Proxy Host and Proxy Port parameters. By default, these parameters are set to none , indicating that the eG agent is not configured to communicate via a proxy, by default. |
|
Proxy User Name, Proxy Password, and Confirm Password |
If the proxy server requires authentication, then, specify a valid proxy user name and password in the proxy user name and proxy password parameters, respectively. Then, confirm the password by retyping it in the CONFIRM PASSWORD text box. By default, these parameters are set to none, indicating that the proxy sever does not require authentication by default. |
|
Proxy Domain and Proxy Workstation |
If a Windows NTLM proxy is to be configured for use, then additionally, you will have to configure the Windows domain name and the Windows workstation name required for the same against the proxy domain and proxy workstation parameters. If the environment does not support a Windows NTLM proxy, set these parameters to none. |
|
Exclude Region |
Here, you can provide a comma-separated list of region names or patterns of region names that you do not want to monitor. For instance, to exclude regions with names that contain 'east' and 'west' from monitoring, your specification should be: *east*,*west* |
|
Default Connection Region |
By default, this test connects to the endpoint URL of the us-east-1 region to collect the required metrics. If the default us-east-1 region is not enabled in the target environment, then, for this test to collect the required metrics, specify the region that is enabled in the target environment. |
|
Exclude Instance |
This parameter is applicable only if InstanceId is chosen from the Filter Name drop-down. In this case, against Exclude Instance, you can provide a comma-separated list of instance IDs you do not want the test to monitor. |
|
Filter Name |
By default, this test reports metrics for each instance in the AWS infrastructure. This is why, the Filter Name flag is set to Instance ID by default. Alternatively, you can configure this test to aggregate metrics across a chosen collection of instances, and report one set of metrics per collection. For this, you just need to pick an instance collection from the Filter Name drop-down. The options available are as follows:
|
|
Detailed Diagnosis |
To make diagnosis more efficient and accurate, the eG Enterprise embeds an optional detailed diagnostic capability. With this capability, the eG agents can be configured to run detailed, more elaborate tests as and when specific problems are detected. To enable the detailed diagnosis capability of this test for a particular server, choose the On option. To disable the capability, click on the Off option. The option to selectively enable/disable the detailed diagnosis capability will be available only if the following conditions are fulfilled:
|
|
Measurement |
Description |
Measurement Unit |
Interpretation |
|||||||||||||||||||||
|---|---|---|---|---|---|---|---|---|---|---|---|---|---|---|---|---|---|---|---|---|---|---|---|---|
|
Instance power-on state: |
Indicates the current powered-on state of this instance. |
|
This measure is reported only if InstanceID is the option from the Filter Name drop-down of this test. The values that this measure can report and their corresponding numeric values are detailed in the table below:
Note: By default, this measure will report the Measure Values listed in the table above to indicate the current powered-on state of an instance. In the graph of this measure however, the same will be represented using the numeric equivalents only. |
|||||||||||||||||||||
|
EBS volumes
|
Indicates the number of EBS volumes attached to this instance. |
Number |
This measure is reported only if the InstanceId option is chosen from the Filter Name drop-down of this test. You can attach an EBS volumes to one of your instances that is in the same Availability Zone Availability Zone as the volume. You can attach multiple volumes to the same instance within the limits specified by your AWS account. Your account has a limit on the number of EBS volumes that you can use, and the total storage available to you. Using the detailed diagnosis of this measure, you can identify the volumes that are attached to this instance. |
|||||||||||||||||||||
|
CPU credit usage: |
Indicates the number of CPU credits consumed by this T2 instance / all T2 instances / all T2 instances created from this image ID during the last measurement period. |
Number |
This measure is reported only for individual T2 instances, the T2 instance type, and the image ID using which T2 instances (if any) were created. A CPU Credit provides the performance of a full CPU core for one minute. Traditional Amazon instance types provide fixed performance, while T2 instances provide a baseline level of CPU performance with the ability to burst above that baseline level. The baseline performance and ability to burst are governed by CPU credits. One CPU credit is equal to one vCPU running at 100% utilization for one minute. Other combinations of vCPUs, utilization, and time are also equal to one CPU credit; for example, one vCPU running at 50% utilization for two minutes or two vCPUs running at 25% utilization for two minutes. Each T2 instance starts with a healthy initial CPU credit balance and then continuously (at a millisecond-level resolution) receives a set rate of CPU credits per hour, depending on instance size. When a T2 instance uses fewer CPU resources than its base performance level allows (such as when it is idle), the unused CPU credits (or the difference between what was earned and what was spent) are stored in the credit balance for up to 24 hours, building CPU credits for bursting. When your T2 instance requires more CPU resources than its base performance level allows, it uses credits from the CPU credit balance to burst up to 100% utilization. The more credits your T2 instance has for CPU resources, the more time it can burst beyond its base performance level when more performance is needed. This implies that ideally, the value of the CPU credit usage measure should be low for an instance and the value of the CPU credit balance for that instance should be high, as that way, an instance is assured of more CPU resources when performance demands increase. By comparing the value of this measure across instances, you can precisely identify the instance that has used up a sizeable portion of its CPU credits. |
|||||||||||||||||||||
|
CPU credit balance:
|
Indicates the number of CPU credits that have been earned by this T2 instance / all T2 instances / all T2 instances created from this image ID |
Number |
||||||||||||||||||||||
|
CPU utilization: |
Indicates the percentage of allocated compute units that are currently in use on this instance. |
Percent |
A value close to 100% indicates excessive usage of CPU by an instance. If the value of this measure is consistently high for an instance, it could indicate that the application running on that instance requires more processing power. In such a case, you may want to allocate more CPU resources to that instance. |
|||||||||||||||||||||
|
Disk read operations: |
Indicates the rate at which read operations were performed on all disks available to this instance. |
Operations/Sec |
Compare the value of this measure across instances to know which instance is too slow in processing read requests. |
|||||||||||||||||||||
|
Disk write operations: |
Indicates the rate at which write operations were performed on all disks available to this instance. |
Operations/Sec |
Compare the value of this measure across instances to know which instance is too slow in processing write requests. |
|||||||||||||||||||||
|
Disk reads: |
Indicates the rate at which data was read from all disks available to this instance. |
KB/Sec |
Compare the value of this measure to identify the instance that is the slowest in responding to read requests. |
|||||||||||||||||||||
|
Disk writes: |
Indicates the rate at which data was written to all disks available to this instance. |
KB/Sec |
Compare the value of this measure to identify the instance that is the slowest in responding to write requests. |
|||||||||||||||||||||
|
Incoming network traffic:
|
Indicates the rate at which data was received by all network interfaces of this instance. |
KB/Sec |
Compare the value of these measures across instances to know which instance is consuming too much bandwidth. Then, compare the value of the Incoming network traffic and Outgoing network traffic measures of that instance to determine where bandwidth consumption was more - when receiving data over the network? or when sending data? |
|||||||||||||||||||||
|
Outgoing network traffic: |
Indicates the rate at which data was sent by all the network interfaces of this instance. |
KB/Sec |
||||||||||||||||||||||
|
EC2 status check:
|
Indicates whether a status check (system status check or instance status check) failed for this instance |
|
Amazon performs automated checks on every running instance to identify hardware and software issues. These status checks are of two types: system and instance status checks. If either of these status checks fails, then this measure will report the value Failed. If none of these status checks fail, then this measure will report the value Passed. The values that this measure can report and their corresponding numeric values are listed in the table below:
Note: By default, this measure reports the Measure Values above to indicate whether a check passed or failed. In the graph of this measure however, the same is indicated using the numeric equivalents only. |
|||||||||||||||||||||
|
EC2 instance status check: |
Indicates whether/not this instance passed the instance status check in the last minute. |
|
Instance status checks monitor the software and network configuration of your individual instance. These checks detect problems that require your involvement to repair. When an instance status check fails, typically you will need to address the problem yourself (for example, by rebooting the instance or by making instance configuration changes). The following are examples of problems that can cause instance status checks to fail:
The values that this measure can report and their corresponding numeric values are listed in the table below:
Note: By default, this measure reports the Measure Values above to indicate whether a check passed or failed. In the graph of this measure however, the same is indicated using the numeric equivalents only. |
|||||||||||||||||||||
|
EC2 system status check: |
Indicates whether/not this instance passed the system status check in the last minute. |
Number |
System status checks monitor the AWS systems required to use your instance to ensure they are working properly. These checks detect problems with your instance that require AWS involvement to repair. When a system status check fails, you can choose to wait for AWS to fix the issue, or you can resolve it yourself (for example, by stopping and starting an instance, or by terminating and replacing an instance). The following are examples of problems that can cause system status checks to fail:
The values that this measure can report and their corresponding numeric values are listed in the table below:
Note: By default, this measure reports the Measure Values above to indicate whether a check passed or failed. In the graph of this measure however, the same is indicated using the numeric equivalents only. |
|||||||||||||||||||||
|
Incoming network packets |
Indicates the number of packets received on all network interfaces by this instance. |
Number |
This metric identifies the volume of incoming traffic in terms of the number of packets on a single instance. By comparing the value of this measure across instances, you can identify that instance which is seeing the maximum incoming traffic. |
|||||||||||||||||||||
|
Outgoing network packets |
Indicates the number of packets sent out on all network interfaces by this instance. |
Number |
This metric identifies the volume of outgoing traffic in terms of the number of packets on a single instance. By comparing the value of this measure across instances, you can identify that instance which is seeing the maximum outgoing traffic. |
|||||||||||||||||||||
|
Disk IOPS |
Indicates the rate at which read and write operations were performed on all disks available to this instance. |
Operations/Sec |
Compare the value of this measure across instances to identify the busiest instance in terms of I/O activity. If the value of this measure is abnormally high for an instance, it could hint at a potential I/O overload. |
|||||||||||||||||||||
|
Disk throughput |
Indicates the rate at which data was read from and written into all disks available to this instance. |
KB/Sec |
Compare the value of this measure across instances to identify the instance with the lowest disk throughput. |
|||||||||||||||||||||
|
Network throughput |
Indicates the amount of data received and sent on all network interfaces by this instance. |
KB/Sec |
Compare the value of this measure across instances to identify the instance with the highest network throughput. If any instance is sized with limited bandwidth resources, a high network throughput may choke the instance. |
|||||||||||||||||||||
|
Uptime of instance |
Indicates the total time that this instance has been up since its last reboot. |
Mins |
This measure displays the number of years, months, days, hours, minutes and seconds since the last reboot. |
Detailed Diagnosis:
Using the detailed diagnosis of the EBS volumes measure, you can identify the volumes that are attached to a particular instance.
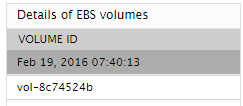
Figure 2 : The detailed diagnosis of the EBS volumes measure