Code Exceptions Test
In Node.js, an exception is a type of an event, that occurs while executing or running a program that disrupts the normal flow of the program and returns to the system. This is generally an unexpected or unwanted event which can occur either at compile-time or run-time in application code. Node.js developers often struggle to detect and manage the 'run-time' exceptions, as it is difficult to predict when they will occur. Most commonly, such exceptions may occur when specific application code transactions are performed on the target Node.js application. If such transactions are not promptly captured, then application developers may not be able to determine where in the application code the corresponding exceptions need to be handled or how to handle them. As a result, the transactions will continue to throw Node.js exceptions, thereby impacting user experience with the target application. To avoid this, it is important to quickly identify which transactions throw Node.js exceptions. This is where the Code Exceptions test helps!
This test automatically groups business transactions to a target application based on run-time Node.js exceptions that eG Node.js BTM detects in them. For each such exception-based transaction group, the test then reports the count of transactions in which those exceptions were observed. In the process, the test sheds light on those Node.js exceptions that have affected the maximum number of transactions. The detailed diagnosis of the test (if enabled) reveals which transactions were affected by which Node.js exceptions.
Target of the Test : A BTM-enabled Node.js application
Agent deploying the test : An internal/remote agent
Output of the test : One set of results is reported for each type of Node.js exception captured in business transactions. For the Summary descriptor, metrics are aggregated across all Node.js exceptions.
| Parameter | Description |
|---|---|
|
Test Period |
How often should the test be executed. |
|
Host |
The host for which this test is to be configured. |
|
Port |
Specify the port at which the specified Host listens |
|
Enable Rootcause Exception Tracking |
A single Node.js exception in a transaction may sometimes trigger one or more child exceptions in the same transaction. In such situations, knowing which Node.js exception is the 'source' of all child exceptions, including the exception in question, will help application developers figure out how to handle that exception in code. In such cases, the exception captured at source is treated as the 'parent' of all the child exceptions it spawns, and is hence deemed to be the root-cause of the exceptions. By default, this flag is set to No, indicating that by default, the detailed diagnosis of this test does not reveal the 'root-cause' of the Node.js exception. If this flag is set to Yes, then detailed diagnosis will enable you to trace down a transaction stack to hierarchically view a specific number (set using the Max exception cause depth parameter in Figure 2) of parent Node.js exceptions that had occurred in that transaction, before the monitored exception occurred. |
|
Mask Exception Message |
If exceptions are captured by the eG Node.js BTM, then, you can drill down to the detailed diagnostics to view the exception message that was captured due to the exception. If any of these exception messages include confidential information such as passwords, then eG Enterprise will mask the passwords in the query using the '*' (asterisk) character. This way, eG Enterprise protects your business-critical data from abuse by intruders. Accordingly, you should set this flag to Yes. However, for some reason, if you want the confidential information such as password to be visible in clear text in the Exception Message column displayed as part of the detailed analytics, then you can retain the default setting of this flag i.e., No. |
|
DD Frequency |
Refers to the frequency with which detailed diagnosis measures are to be generated for this test. The default is 1:1. This indicates that, by default, detailed measures will be generated every time this test runs, and also every time the test detects a problem. You can modify this frequency, if you so desire. Also, if you intend to disable the detailed diagnosis capability for this test, you can do so by specifying none against DD frequency. |
|
Detailed Diagnosis |
To make diagnosis more efficient and accurate, the eG Enterprise embeds an optional detailed diagnostic capability. With this capability, the eG agents can be configured to run detailed, more elaborate tests as and when specific problems are detected. To enable the detailed diagnosis capability of this test for a particular server, choose the On option. To disable the capability, click on the Off option. The option to selectively enable/disable the detailed diagnosis capability will be available only if the following conditions are fulfilled:
|
| Measurement | Description | Measurement Unit | Interpretation |
|---|---|---|---|
|
Exceptions |
Indicates the number of transactions that encountered this Node.js exception during the last measurement period. For the Summary descriptor, this indicates the total number of transactions that encountered Node.js exceptions during the last measurement period, regardless of the exception type. |
Number |
Compare the value of this measure across Node.js exceptions to identify the exception that has affected the performance of the maximum number of transactions. Use the detailed diagnosis of this measure to know which transactions were affected by Node.js exceptions of this type. |
|
Exceptions per minute |
Indicates the number of transactions that encountered this Node.js exception per minute. For the Summary descriptor, this measure will report the total number of transactions per minute that threw Node.js exceptions, regardless of the exception type. |
Number |
Compare the value of this measure across Node.js exceptions to determine which type of exception was frequently encountered by the target application. |
|
Exception percentage |
Indicates the percentage of transactions that encountered this Node.js exception during the last measurement period. For the Summary descriptor, this measure will report the percentage of total transactions that encountered Node.js exceptions, regardless of the exception type. |
Number |
Compare the value of this measure across Node.js exceptions to determine which type of exception affected a majority of the transactions. |
Note:
By default, the detailed diagnosis of this test only reveals which business transactions were affected by a specific type of Node.js exception. However, it does not reveal what is the cause of that exception. To obtain useful root-cause analytics from the detailed diagnosis of this test, do the following:
-
Login to the eG administrative interface.
-
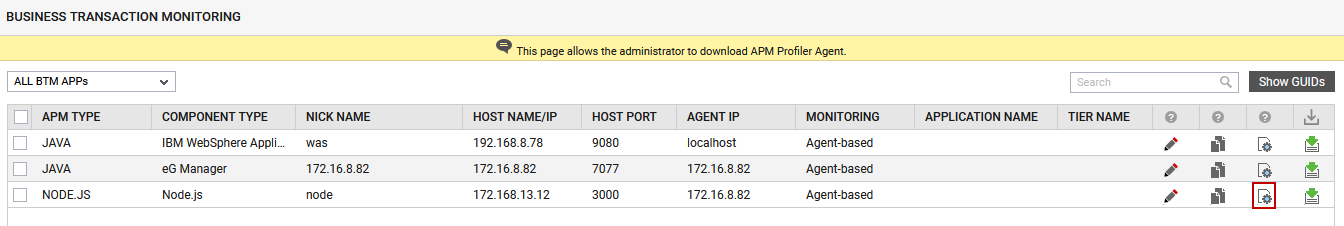
Navigate through the menu sequence: Admin -> Agents -> BTM Profiler Settings. Figure 1 will then appear.
-
In Figure 1, clicking the
 icon will lead you to the ADVANCED SETTINGS pop up window. Clicking the Exception and Error option in the left panel of the ADVANCED SETTINGS window will reveal Figure 2.
-
In the context-sensitive Exception and Error right panel of Figure 2, do the following:
-
Enable Capture cause of exception flag: By default, this flag is set to Disable. Set this flag to Enable, if you want the detailed diagnosis of the test to reveal the Node.js exception that is the immediate cause of the exception in question. In other words, if the Node.js exception in question occurred soon after and as a result of another exception in the same transaction, then setting this flag to Enable will display that parent transaction in the detailed diagnosis.
-
Set Max exception cause depth value: A single Node.js exception in a transaction may sometimes trigger one or more child exceptions in the same transaction. In such situations, knowing which Node.js exception is the 'source' of all child exceptions, including the exception in question, will help application developers figure out how to handle that exception in code. In such cases, the exception captured at source is treated as the 'parent' of all the child exceptions it spawns, and is hence deemed to be the root-cause of the exceptions. By default, the Enable Rootcause Exception Tracking flag is set to No in the test configuration page, indicating that by default, the detailed diagnosis of this test does not reveal the 'root-cause' of the Node.js exception. If the Enable Rootcause Exception Tracking flag is set to Yes in the test configuration page, then the detailed diagnosis will enable you to trace down a transaction stack to hierarchically view a specific number of parent Node.js exceptions that had occurred in that transaction, before the monitored exception occurred. By default, this specific number is 15. Accordingly, the Max exception cause depth parameter is set to 15 by default. You can increase the value of this parameter, so you can view more parent Node.js exceptions in the detailed diagnosis and perform root-cause analytics effectively. For instance, if this value is set to 20, then the detailed diagnosis of the test will trace back from the exception in question to display 20 parent Node.js exceptions that occurred before it.
-