Node.js Event Loop Test
Node.js is a single-threaded event-driven platform that is capable of running non-blocking, asynchronous programming. These functionalities of Node.js make it memory efficient. The event loop allows Node.js to perform non-blocking I/O operations despite the fact that JavaScript is single-threaded. An event loop is an endless loop, which waits for tasks, executes them, and then sleeps until it receives more tasks. The event loop executes tasks (starting from the oldest) from the event queue only when the call stack is empty i.e. there is no ongoing task. When Node.js starts, it initializes the event loop, processes the provided input script which may make asynchronous API calls, schedules timers, then begins processing the event loop.
If the event loops initialized by the target Node.js server experiences unusual setbacks or time delays, then, it may have an adverse effect on the performance of the Node.js server which in turn may affect the business to a larger extent. Therefore it is essential for the administrators to monitor the event loops initialized by the Node.js server and the time taken for the event loops to complete the tasks. The Node.js Event Loop test helps administrators in this regard.
This test reports the total number of event loops initialized on each instance of the target Node.js server and also reports the time spent for a single event loop. The time duration for which event loops were idle and active is also tracked periodically and reported. The time lag noticed between the scheduling of a callback and its execution on an event loop helps administrators identify performance bottlenecks due to long running codes and initiate troubleshooting steps at the earliest.
Target of the test : A Node.js V8 Engine
Agent deploying the test : An internal agent
Outputs of the test : One set of results for each instance of the target Node.js server being monitored
| Parameter | Description |
|---|---|
|
Test Period |
How often should the test be executed. |
|
Host |
The IP address of the host for which this test is to be configured. |
|
Port |
The port at which the target Host listens to. By default this is 3000. |
|
DD Frequency |
Refers to the frequency with which detailed diagnosis measures are to be generated for this test. The default is 1:1. This indicates that, by default, detailed measures will be generated every time this test runs, and also every time the test detects a problem. You can modify this frequency, if you so desire. Also, if you intend to disable the detailed diagnosis capability for this test, you can do so by specifying none against DD frequency. |
|
Detailed Diagnosis |
To make diagnosis more efficient and accurate, the eG Enterprise embeds an optional detailed diagnostic capability. With this capability, the eG agents can be configured to run detailed, more elaborate tests as and when specific problems are detected. To enable the detailed diagnosis capability of this test for a particular server, choose the On option. To disable the capability, click on the Off option. The option to selectively enable/disable the detailed diagnosis capability will be available only if the following conditions are fulfilled:
|
| Measurement | Description | Measurement Unit | Interpretation |
|---|---|---|---|
|
Maximum time spent for a single event loop |
Indicates the maximum time spent for a single event loop by this instance. |
Milliseconds |
|
|
Minimum time spent for a single event loop |
Indicates the minimum time spent for a single event loop by this instance. |
Milliseconds |
|
|
Total time spent in event loop |
Indicates the total time spent in event loop by this instance. |
Milliseconds |
|
|
Total number of event loops |
Indicates the total number of event loops initialized by this instance. |
Number |
|
|
Event loop average time |
Indicates the average time taken to complete an event loop initialized by this instance. |
Milliseconds |
|
|
Event loop lag time |
Indicates the time lag between the scheduling of a callback and its execution on an event loop initialized by this instance. |
Milliseconds |
If there is a sudden/gradual increase in the value of this measure, it indicates that more synchronous code is being executed and it is high time that the administrators tweak their Node.js API codes for better performance. A lag of more than 100 ms should be an alarm for further investigation and lags over 300 ms are usually a serious problem condition. In order to keep the value of this measure at check, administrators need to avoid long running blocking codes. |
|
Number of worker processes |
Indicates the number of worker processes executing on this instance. |
Number |
|
|
Event loop idle time |
Indicates the time duration for which the event loop remained idle on this instance. |
Milliseconds |
This measure helps administrators track how busy the event loop processing was. |
|
Event loop active time |
Indicates the time duration for which the event loop remained active on this instance. |
Milliseconds |
This measure helps administrators track how busy the event loop processing was. |
|
Event loop utilization |
Indicates the percentage utilization of the event loops that are initialized by this instance. |
Percent |
The detailed diagnosis of this measure lists the top 10 CPU consuming functions that are executing on an event loop. By knowing the time spent for each event loop, you can figure out the application that takes time to return control to the event loop and is blocking the execution of any code in the page. |
|
Process id |
Indicates the Process ID of this instance. |
Number |
|
The detailed diagnosis of the Event loop utilization measure lists the top 10 functions that are consuming CPU when an event loop is initialized to execute the functions on the target Node.js V8 Engine.
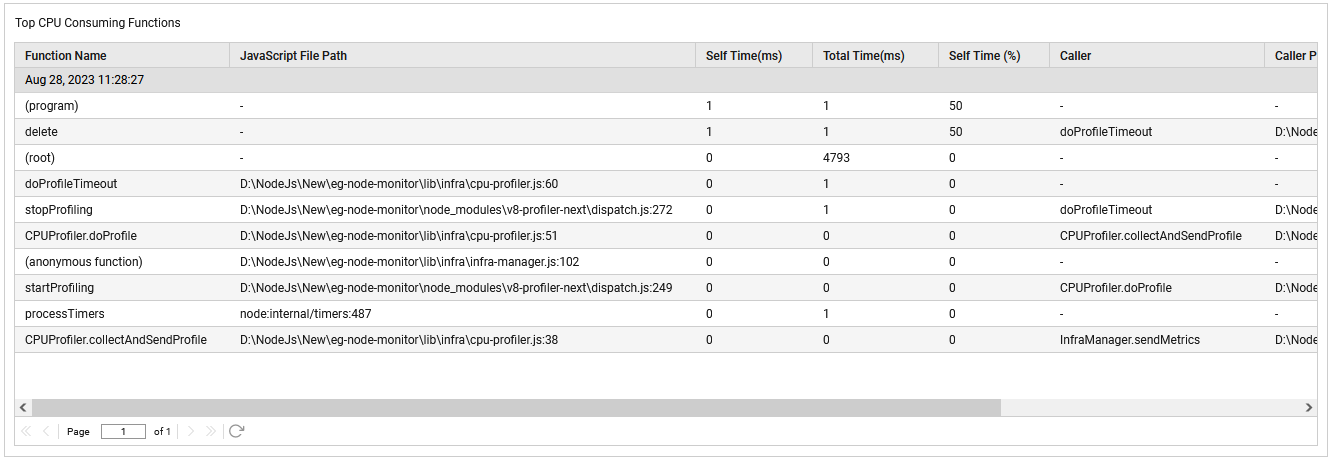
Figure 1 : The detailed diagnosis of the Event loop utilization measure