Monitoring Oracle 9i Application Servers
eG Enterprise prescribes an exclusive O9i Application Server monitoring model (see Figure 1), which runs tests on all the key components of the Oracle 9iAS from its JVM, JDBC drivers, caches, to its web modules, web contexts, transactions, etc. By automatically analyzing the performance data extracted by these tests from the server, eG Enterprise proactively detects potential bottlenecks to performance, accurately pin-points the root-cause of these problems, and instantly alerts administrators to the problem source.
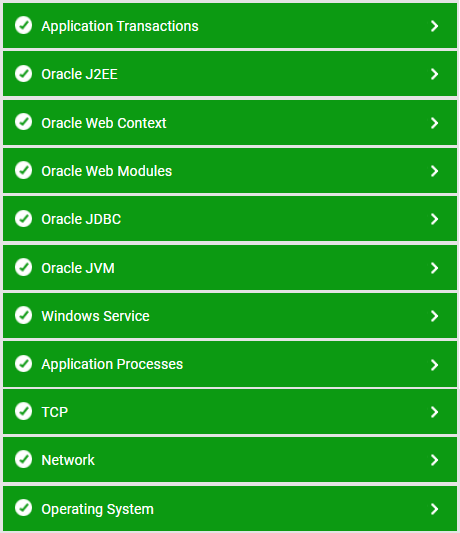
Figure 1 : The layer model of the Oracle 9i AS
Each layer of the monitoring model depicted by Figure 1 monitors and reports metrics on every performance-influencing aspect of the Oracle 9i AS. Using these metrics, administrators can determine the following:
- Is the Oracle JVM available?
- Does the JVM have sufficient free memory?
- Is the workload on the JVM optimal?
- Is the server able to connect to the database quickly?
- Are too many JDBC connections open on the server?
- Does the connection cache have adequate free connections?
- Is the connection cache utilized effectively?
- Are transaction rollbacks kept at a minimum?
- Are the web modules processing requests quickly?
- Is any web module taking too much time to process requests?
- Does the server take too much time to service JSP and servlet requests?
The sections below discuss the metrics reported by the top 5 layers of Figure 1 only, as all other layers have been dealt with in the Monitoring Unix and Windows Servers document.