Partition Statistics Test
A partition manages bandwidth for a traffic class' aggregate flows, so that all of the flows for the class are controlled together as one.
Partitions can be used to:
-
Protect mission-critical traffic by guaranteeing that a traffic class always gets a defined amount of bandwidth
-
Limit aggressive, non-critical traffic by allowing that traffic class to consume only a defined amount of bandwidth
-
Divide capacity
-
Assign bandwidth dynamically to users
-
Oversubscribe your link
There are two types of partitions that can be created: static or dynamic.
A static partition manages bandwidth for all flows within a particular traffic class. Static partitions can be fixed or burstable.
-
A fixed partition allows an aggregate traffic class to use a defined amount of bandwidth, if needed. A fixed partition not only ensures that a specific amount of bandwidth will be available, but it also limits traffic to that same level.
-
A burstable partition allows an aggregate traffic class to use a defined amount of bandwidth, and also allows that traffic class to access additional unused bandwidth, if needed. You can put a cap on a burstable partition, allowing it to access upto a maximum amount of bandwidth, or you can allow a burstable partition potentially to consume all available bandwidth.
In situations where administrators may want to apply bandwidth limits to individual users, they can establish dynamic sub partitions for the traffic class. A dynamic partition carves up a static partition's bandwidth, creating sub partitions on the fly for new users. Subpartitions are children of a static partition.
Partitions protect traffic by guaranteeing a defined amount of bandwidth for mission-critical traffic classes. If the traffic to a partition is gradually increasing or if suddenly administrators notice too much of data/packet drops on a partition, then, the traffic flow to the traffic class may be disrupted. This may lead to attacks on the servers/devices that are connected to the load balancers. To avoid such abnormalities, administrators may often need to monitor the partitions round the clock. The Partition Statistics test helps administrators in this regard!
This test auto-discovers the partitions that are available in the target PacketShaper S-Series load balancer and reports how well data/packets were transmitted by each partition. Administrators can capture packets that were dropped and figure out how frequently data/packets were retransmitted. This way, problematic partitions on which frequent data/packet drops were noticed can be isolated and administrators can start investigating on the real issues leading to such data/packet drops.
Target of the test : PacketShaper Load Balancer S-Series
Agent deploying the test : An external agent
Outputs of the test : One set of the results for each partition configured on the target PacketShaper Load Balancer S-Series device that is being monitored
| Parameter | Description |
|---|---|
|
Test period |
How often should the test be executed |
|
Host |
The IP address of the host for which this test is to be configured. |
|
SNMPPort |
The port at which the monitored target exposes its SNMP MIB; the default is 161. |
|
SNMPVersion |
By default, the eG agent supports SNMP version 1. Accordingly, the default selection in the SNMPversion list is v1. However, if a different SNMP framework is in use in your environment, say SNMP v2 or v3, then select the corresponding option from this list. |
|
SNMPCommunity |
The SNMP community name that the test uses to communicate with the firewall. This parameter is specific to SNMP v1 and v2 only. Therefore, if the SNMPVersion chosen is v3, then this parameter will not appear. |
|
Username |
This parameter appears only when v3 is selected as the SNMPversion. SNMP version 3 (SNMPv3) is an extensible SNMP Framework which supplements the SNMPv2 Framework, by additionally supporting message security, access control, and remote SNMP configuration capabilities. To extract performance statistics from the MIB using the highly secure SNMP v3 protocol, the eG agent has to be configured with the required access privileges – in other words, the eG agent should connect to the MIB using the credentials of a user with access permissions to be MIB. Therefore, specify the name of such a user against this parameter. |
|
Context |
This parameter appears only when v3 is selected as the SNMPVERSION. An SNMP context is a collection of management information accessible by an SNMP entity. An item of management information may exist in more than one context and an SNMP entity potentially has access to many contexts. A context is identified by the SNMPEngineID value of the entity hosting the management information (also called a contextEngineID) and a context name that identifies the specific context (also called a contextName). If the Username provided is associated with a context name, then the eG agent will be able to poll the MIB and collect metrics only if it is configured with the context name as well. In such cases therefore, specify the context name of the Username in the Context text box. By default, this parameter is set to none. |
|
AuthPass |
Specify the password that corresponds to the above-mentioned Username. This parameter once again appears only if the SNMPversion selected is v3. |
|
Confirm Password |
Confirm the AuthPass by retyping it here. |
|
AuthType |
This parameter too appears only if v3 is selected as the SNMPversion. From the AuthType list box, choose the authentication algorithm using which SNMP v3 converts the specified username and password into a 32-bit format to ensure security of SNMP transactions. You can choose between the following options:
|
|
EncryptFlag |
This flag appears only when v3 is selected as the SNMPversion. By default, the eG agent does not encrypt SNMP requests. Accordingly, the this flag is set to No by default. To ensure that SNMP requests sent by the eG agent are encrypted, select the Yes option. |
|
EncryptType |
If the EncryptFlag is set to Yes, then you will have to mention the encryption type by selecting an option from the EncryptType list. SNMP v3 supports the following encryption types:
|
|
EncryptPassword |
Specify the encryption password here. |
|
Confirm Password |
Confirm the encryption password by retyping it here. |
|
Timeout |
Specify the duration (in seconds) within which the SNMP query executed by this test should time out in this text box. The default is 10 seconds. |
|
EngineID |
This parameter appears only when v3 is selected as the SNMPVersion. Sometimes, the test may not report metrics when AES192 or AES256 is chosen as the Encryption type. To ensure that the test report metrics consistently, administrators need to set this flag to Yes. By default, this parameter is set to No. |
|
Data Over TCP |
By default, in an IT environment, all data transmission occurs over UDP. Some environments however, may be specifically configured to offload a fraction of the data traffic – for instance, certain types of data traffic or traffic pertaining to specific components – to other protocols like TCP, so as to prevent UDP overloads. In such environments, you can instruct the eG agent to conduct the SNMP data traffic related to the monitored target over TCP (and not UDP). For this, set this flag to Yes. By default, this flag is set to No. |
|
Detailed Diagnosis |
To make diagnosis more efficient and accurate, the eG Enterprise embeds an optional detailed diagnostic capability. With this capability, the eG agents can be configured to run detailed, more elaborate tests as and when specific problems are detected. To enable the detailed diagnosis capability of this test for a particular server, choose the On option. To disable the capability, click on the Off option. The option to selectively enable/disable the detailed diagnosis capability will be available only if the following conditions are fulfilled:
|
| Measurement | Description | Measurement Unit | Interpretation |
|---|---|---|---|
|
Data transmission |
Indicates the amount of data transmitted by this partition during the last measurement period. |
MB |
The detailed diagnosis of this measure lists the direction of the WAN Link and the rate at which data was transmitted over the partition. Comparing the value of this measure across partitions will help administrators identify the partition that is transmitting maximum amount of data. |
|
Data retransmission |
Indicates the amount of data that was retransmitted by this partition during the last measurement period. |
MB |
If large amount of data takes too long to be successfully retransmitted, you may have to figure out what is causing repeated retransmission failures and fix it before packet loss occurs. |
|
Packets transmission |
Indicates the number of packets that were transmitted by this partition during the last measurement period. |
Number |
Comparing the value of this measure across partitions will help administrators identify the partition that is transmitting maximum number of packets. |
|
TCP data packets transmission |
Indicates the number of data packets that were transmitted over TCP by this partition during the last measurement period. |
Number |
|
|
TCP data packets retransmission |
Indicates the number of data packets that were retransmitted over TCP by this partition during the last measurement period. |
Number |
If TCP packets take too long to be successfully retransmitted, you may have to figure out the real reason behind repeated retransmission failures and fix it before packet loss occurs. |
|
Late dropped packets |
Indicates the number of packets that were dropped by this partition during the last measurement period. |
Number |
Packets are dropped if they are not transmitted from the queue after a wait time of eight seconds or more. Ideally, the value of this measure should be zero. |
|
Late dropped data |
Indicates the amount of data that that was dropped by this partition during the last measurement period. |
Number |
Data can be dropped if the data is not transmitted from the queue after a wait time of eight seconds or more. Ideally, the value of this measure should be zero. |
The detailed diagnosis of the Data transmission measure lists the direction of the WAN Link and the rate at which data was transmitted over the partition.
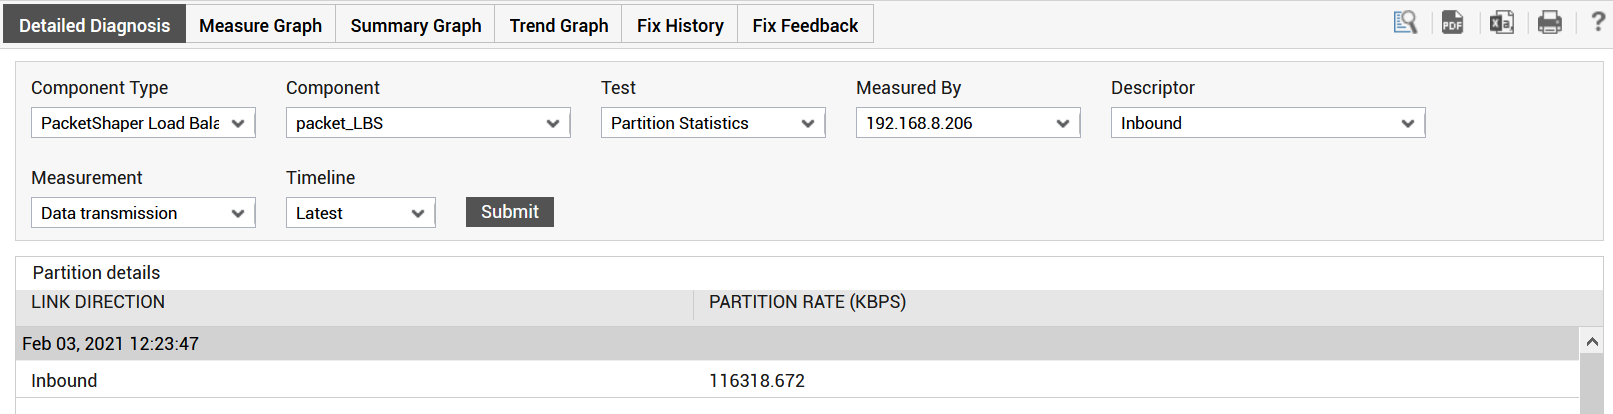
Figure 1 : The detailed diagnosis of the Data transmission measure