
Windows Service Status - OS Test
In some virtual environments, administrators may want to mandate the availability of a set of Windows services on all Windows virtual desktops. In such environments, to ensure uninterrupted access to the mandatory services, administrators need to check the availability of the services on every virtual desktop. To cater to this need, this test allows administrators to configure only the mandatory services of their choice for monitoring. This way, administrators can closely monitor the availability of the services of their interest and instantly know the number of services that are not available/running (if available) on the Windows virtual desktop.
This test does not only reveal the availability of services, that have been configured for monitoring, on each virtual desktop but also reports the count of available services based on their startup types. This helps administrators to know if the automatic services have started and are running on the virtual desktop as configured. If not, administrators can rapidly initiate the remedial measures to start the services quickly before it impacts overall performance of the virtual desktop and the user experience on the virtual desktop. Furthermore, administrators can use the detailed diagnosis provided by this test to know the details of the configured services that are present and inactive on each Windows virtual desktop.
This test is disabled by default. To enable the test, go to the enable / disable tests page using the menu sequence : Agents -> Tests -> Enable/Disable, pick the desired Component type, set Performance as the Test type, choose the test from the disabled tests list, and click on the < button to move the test to the ENABLED TESTS list. Finally, click the Update button.
Target of the test : A RHEV Hypervisor/RHEV Hypervisor - VDI
Agent deploying the test : A remote agent
Output of the test : One set of results will be reported for every Windows virtual desktop on the ESX server.
| Parameter | Description |
|---|---|
|
Test period |
How often should the test be executed. |
|
Host |
The host for which the test is to be configured. |
|
RHEL MGR Host, |
To auto-discover the VMs on a target RHEV hypervisor and obtain the outside view of the performance of each VM, the eG agent needs to connect to the RHEV Manager that manages the target RHEV hypervisor. To enable the eG agent to obtain the outside view, you need to configure the test with the following:
If the RHEV hypervisor being monitored was discovered via an RHEV manager, then the IP address, port number, domain name, and user credentials of the RHEV manager used for discovery will be automatically displayed against the respective parameters. If the RHEV hypervisor being monitored was not discovered via an RHEV manager, but you still want to use an RHEV manager for obtaining the outside view, then, you can select any IP address of your choice from the RHEL MGR host list. By default, this list will be populated with the IP addresses/host names of all the RHEV managers that were configured for the purpose of discovering the RHEV hypervisors. If you select an RHEL MGR host from this list, then the corresponding port number, domain name, and user credentials will be automatically displayed against the respective parameters. On the other hand, if the RHEV manager that you want to use for metrics collection is not available in the RHEL MGR Host list, then, you can configure an RHEV manager on-the-fly by picking the Other option from the RHEL MGR Host list. An ADD THE RHEV MANAGER DETAILS window will then pop up. Refer to Configuring an RHEV Manager to Use for Monitoring the RHEV Hypervisor to know how to add an RHEV manager using this window. Once the RHEV manager is added, its IP address, port number, domain name and user credentials will be displayed against the corresponding parameters. |
|
Confirm Password |
Confirm the RHEL MGR Password by retyping it here. |
|
SSL |
If the RHEV manager to which the eG agent should connect is SSL-enabled, then set this flag to Yes. If not, set it to No. |
|
Ignore VMs Inside View |
Administrators of some high security RHEV environments might not have permissions to internally monitor one/more VMs. The eG agent can be configured to not obtain the 'inside view' of such ‘inaccessible’ VMs using the Ignore VMs Inside View parameter. Against this parameter, you can provide a comma-separated list of VM names, or VM name patterns, for which the inside view need not be obtained. For instance, your ignore VMs inside view specification can be: *xp,*lin*,win*,vista. Here, the * (asterisk) is used to denote leading and trailing spaces (as the case may be). By default, this parameter is set to none indicating that the eG agent obtains the inside view of all VMs on an RHEV host by default. Note: While performing VM discovery, the eG agent will not discover the operating system of the VMs configured in the Ignore VMs Inside View text box. |
|
Exclude VMs |
Administrators of some virtualized environments may not want to monitor some of their less-critical VMs - for instance, VM templates - both from 'outside' and from 'inside'. The eG agent in this case can be configured to completely exclude such VMs from its monitoring purview. To achieve this, provide a comma-separated list of VMs to be excluded from monitoring in the Exclude VMs text box. Instead of VMs, VM name patterns can also be provided here in a comma-separated list. For example, your Exclude VMs specification can be: *xp,*lin*,win*,vista. Here, the * (asterisk) is used to denote leading and trailing spaces (as the case may be). By default, this parameter is set to none indicating that the eG agent obtains the inside and outside views of all VMs on a virtual host by default. By providing a comma-separated list of VMs/VM name patterns in the Exclude VMs text box, you can make sure the eG agent stops collecting 'inside' and 'outside' view metrics for a configured set of VMs. |
|
Ignore WINNT |
By default, the eG agent does not support the inside view for VMs executing on Windows NT operating systems. Accordingly, the Ignore WINNT flag is set to Yes by default. |
|
Inside View Using |
By default, this test obtains the “inside view” of VMs using the eG VM Agent. Accordingly, the Inside view using flag is set to eG VM Agent by default. The eG VM Agent is a piece of software, which should be installed on every VM on a hypervisor. Every time the eG agent runs this test, it uses the eG VM Agent to pull relevant 'inside view' metrics from each VM. Once the metrics are collected, the eG agent then communicates with each VM agent and pulls these metrics, without requiring administrator privileges. Refer to Configuring the Remote Agent to Obtain the Inside View of VMs for more details on the eG VM Agent. |
|
Domain, Admin User, and Admin Password, and Confirm Password |
By default, these parameters are set to none. This is because, by default, the eG agent collects 'inside view' metrics using the eG VM agent on each VM. Domain administrator privileges need not be granted to the eG agent if it uses this default approach to obtain the 'inside view' of Windows VMs. |
|
Report By User |
While monitoring a RHEV Hypervisor, the Report By User flag is set to No by default, indicating that by default, the guest operating systems on the hypervisor are identified using the Hostname specified in the operating system. On the other hand, while monitoring a RHEV Hypervisor - VDI, this flag is set to Yes by default; this implies that in case of the VDI model, by default, the desktops will be identified using the login of the user who is accessing them. In other words, in VDI environments, this test will, by default, report measures for every username_on_virtualmachinename. |
|
Report Powered OS |
This flag becomes relevant only if the Report By User flag is set to ‘Yes’. If the Report Powered OS flag is set to Yes (which is the default setting), then this test will report measures for even those VMs that do not have any users logged in currently. Such guests will be identified by their virtualmachine name and not by the username_on_virtualmachinename. On the other hand, if the Report Powered OS flag is set to No, then this test will not report measures for those VMs to which no users are logged in currently. |
|
Services |
Provide a comma-separated list of services that need to be monitored by this test. When configuring a service name to exclude, make sure that you specify the Display Name of the service, and not the service Name you see in the Services window on your Windows virtual desktop. For example, Citrix Desktop Service,Citrix Encryption Service,Citrix Device Redirector Service,Client License Service (ClipSVC). |
|
DD Frequency |
Refers to the frequency with which detailed diagnosis measures are to be generated for this test. The default is 1:1. This indicates that, by default, detailed measures will be generated every time this test runs, and also every time the test detects a problem. You can modify this frequency, if you so desire. Also, if you intend to disable the detailed diagnosis capability for this test, you can do so by specifying none against DD frequency. |
|
Detailed Diagnosis |
To make diagnosis more efficient and accurate, the eG Enterprise embeds an optional detailed diagnostic capability. With this capability, the eG agents can be configured to run detailed, more elaborate tests as and when specific problems are detected. To enable the detailed diagnosis capability of this test for a particular server, choose the On option. To disable the capability, click on the Off option. The option to selectively enable/disable the detailed diagnosis capability will be available only if the following conditions are fulfilled:
|
| Measurement | Description | Measurement Unit | Interpretation |
|---|---|---|---|
|
Services configured |
Indicates the total number of services that have been configured for monitoring against the Services parameter. |
Number |
|
|
Services present |
Indicates how many services that have been configured for monitoring are actually present on this Windows virtual desktop. |
Number |
|
|
Automatic services present |
Indicates how many services, with startup type as automatic, that have been configured for monitoring are actually present on this virtual desktop. |
Number |
The detailed diagnosis of this measure lists the services (with startup type as automatic) that are currently present on the virtual desktop. |
|
Automatic services not running |
Indicates how many services, with startup type as automatic, that have been configured for monitoring are not running on this Windows virtual desktop. |
Number |
Use the detailed diagnosis of this measure to determine which services (with startup type as automatic) are not currently running on the virtual desktop. |
|
Manual services present |
Indicates how many services, with startup type as manual, that have been configured for monitoring are actually present on this Windows virtual desktop. |
Number |
The detailed diagnosis of this measure lists the services (with startup type as manual) that are currently present on the virtual desktop. |
|
Manual services not running |
Indicates how many services, with startup type as manual, that have been configured for monitoring are not running on this Windows virtual desktop. |
Number |
Use the detailed diagnosis of this measure to determine which services (with startup type as manual) are not currently running on the virtual desktop. |
|
Total services not running |
Indicates the total number of Windows services, that have been configured for monitoring, are not currently running on this Windows virtual desktop. |
Number |
This measure is the sum of Automatic services not running and Manual services not running measures. |
The detailed diagnosis of the Automatic services present measure lists the display name, current status and startup type of the services, and the complete path to the executable that controls the services.
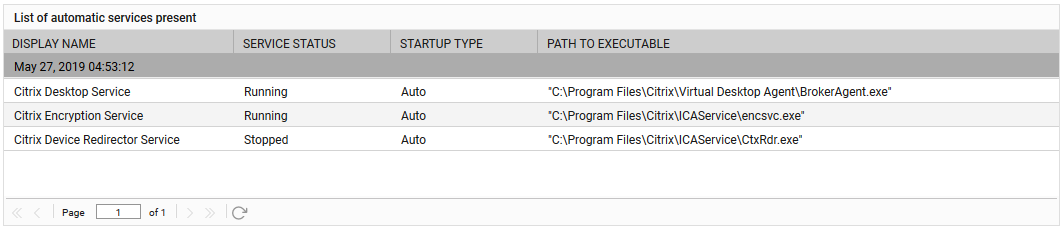
Figure 3 : The detailed diagnosis of the Automatic services present measure
The detailed diagnosis of the Automatic services not running measure lists the display name, current status and startup type of the services, and the complete path to the executable that controls the services.
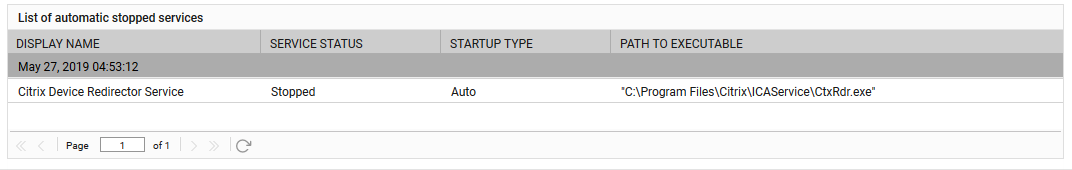
Figure 4 : The detailed diagnosis of the Automatic services not running measure
The detailed diagnosis of the Manual services present measure lists the display name, current status and startup type of the services, and the complete path to the executable that controls the services.
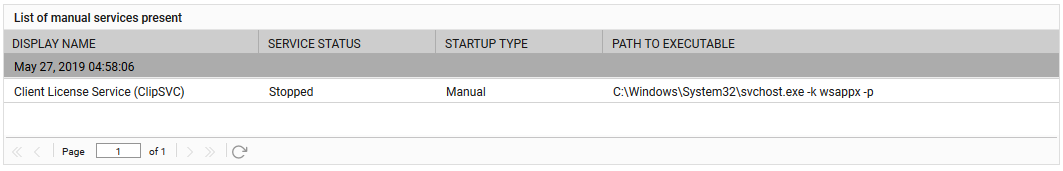
Figure 5 : The detailed diagnosis of the Manual services present measure
The detailed diagnosis of the Manual services not running measure lists the display name, current status and startup type of the services, and the complete path to the executable that controls the services.
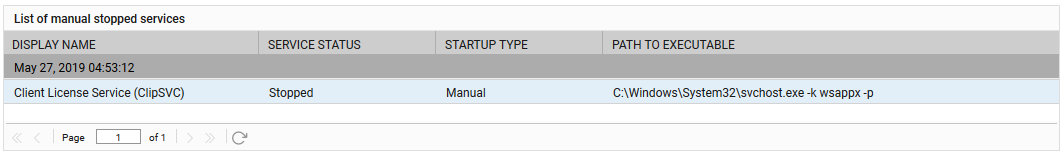
Figure 6 : The detailed diagnosis of the Manual services not running measure
