BW Open Hub Destination Requests Test
An open hub destination is created in order to transfer BW data to a flat file, database table or directly to a third-party tool. The open hub destination is the object that allows you to distribute data from a BI system to SAP/non-SAP data marts, analytical applications, and other applications. It ensures controlled distribution across multiple systems. The open hub destination defines the target that the data is relayed to. Any objects supported by the data transfer process can be used as open hub data sources. Database tables and flat files can serve as open hub destinations. The database table can be located in SAP BW∕4HANA or in another database system that is supported by SAP NetWeaver. The data can be extracted from the database to a downstream system. If the requests to the open hub destination cannot be processed or takes too long to be processed or if the requests are error-prone, then data flow through the open hub destination may either be too slow or may terminate inadvertently. This may affect the data transfer to a larger extent. To ensure smoother data transfer through the open hub destination, it is necessary to keep track on the requests to the open hub destination and the time taken to process the requests. Similarly, error-prone requests when left unnoticed will adversely affect the functioning of the SAP Business Warehouse Instance. Frequent checks for errors will help administrators in maintaining the health of the SAP Business Warehouse Instance. The BW Open Hub Destination Requests test helps administrators in this regard!
This test reports the total requests sent to the open hub destination and the count of lines read by the open hub destination per request. Using this test, administrators can figure out the response time of the open hub destination for each request. Administrators are also pointed to error prone requests so that they can figure out such requests and identify problematic conditions before end users start complaining.
Target of the test : A SAP Business Warehouse Instance
Agent deploying the test : An internal agent
Outputs of the test : One set of results for the target SAP Business Warehouse Instance being monitored.
| Parameter | Description |
|
Test Period |
How often should the test be executed |
|
Host |
Host name of the server for which the test is to be configured. |
|
Port |
Enter the port at which the specified host listens. |
|
ClientName |
Specify the ID of the client system as what the eG agent will be connecting to the SAP ABAP instance. To know how to determine the client ID to use, follow the instructions provided in Determining the Client ID/Name for the eG Agent to Connect to the SAP ABAP Instance. |
|
SAPUser |
Typically, to connect to a SAP ABAP instance and run tests, the eG agent requires the permissions of a SAP user who has been assigned |
|
Password |
The password of the specified SAPUser. |
|
Confirm Password |
Confirm the password by retyping it here. |
|
SysNo |
An indicator of the TCP/IP port at which the SAP server listens. For example, for a server that listens at port 3200, the SysNo will be ‘00’. Similarly, if the SAP server port is 3201, the SysNo will have to be specified as ‘01’. Therefore, in the SysNo text box specify the system number of the SAP server with which the specified client communicates. To know the system number for the ABAP server being monitored, follow the procedure detailed in Identifying the SAP Router String and System Number. |
|
Router |
If the SAP client with the specified ClientName exists in a network external to the SAP server, then a router will be used to enable the server-client communication. In such a case, specify the router string of the router in the Router text box. If both the client and the server exist in the same network, then specify ‘none’ against the Router text box. To know what is the SAP Router string for the ABAP server being monitored, follow the procedure detailed in Identifying the SAP Router String and System Number. |
|
InstanceName |
This is set to default by default. This implies that the eG agent automatically discovers the instance name at run time. |
|
Timeout |
Indicate the duration (in seconds) for which this test should wait for a response from the SAP Business Warehouse Instance. By default, this is set to 120 seconds. |
|
JCO Version |
The eG agent uses the SAP JCO library to connect to the SAP ABAP system and pull out metrics. To enable the eG agent to make this connection and query the metrics, you need to specify the version of the SAP JCO library that the agent needs to use. For instance, to instruct the eG agent to use JCO v2.1.19, it would suffice if you specify the ‘major version number’ alone against JCO Version – in the case of this example, this will be 2.x. Note that if you have downloaded the SAP JCO CONNECTOR files for SAP JCO version 3 from the SAP market place (as instructed by Downloading the SAP JCO Connector files Required for Monitoring ), then the JCO Version configuration should be 3.x. |
|
DD Frequency |
Refers to the frequency with which detailed diagnosis measures are to be generated for this test. The default is 1:1. This indicates that, by default, detailed measures will be generated every time this test runs, and also every time the test detects a problem. You can modify this frequency, if you so desire. Also, if you intend to disable the detailed diagnosis capability for this test, you can do so by specifying none against DD frequency. |
|
Detailed Diagnosis |
To make diagnosis more efficient and accurate, the eG Enterprise embeds an optional detailed diagnostic capability. With this capability, the eG agents can be configured to run detailed, more elaborate tests as and when specific problems are detected. To enable the detailed diagnosis capability of this test for a particular server, choose the On option. To disable the capability, click on the Off option. The option to selectively enable/disable the detailed diagnosis capability will be available only if the following conditions are fulfilled:
|
| Measurement | Description | Measurement Unit | Interpretation |
|---|---|---|---|
|
Requests |
Indicates the total number of requests to the open hub destination during the last measurement period. |
Number |
|
|
Request rate |
Indicates the number of requests sent to the open hub destination per minute. |
Requests/min |
|
|
Error requests |
Indicates the total number of error-prone requests to the open hub destination during the last measurement period. |
Number |
Ideally, the value of this measure should be zero. The detailed diagnosis of this measure lists the INFOSPOKE, INFOSPOKE version, Request state, Response time, Start time, End time, Lines read, Datasource, Destination Type, Destination, Job, Log ID, Request ID and Update Mode of each error-prone request. |
|
Error request rate |
Indicates the number of error-prone requests to the open hub destination per minute. |
Errors/min |
Ideally, the value of this measure should be zero. |
|
Response time |
Indicates the time duration for which a request was processed by the open hub destination. |
Seconds/request |
A sudden/gradual increase in the value of this measure indicates a problematic condition wherein the open hub destination may be encountering issues in servicing requests to transfer data to other sources. The detailed diagnosis of this measure lists the INFOSPOKE, INFOSPOKE version, Request state, Response time, Start time, End time, Lines read, Datasource, Destination type, Destination, Job, Log ID, Request ID and Update mode of the requests that were slow. |
|
Lines read |
Indicates the count of lines read by the open hub destination upon a request during the last measurement period. |
Lines/request |
|
The detailed diagnosis of the Response time measure lists the INFOSPOKE, INFOSPOKE version, Request state, Response time, Start time, End time, Lines read, Datasource, Destination type, Destination, Job, Log ID, Request ID and Update mode of the requests that were slow.
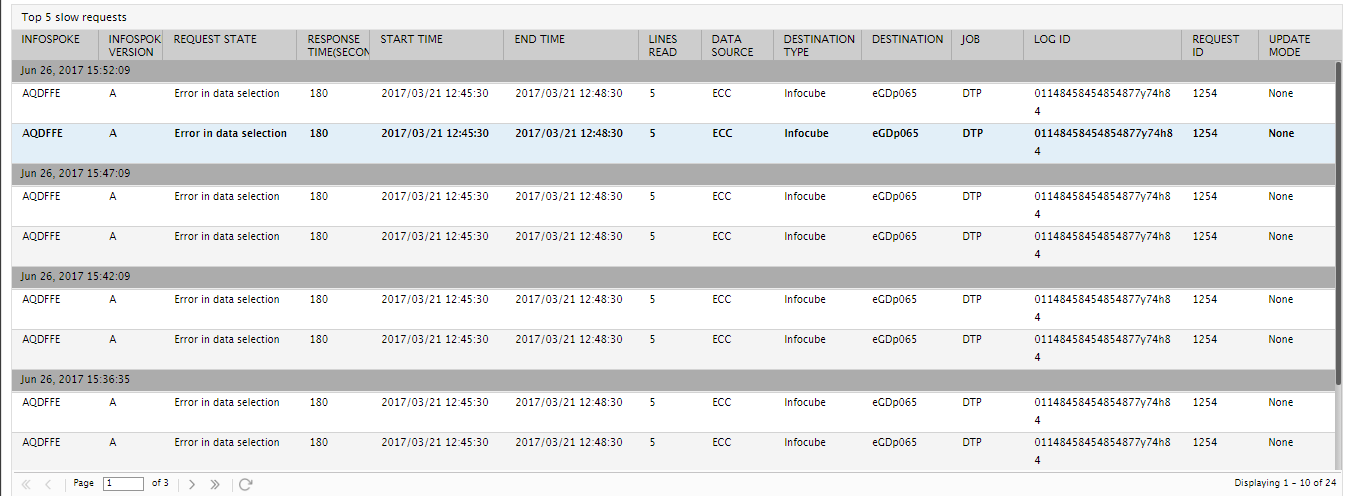
Figure 1 : The detailed diagnosis of the Response Time measure
The detailed diagnosis of the Error requests measure lists the INFOSPOKE, INFOSPOKE version, Request state, Response time, Start time, End time, Lines read, Datasource, Destination Type, Destination, Job, Log ID, Request ID and Update Mode of each error-prone request.
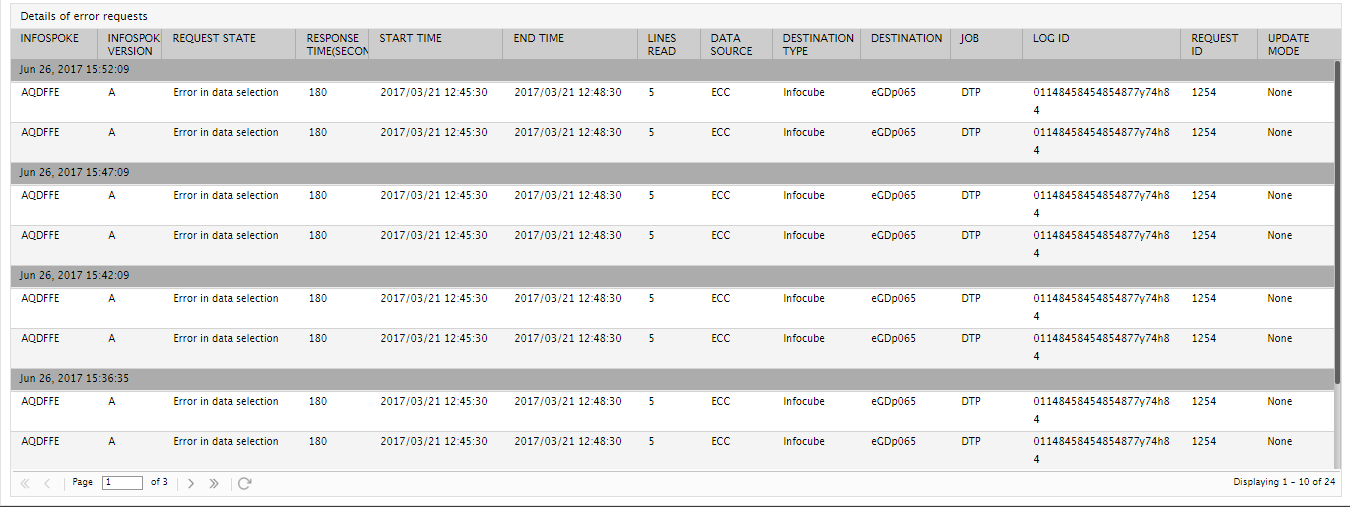
Figure 2 : The detailed diagnosis of the Error Requests measure