BW Process Chains Test
A process chain is a sequence of processes that wait in the background for an event. Some of these processes trigger a separate event that can start other processes in turn. A process chain provides the following benefits to you in a SAP BI system −
-
They can be used to centrally manage and control the processes.
-
You can visualize the processes by using graphics.
-
Using event controlled processing, you can automate the complex schedules.
If a scheduled process chain is not running or fails execution, then data transfer from the SAP Business Warehouse Instance may be delayed or may not happen at all. To ensure smooth data transfer, it is essential for all the process chains to complete execution without errors within a stipulated time period. In order to figure out the current status of each process chain execution and the processes of the process chains that are frequently encountering errors, administrators can use the BW Process Chains test.
This test auto-discovers the process chains executing on the target SAP Business Warehouse Instance and for each process chain, this test reports the number of times the process chain was executed. This test also reports the current status of each process chain execution. Additionally, the test also throws light on the process chains that were executed with errors. The detailed diagnostics of this test lists the exact process of the process chain that encountered errors during execution.
Target of the test : A SAP Business Warehouse Instance
Agent deploying the test : An internal agent
Outputs of the test : One set of results for the target SAP Business Warehouse Instance being monitored.
| Parameter | Description |
|
Test Period |
How often should the test be executed |
|
Host |
Host name of the server for which the test is to be configured. |
|
Port |
Enter the port at which the specified host listens. |
|
ClientName |
Specify the ID of the client system as what the eG agent will be connecting to the SAP ABAP instance. To know how to determine the client ID to use, follow the instructions provided in Determining the Client ID/Name for the eG Agent to Connect to the SAP ABAP Instance. |
|
SAPUser |
Typically, to connect to a SAP ABAP instance and run tests, the eG agent requires the permissions of a SAP user who has been assigned |
|
Password |
The password of the specified SAPUser. |
|
Confirm Password |
Confirm the password by retyping it here. |
|
SysNo |
An indicator of the TCP/IP port at which the SAP server listens. For example, for a server that listens at port 3200, the SysNo will be ‘00’. Similarly, if the SAP server port is 3201, the SysNo will have to be specified as ‘01’. Therefore, in the SysNo text box specify the system number of the SAP server with which the specified client communicates. To know the system number for the ABAP server being monitored, follow the procedure detailed in Identifying the SAP Router String and System Number. |
|
Router |
If the SAP client with the specified ClientName exists in a network external to the SAP server, then a router will be used to enable the server-client communication. In such a case, specify the router string of the router in the Router text box. If both the client and the server exist in the same network, then specify ‘none’ against the Router text box. To know what is the SAP Router string for the ABAP server being monitored, follow the procedure detailed in Identifying the SAP Router String and System Number. |
|
InstanceName |
This is set to default by default. This implies that the eG agent automatically discovers the instance name at run time. |
|
Timeout |
Indicate the duration (in seconds) for which this test should wait for a response from the SAP Business Warehouse Instance. By default, this is set to 120 seconds. |
|
JCO Version |
The eG agent uses the SAP JCO library to connect to the SAP ABAP system and pull out metrics. To enable the eG agent to make this connection and query the metrics, you need to specify the version of the SAP JCO library that the agent needs to use. For instance, to instruct the eG agent to use JCO v2.1.19, it would suffice if you specify the ‘major version number’ alone against JCO Version – in the case of this example, this will be 2.x. Note that if you have downloaded the SAP JCO CONNECTOR files for SAP JCO version 3 from the SAP market place (as instructed by Downloading the SAP JCO Connector files Required for Monitoring ), then the JCO Version configuration should be 3.x. |
|
DD Frequency |
Refers to the frequency with which detailed diagnosis measures are to be generated for this test. The default is 1:1. This indicates that, by default, detailed measures will be generated every time this test runs, and also every time the test detects a problem. You can modify this frequency, if you so desire. Also, if you intend to disable the detailed diagnosis capability for this test, you can do so by specifying none against DD frequency. |
|
Detailed Diagnosis |
To make diagnosis more efficient and accurate, the eG Enterprise embeds an optional detailed diagnostic capability. With this capability, the eG agents can be configured to run detailed, more elaborate tests as and when specific problems are detected. To enable the detailed diagnosis capability of this test for a particular server, choose the On option. To disable the capability, click on the Off option. The option to selectively enable/disable the detailed diagnosis capability will be available only if the following conditions are fulfilled:
|
| Measurement | Description | Measurement Unit | Interpretation | ||||||||||||||||||||||||
|---|---|---|---|---|---|---|---|---|---|---|---|---|---|---|---|---|---|---|---|---|---|---|---|---|---|---|---|
|
Executions |
Indicates the number of times this process chain was executed during the last measurement period. |
Number |
This measure is a good indicator of load on the SAP Business Warehouse Instance. Compare the value of this measure across process chains to figure out the process chain that is executed more frequently. |
||||||||||||||||||||||||
|
Current completed process |
Indicates the number of times this process chain execution was complete per minute during the last measurement period. |
Requests/min |
|
||||||||||||||||||||||||
|
Total completed processes |
Indicates the total number of times this process chain had completed execution. |
Number |
The detailed diagnosis of this measure lists the Log ID, Process name, Process status, Duration, Start time, End time, Batch time, Job ID and Error log of all the processes of each process chain that had completed execution. |
||||||||||||||||||||||||
|
Current error processes |
Indicates the number of times this process chain encountered errors while being executed during the last measurement period. |
Number |
Ideally, the value of this measure should be zero. |
||||||||||||||||||||||||
|
Total error processes |
Indicates the total number of times this process chain encountered errors during execution. |
Number |
The detailed diagnosis of this measure lists the Log ID, Process name, Process status, Duration, Start time, End time, Batch time, Job ID and Error log of all the processes of each process chain that had completed execution. Using the detailed diagnosis of this measureadministrators can figure out the exact process of the process chain that was more frequently prone to errors. |
||||||||||||||||||||||||
|
Current elapsed time |
Indicates the time taken by this process chain to complete an execution. |
Seconds/execution |
Compare the value of this measure across process chains to figure out the process chain that is taking too long to complete an execution. |
||||||||||||||||||||||||
|
Current execution status |
Indicates that current status of this process chain execution. |
|
The values reported by this measure and its numeric equivalents are mentioned in the table below:
Note: By default, this measure reports the Measure Values listed in the table above to indicate the current status of this process chain execution. The graph of this measure however, is represented using the numeric equivalents only i.e., 0 to 11. The detailed diagnosis of this measure lists the Log ID, Process name, Process status, Duration, Start time, End time, Batch time, Job ID and Error log of all the processes of each process chain that had completed execution. Using this, administrators can figure out the exact process that was error-prone. |
||||||||||||||||||||||||
|
Current records |
Indicates the number of records transmitted per execution of this process chain during the last measurement period. |
Records/execution |
Compare the value of this measure across process chains to figure out the process chain that is transmitting maximum number of records per execution. |
||||||||||||||||||||||||
|
Total records |
Indicates the total number of records transmitted per execution of this process chain. |
Records/execution |
|
||||||||||||||||||||||||
|
Current data packages |
Indicates the amount of data (in a data package) transmitted per execution of this process chain during the last measurement period. |
MB/execution |
Compare the value of this measure across process chains to figure out the process chain that is transmitting maximum amount of data in data packages per execution. |
||||||||||||||||||||||||
|
Total data packages |
Indicates the total amount of data transmitted per execution of this process chain. |
MB/execution |
|
The detailed diagnosis of the Total error processes measure lists the Log ID, Process name, Process status, Duration, Start time, End time, Batch time, Job ID and Error log of all the processes of each process chain that had completed execution.
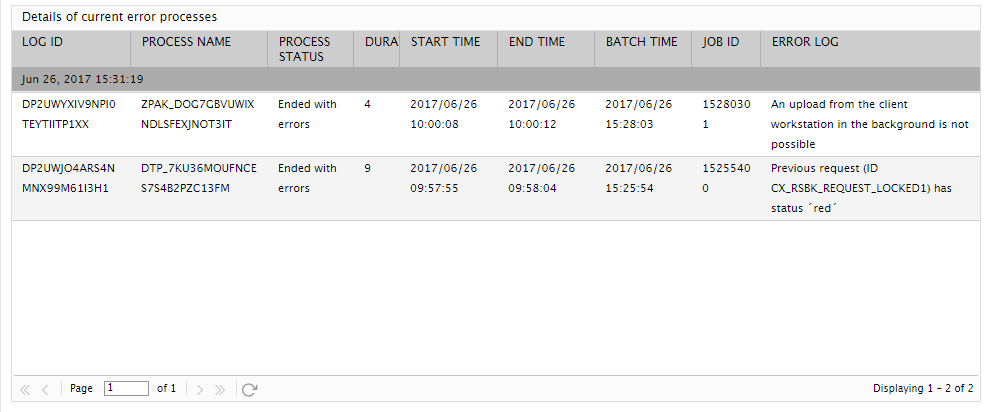
Figure 1 : The detailed diagnosis of the Total error processes measure
The detailed diagnosis of the Total completed processes measure lists the Log ID, Process name, Process status, Duration, Start time, End time, Batch time, Job ID and Error log of all the processes of each process chain that had completed execution.
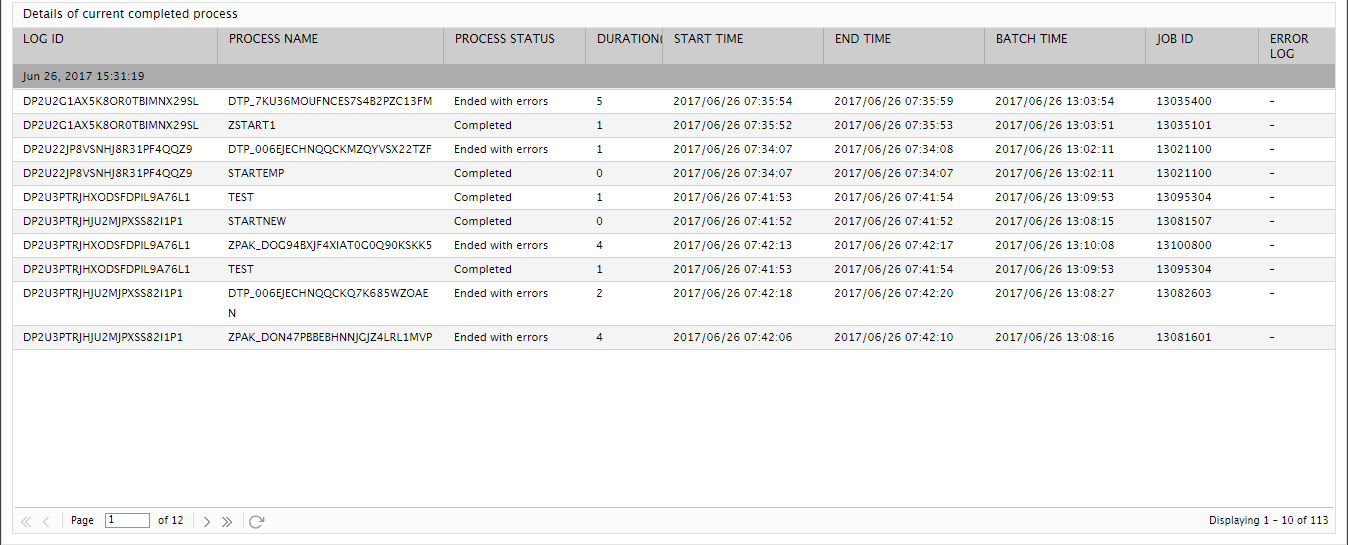
Figure 2 : The detailed diagnosis of the Total completed processes measure
The detailed diagnosis of the Current execution status measure lists the Log ID, Process name, Process status, Duration, Start time, End time, Batch time, Job ID and Error log of all the processes of each process chain that had completed execution. Using this, administrators can figure out the exact process of the process chain that was error-prone.

Figure 3 : The detailed diagnosis of the Current execution status measure