Viewing the Active Alerts
Let us begin by clicking the Active Alerts node under eG Enterprise.
-
When the Active Alerts node is clicked, the contents of the right panel will change to display all the currently open alarms for the eG-managed components, grouped by the alarm severity/priority. Each alert displayed in the right panel will indicate the following by default:
-
Severity: This refers to the alarm priority. The severity that corresponds to each of the alarm priorities supported by eG Enterprise are as follows:
eG Alert Priority SCOM Alert Severity Critical
Critical
Major
Warning
Minor
Warning
Note:
Though the SCOM console categorizes both the Major and Minor eGalerts as Warnings, you can differentiate between the two by instantly launching the eG monitoring console from the SCOM console. To do so, just click on the Diagnose using eG option indicated by Figure 3.1.
- Path: The Path specification indicates the problem component, the problem component type, and the problem layer, and is expressed in the following format: <ComponentName>\<ComponentType>\<Layer>
- Source: This indicates the problem test and problem descriptor (in case of a descriptor-based test).
- Name: For all alerts related to eG-managed components, this will be <Component_Type>:<Test_Name>|<Measure_Name>.
- Resolution State: This typically indicates whether the problem is currently active or has been closed. For all Active Alerts however, the Resolution State will be New.
- Created: This indicates when the problem was detected by the eG manager.
- Age: This indicates how long the problem has remained unresolved.
-
-
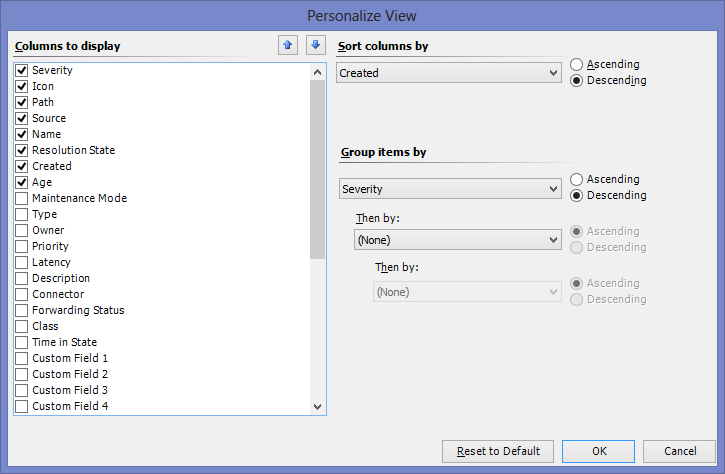
You can, if you so need, customize your default Active Alerts view to include more columns or exclude one/more default columns. To achieve this, click on the Personalize view option in the Actions pane to the far right of Figure 1. Figure 1 will then appear. Select one/more check boxes from the Columns to display section to add more information to the Active Alerts view, or deselect one/more check boxes to remove the alarm details that pre-exist. Click the ok button in Figure 1 to save your customizations.
-
Once back in the Active Alerts view, you can click on a specific critical alert/warning to view the alert details more clearly in the Alert Details section indicated by Figure 1. Scrolling down the contents of the Alert Details section will reveal a View additional knowledge link (see Figure 2).
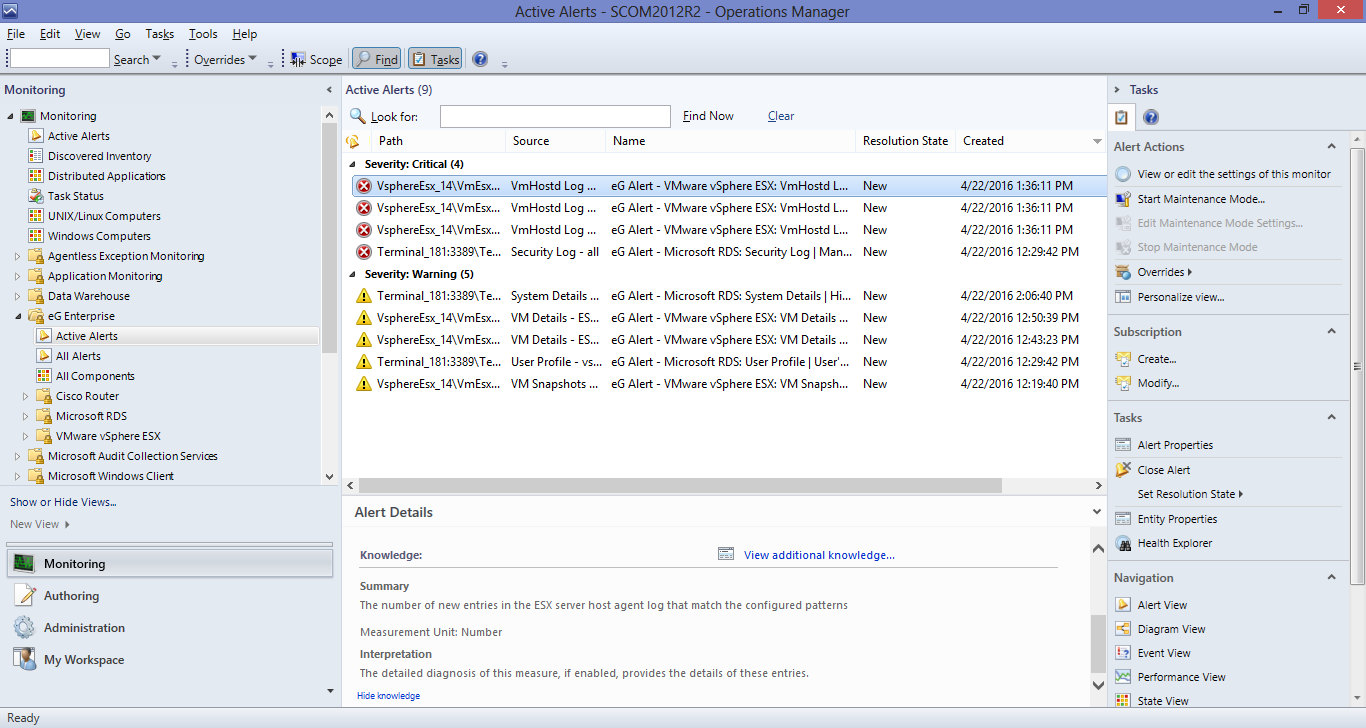
Figure 2 : Scrolling down the Alert Details section to View additional knowledge
-
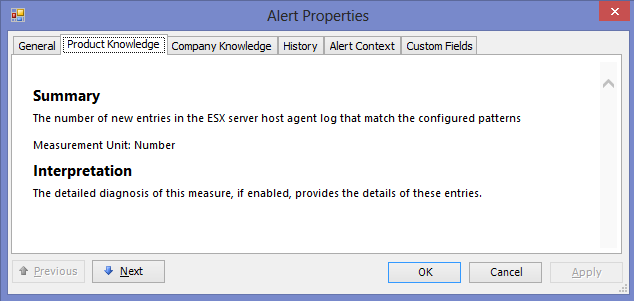
To understand a problem better, click on the View additional knowledge link and tap the knowledge base of the eG Enterprise system. The Product Knowledge tab page of the Alert Properties window will automatically open displaying the details related to the measure on which the selected alert was raised. Figure 3 depicts a sample Alert Properties window displaying the details of the Number of system errors measure.
-
To investigate the problem at hand further, you can even instantly launch the eG monitoring console from the Active Alerts view. For this, just select an alert from the view and click on the Diagnose using eG link in the Actions pane of Figure 4.
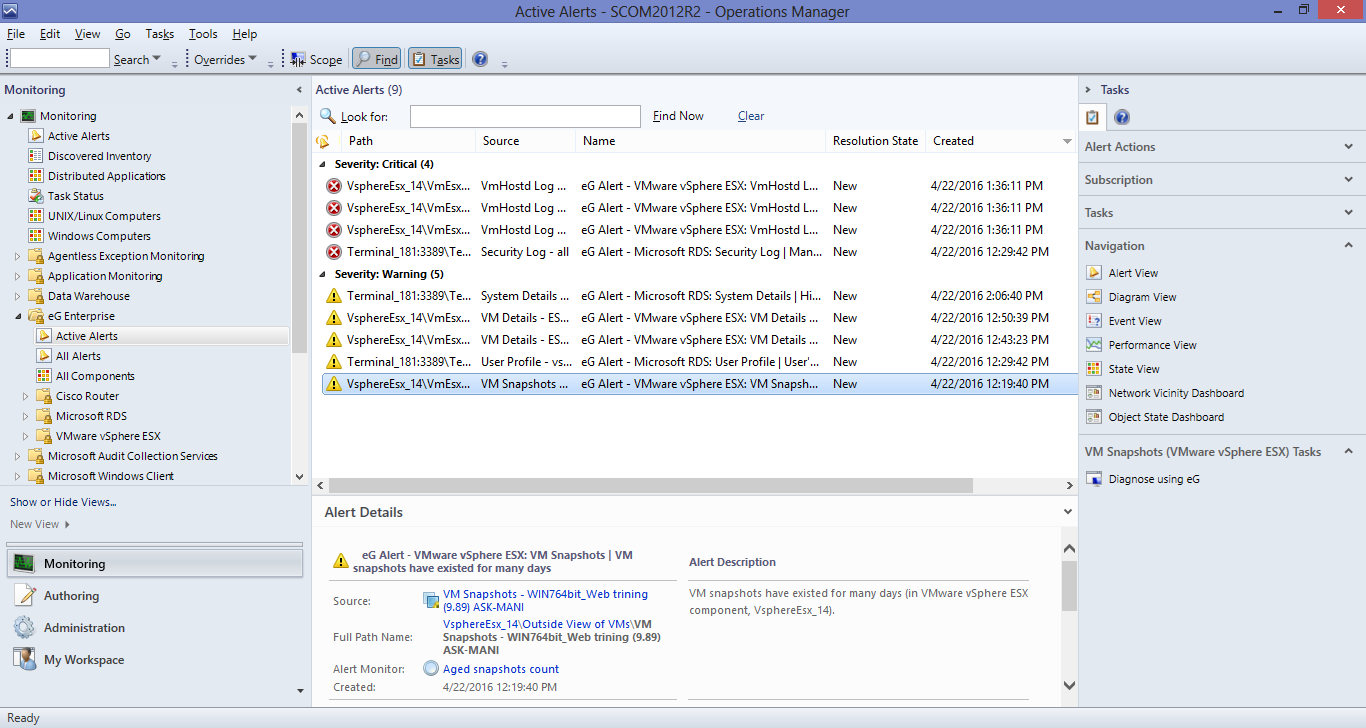
Figure 4 : Launching the eG monitoring console from the SCOM console
-
Doing so will lead you to that page in the eG monitoring console that indicates the problem layer, test, and measurement that corresponds to the alert chosen from the SCOM console.
Note:
Clicking on the Diagnose using eG option will launch the eG monitoring console only if the eG Console Tasks application is installed on the system on which the SCOM console is operating. To know how to install this application, refer to Installing the eG Console Tasks Application. Also, when the eG console is launched for the very first time from the SCOM console, a login screen will appear, where you will have to manually key in the user credentials for logging into the eG monitoring console. The same credentials will be used to launch the eG monitoring console during your subsequent attempts to Diagnose using eG.
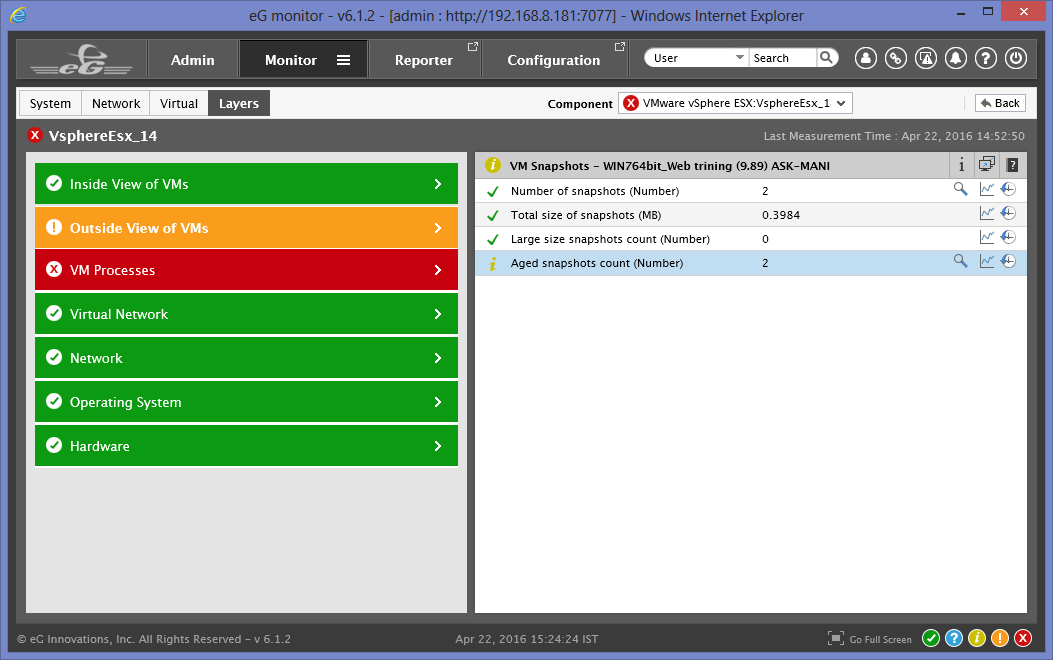
Figure 5 : The eG monitoring console indicating the problem layer, test, and measurement related to the alert chosen from the SCOM console