Using the eG Universal Management Pack (MP) for SCOM
Once the eG Universal MP is successfully deployed, you will find eG-managed components appear as monitoring objects in the SCOM console. Using the SCOM console, you can then:
- View the current state of the eG-managed components;
- Be alerted to problems experienced by eG-managed components;
- Isolate problem layers, tests, and measurements;
- Analyze state transitions experienced by eG-managed components;
- Monitor business service performance using SCOM and identify the root-cause of service slowdowns/outages
- Launch the eG monitoring console from the SCOM console to perform further diagnosis of problems;
- Enable/disable specific monitors using the SCOM console
This chapter takes the help of an example to explain how the eG-SCOM integration works.
This example takes the case of a target environment comprising of an eG manager that is monitoring a VMware vSphere/ESX server, a Cisco router, and a Microsoft Terminal server. Soon after the eG manager is integrated with the SCOM server, login to the SCOM console. Figure 1 will then appear. Post the integration, the tree-structure in the left pane of Figure 1 will display a new eG Enterprise node.
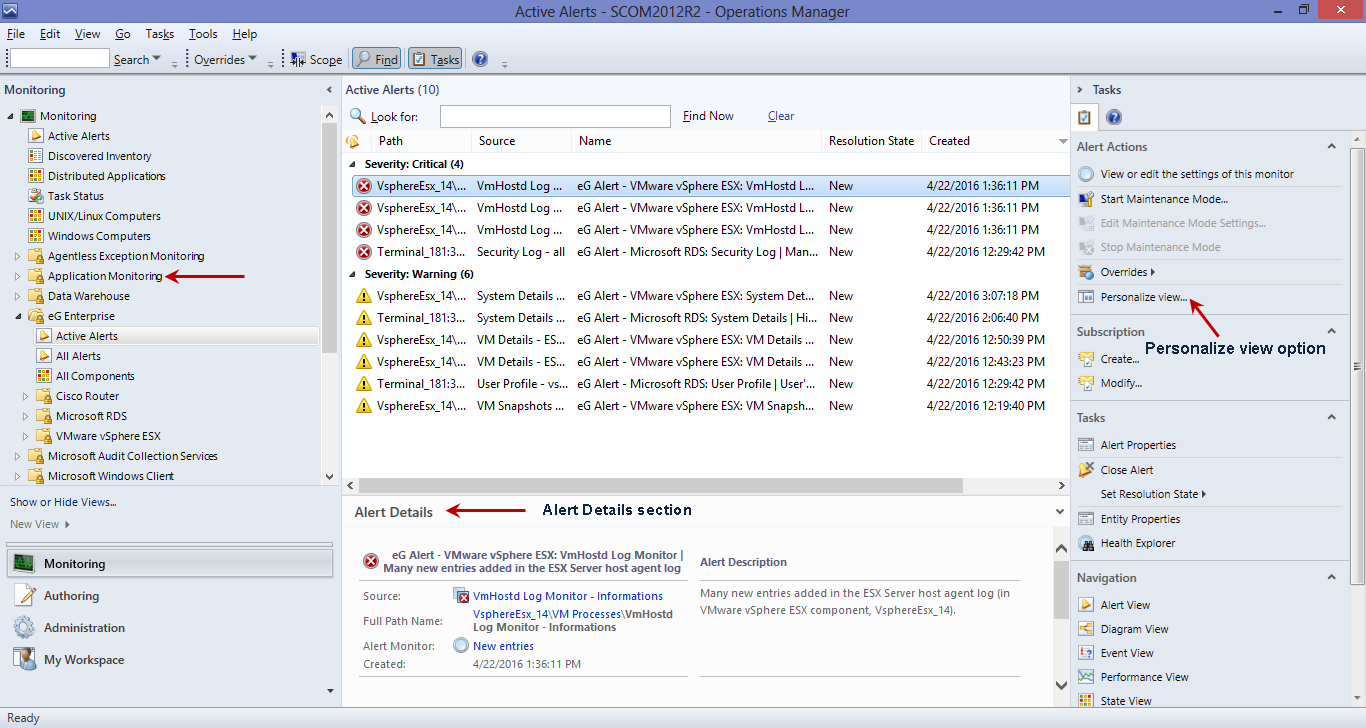
Figure 1 : The tree-structure displaying a new 'eG Enterprise' node
If you expand the eG Enterprise node, you will find a series of sub-nodes. Clicking on each sub-node will enable you to do the following:
- View the currently active alerts pertaining to eG-managed components;
- View all the alerts that were generated by the eG manager during the last 3 days;
- View the components managed by eG Enterprise and their current state;
- Focus on the overall performance and problems related to each eG-managed component;
The
- Viewing the Active Alerts
- Viewing All Alerts
- Closing Alerts in the SCOM Console
- Viewing Component Health
- Viewing Infrastructure Health
- Viewing Component Type Health
- Working with the Health Explorer
- Monitoring Business Services
- Publishing Dashboards
- Alert Filter
- Performance Tuning of the eG SCOM Connector
- Updating SCOM with Measure-level Changes Made After Deploying the eG Universal MP