Working with the Health Explorer
The health explorer provides options to troubleshoot the problems detected by health monitors. It depicts how the various health monitors inter-operate to determe the state of a monitoring object. Every measurement reported by an eG test is mapped to a corresponding health monitor in SCOM. The monitors of a test are grouped together under the Performance category. A rollup monitor exists for every test which automatically propagates the state of a test object into its parent layer object. Similarly, a rollup monitor exists for every layer object which automatically propagates the state of a layer object into its parent component object. This entire state hierarchy is called as Heath Model in SCOM.
To access the health explorer screen, do the following:
-
In the SCOM operation console, select the monitored target (component/layer/test/measure) from one of the eG views and then select the Health Explorer option in the Actions pane. In the case of our example, let us launch the Health Explorer for the Warning raised on the VM Snapshots test mapped to the OutsideView of VMs layer of a VMware vSphere ESX server.
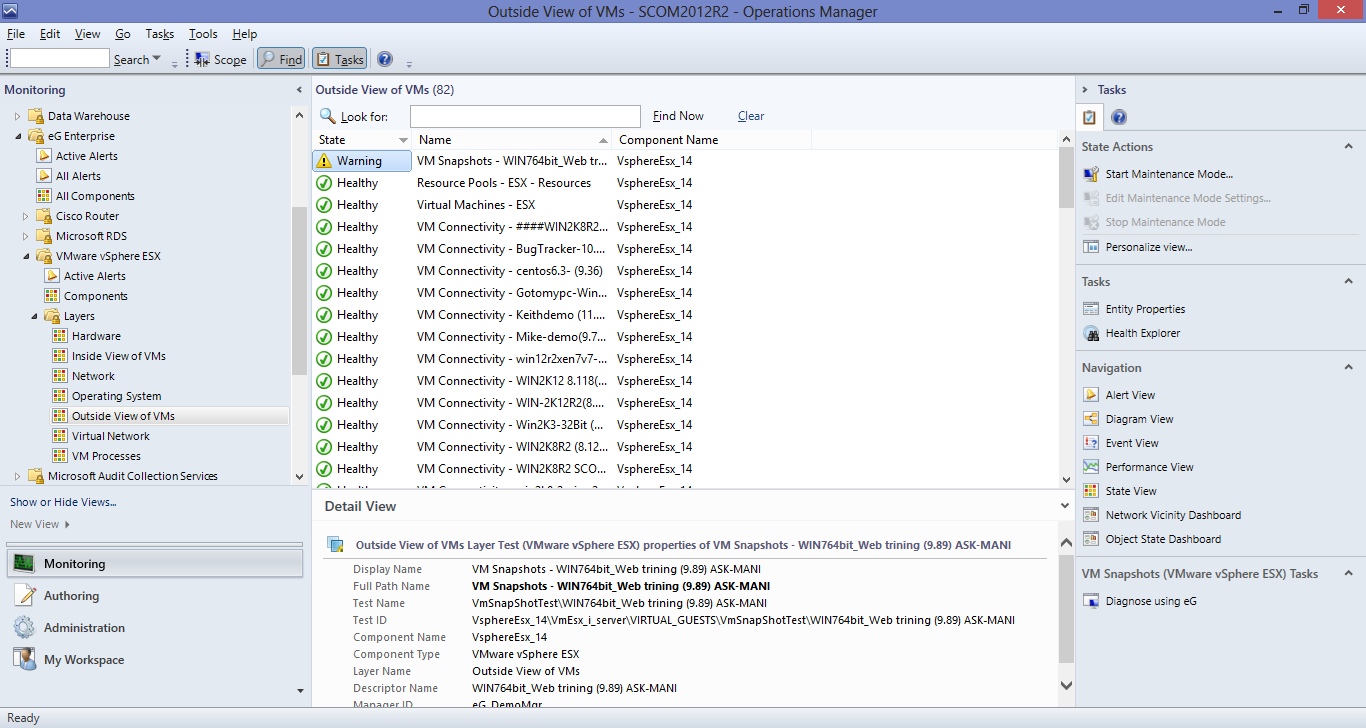
Figure 1 : Clicking on the Health Explorer option of a test mapped to a particular layer
-
Figure 2 will then appear. As you can see, in the left panel of Figure 2, all the measures of the VM Snapshots test (that we had earllier selected from the SCOM console of Figure 1) are grouped under the Performance node (i.e., category) as monitors. From the left panel, we can clearly infer that the Warning on the VM Snapshots test is owing to a Warning alert on the Aged snapshots count measure of the test.
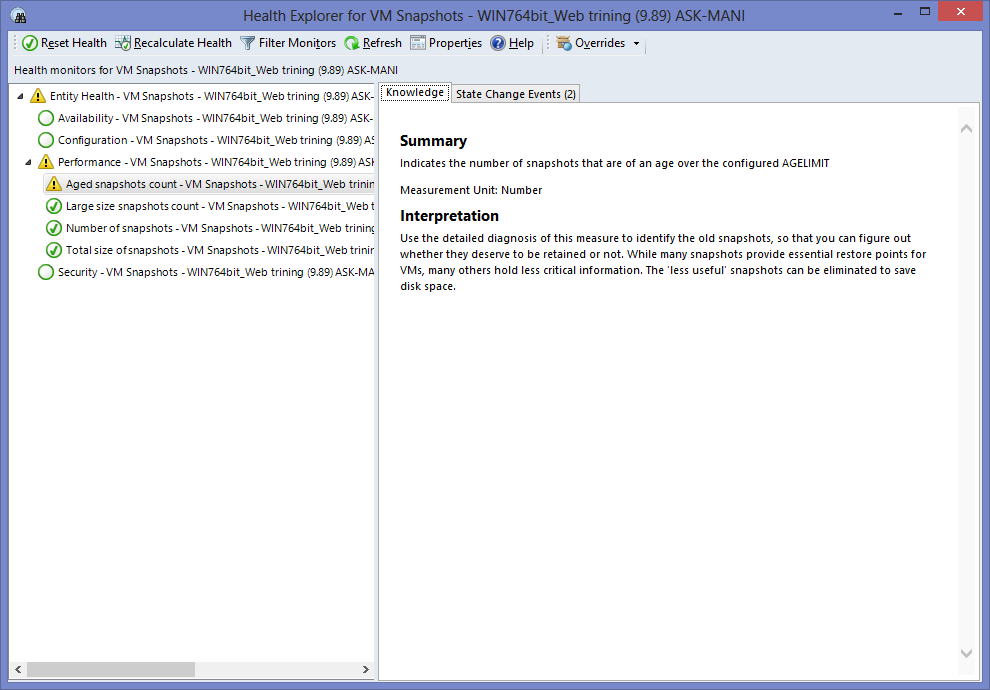
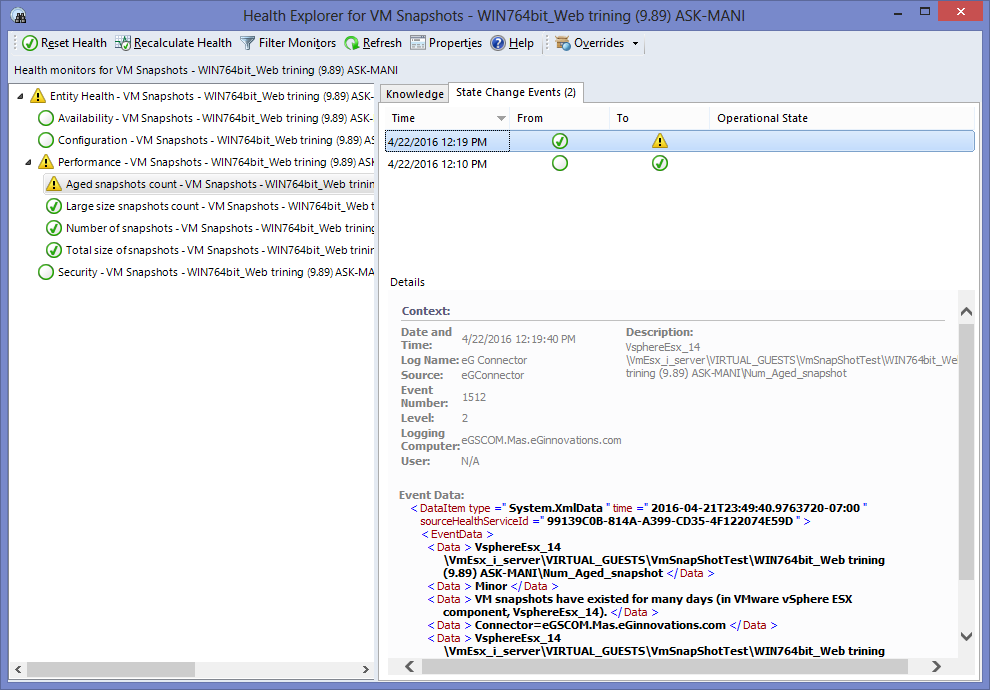
Figure 2 : Health explorer for the VM Snapshots test mapped to the OutsideView of VMs layer of a VMware vSphere ESX server
-
The right panel comes with two tabs. In the Knowledge tab, you can easily and instantly view the details of the chosen measure as described in the context-sensitive help page that corresponds to the chosen test. In the State Change Events tab on the other hand, you can view the transitions in the state of a test/measure chosen from the left panel. For instance, in Figure 3 below, you can view the state transitions for the Aged snapshot counts measure chosen from the left panel. This way, you can easily view the state history of a test/measure and effortlessly figure out what state a test/measure has been in at what time.