How does eG Enterprise Monitor Sun Java System Application Server?
eG Enterprise is capable of monitoring the Sun Java System application server in both agent-based and agentless manners. Before attempting to monitor the server, first configure the server to work with the eG Enterprise. The procedure for achieving this is discussed in the below section.
Configuring the Sun Java System Application Server to work with eG
In order to ensure that the Sun Java System application server works smoothly with the eG product, the monitoring capability of a few key services has cputo be enabled. To achieve this, do the following:
- Open the Internet Explorer and type the following URL in its address bar: http://<WebSphereIP>:<WebSpherePort> of the Sun Java System server>:<Sun Java System server’s admin port>/, to open the Sun Java System application server’s admin console.
-
Upon typing the URL, a dialog box requesting the User Name and Password of the administrator will appear (see Figure 1). Specify the same in the respective text boxes and click the OK button.
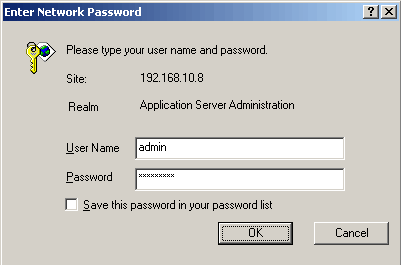
Figure 1 : Specifying the user name and password to log into the Sun Java System server’s admin console
-
Upon successful login, the Sun Java System application server’s admin console will open (see Figure 2).
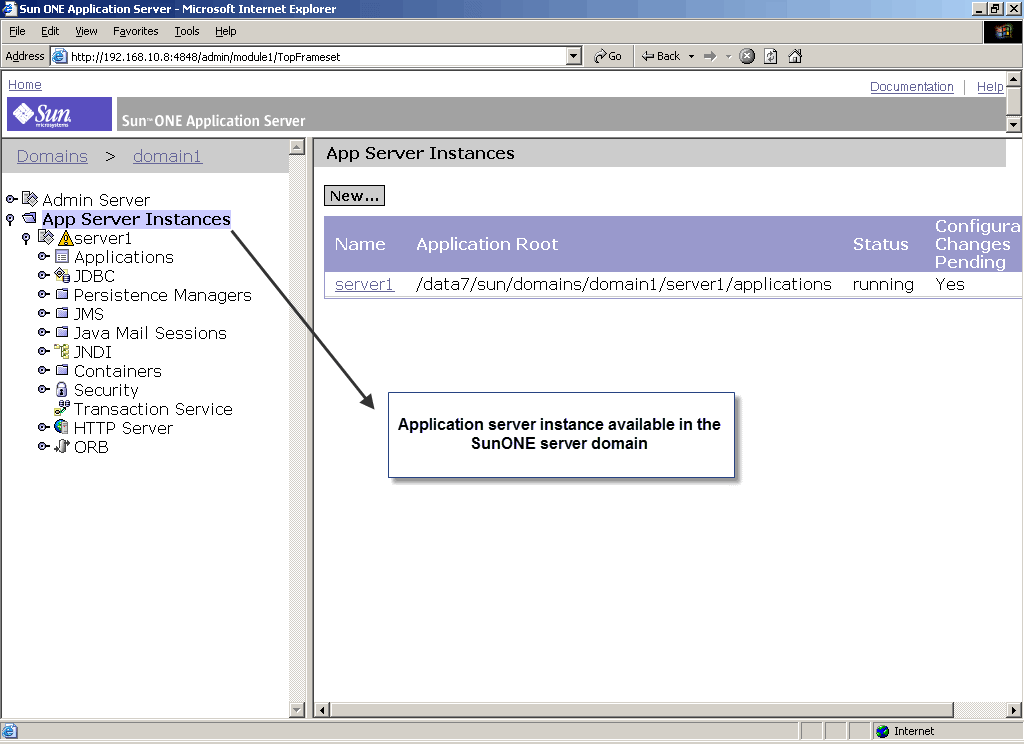
Figure 2 : The Sun Java System application server’s admin console
- The App Server Instances node in the left pane comprises of sub-nodes representing the application server instances present in the Sun Java System server domain . To monitor a particular application server instance, first, expand the sub-node corresponding to the same as indicated by Figure 2. This will display the services executing on the expanded application server instance.
-
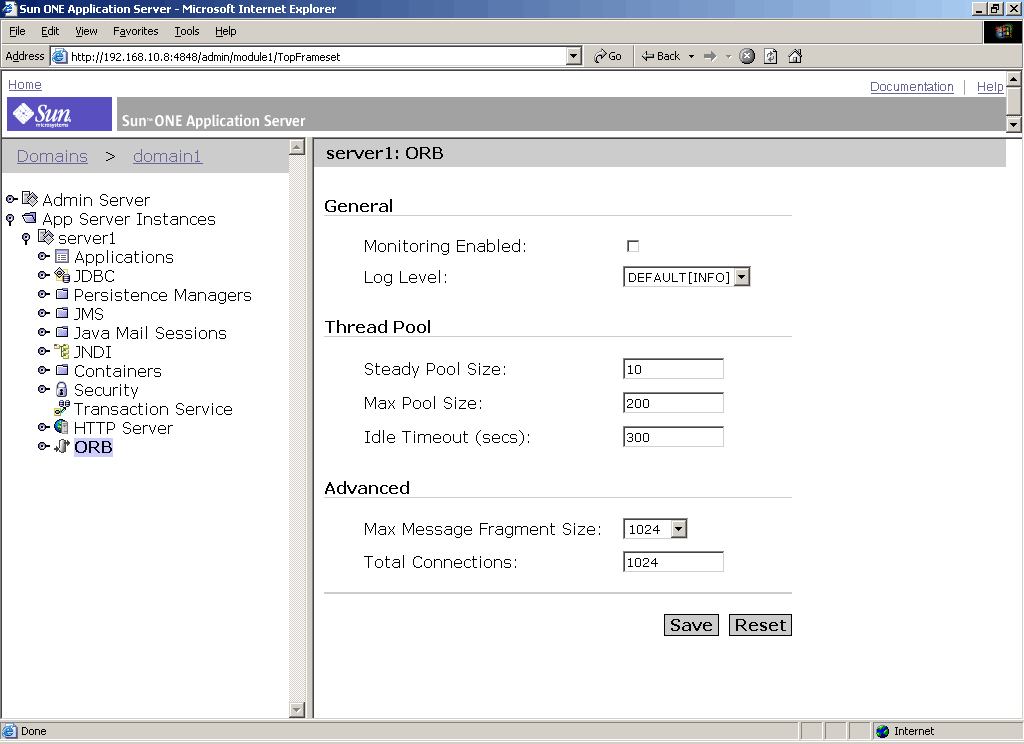
Now, select the ORB service as indicated by Figure 3.
-
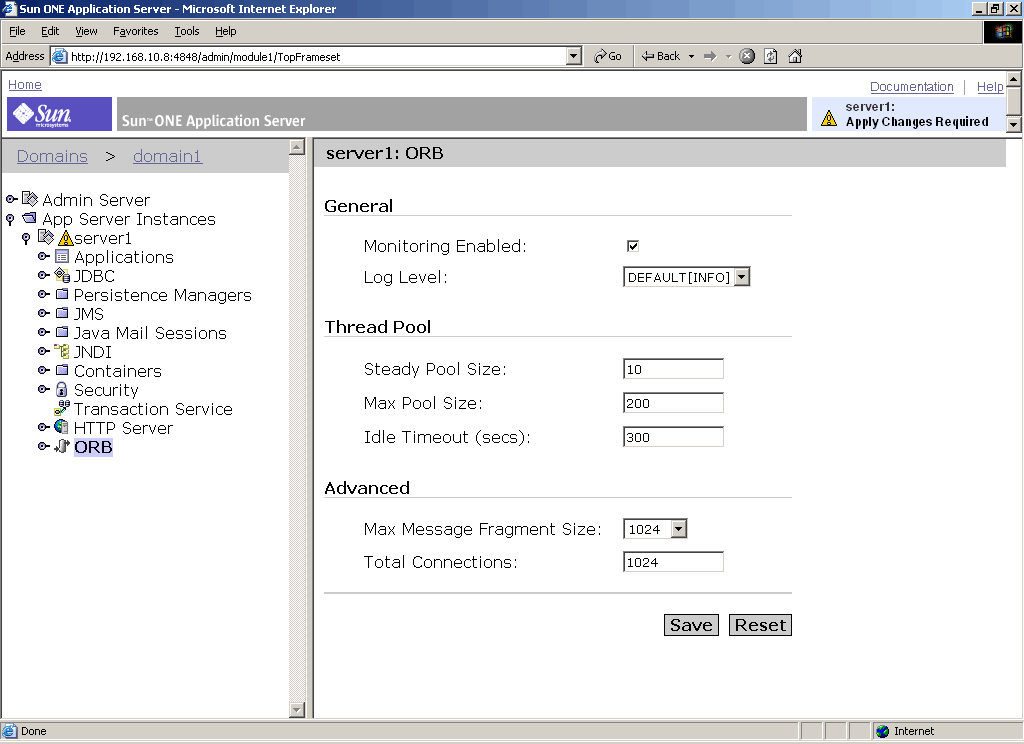
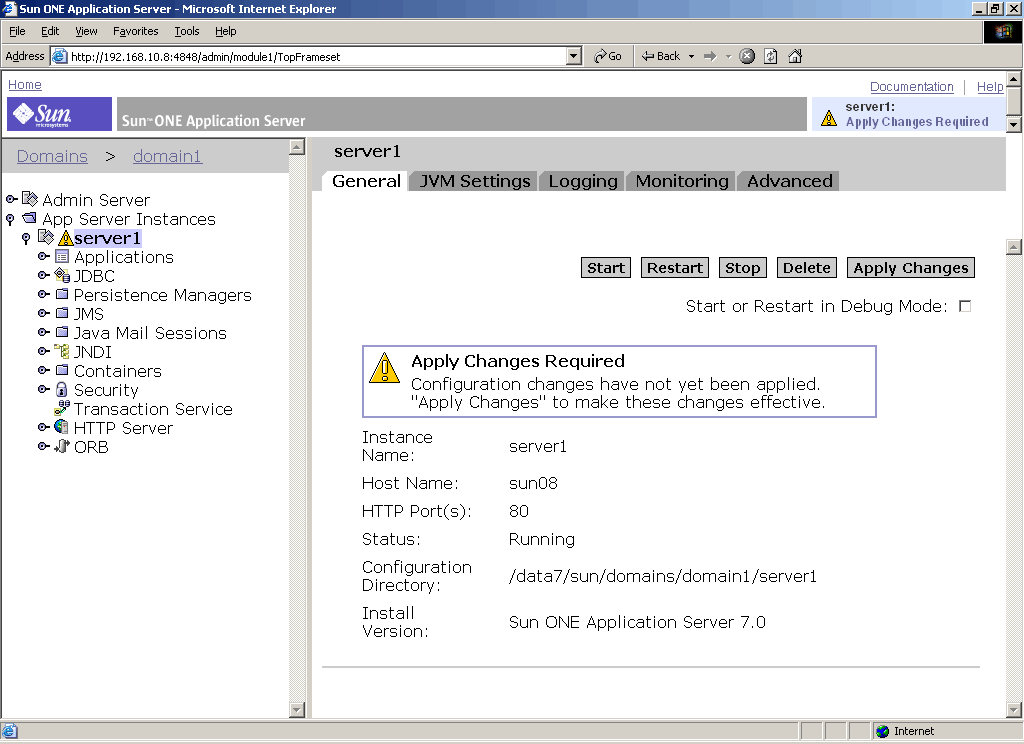
Figure 3 reveals that by default the Monitoring Enabled check box displayed in the right pane is deselected for the ORB service. This capability has to be enabled for the eG agents to effectively monitor the ORB service. To enable this capability, click on the check box and click the Save button below. Upon clicking, a link named Apply Changes Required (see Figure 4) will appear in the top right corner of the window. To apply the changes made, first, click on this link.
-
Once the link is clicked, a page depicted by Figure 5 will appear. Click on the Apply Changes button in this page to register the changes made.
-
When this is done, the following confirmation message will appear (see Figure 6).
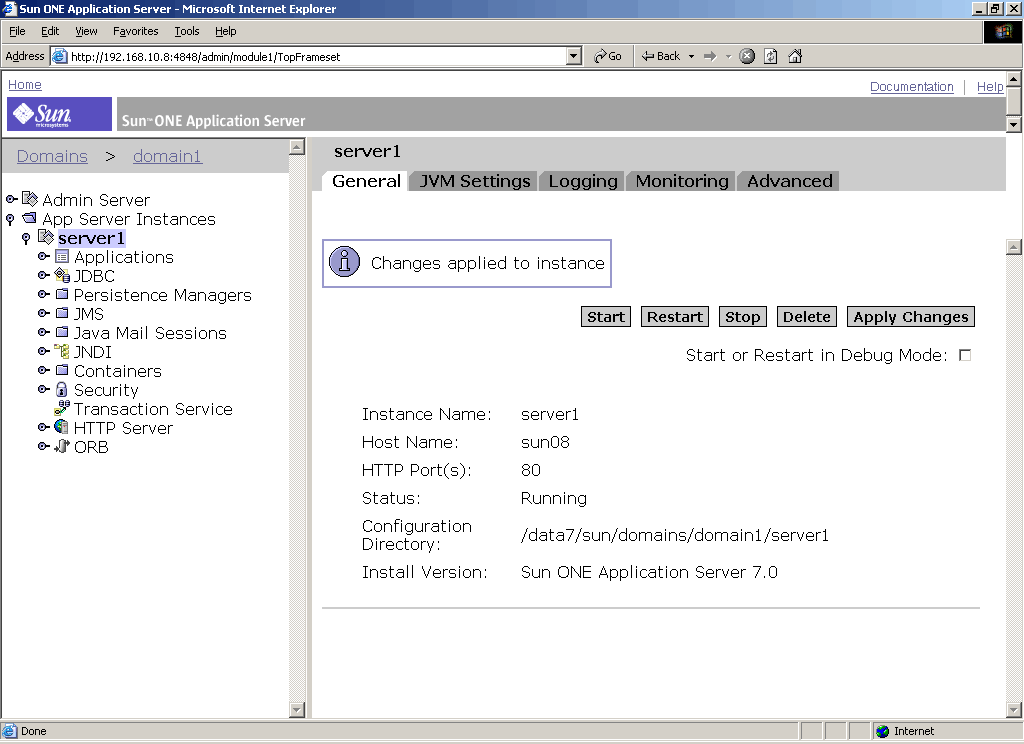
Figure 6 : A message confirming that changes have been applied to the instance
- In some cases, a message prompting the user to restart the server will appear in this page. If such a message appears, click on the Restart button in this page to restart the server instance.
-
Repeat the procedure discussed above for the Transaction Service and the EJB Container, which can be seen in the left pane (see Figure 7). To view the EJB Container sub-node, expand the Containers node in the left pane (see Figure 7).
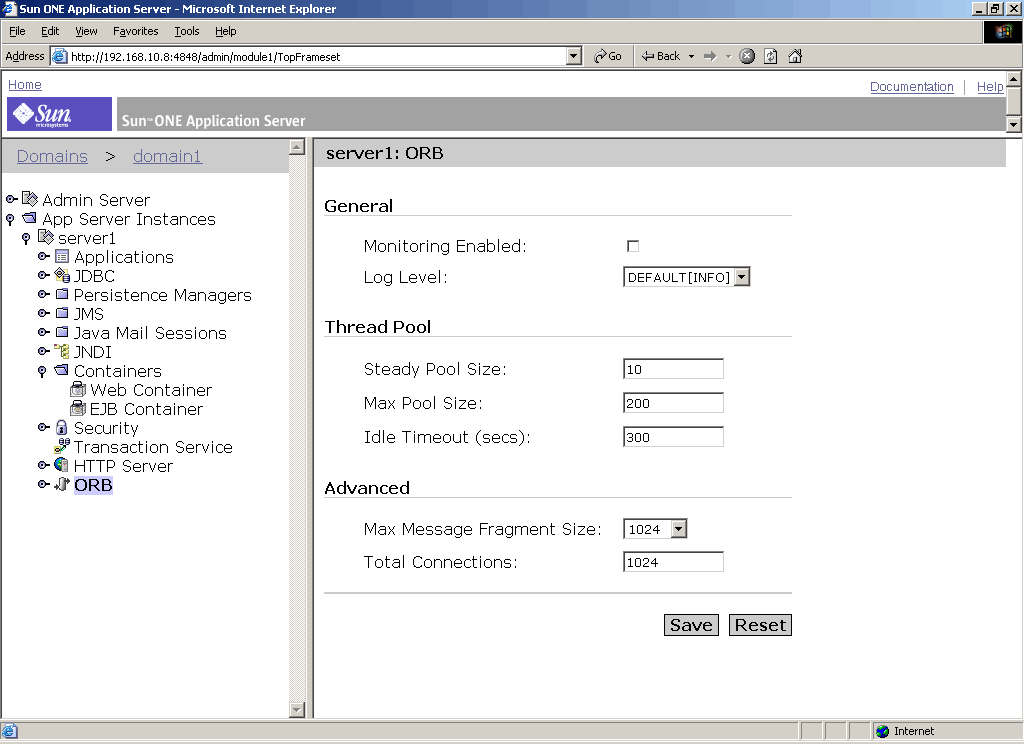
Figure 7 : The EJB Container property
Configuring the eG Agent to Collect JVM-related Metrics from the Sun Java System Application Server 7.0
The jvm layer of the Sun Java System Application monitoring model is mapped to tests that report critical statistics related to the Sun Java System application server’s JVM. These statistics typically reveal the following:
- The count of classes loaded/unloaded (Java Classes test)
- JVM thread usage (JVM Threads test)
- The effectiveness of the JVM’s garbage collection activity (JVM Garbage Collections test)
- The uptime of the JVM (JVM Uptime test)
- Whether JMX is currently enabled/disabled on the target WebLogic server (JMX Connection to JVM test)
- The count and status of file descriptors (JVM File Descriptors test)
These tests connect to the JRE used by the Sun Java System application server to pull out the above-mentioned metrics. For these tests to work, the eG agent should be configured to connect to the JRE and collect the required metrics, using one of the following methodologies:
- JMX (Java Management Extensions)
- SNMP (Simple Network Management Protocol)
Since both JMX and SNMP support are available for JRE 1.5 and above only, these tests will work only if the Sun Java System application server being monitored uses JRE 1.5 and above.
Note:
Version 7.0 of the Sun Java System Application server uses JDK 1.4 by default. Therefore, before enabling the optional JVM tests for this server, make sure you change to JDK 1.5.
If you choose to use JMX for pulling out the desired metrics from the JRE, then the following broad steps need to be followed:
- First, determine whether the JMX requires no authentication at all, or requires authentication (but no security)
- If JMX does not require authentication, follow the steps below:
- Login to the target Sun Java System application server.
- Edit the management.properties file that is used by the JRE of the target Sun Java System application server, and configure the following in it:
- The JMX remote port
- Whether JMX is SSL-enabled or not
- Whether JMX requires authentication or not
- To know how to configure these, refer to the Monitoring Java Applications document.
- Save the file.
If the JMX requires authentication (but no security), follow the steps below:
- Login to the target Sun Java System application server. If the server is executing on a Windows host, then, login to the host as a local/domain administrator.
- Next, copy the jmxremote.password.template file in the <JAVA_HOME>\jre\lib\management folder to any other location on the host, rename it as as jmxremote.password, and then, copy it back to the <JAVA_HOME>\jre\lib\management folder.
- Next, edit the jmxremote.password file and the jmxremote.access file to create a user with read-write access to the JMX. To know how to create such a user, refer to Monitoring Java Applications document.
- Then, proceed to make the jmxremote.password file secure by granting a single user “full access” to that file. To know how to achieve this, refer to the Monitoring Java Applications document.
-
Edit the management.properties file that is used by the JRE of the target Sun Java System application server, and configure the following in it:
- The JMX remote port
- Whether JMX is SSL-enabled or not
- Whether JMX requires authentication or not
- The full path to the jmxremote.access file
- The full path to the jmxremote.password file
To know how to configure these, refer to the Monitoring Java Applications document.
- Then, save the file.
- Next, download the crimson.jar file from the URL, http://www.java2s.com/Code/Jar/ABC/Downloadcrimson113jar.htm , to any location on the Sun Java System application server host.
- Copy the crimson.jar file to the <SUN_ONE_APP_SERVER_HOME>\lib directory.
- Then, connect to the admin console of the Sun Java System application server using the URL:<Sun Java SystemAppServerIP>:<Sun Java SystemPort>/
- The default port number is: 4848
- Login to the console by providing valid credentials.
- Once the console opens, follow the node sequence click on App Server Instances and then click on the name of the Sun Java System application server instance being monitored.
-
When Figure 8 appears, click on the JVM Settings tab page. Then, click on the Path Settings link. In the Classpath Suffix text area, add a line indicating the full path to the crimson.jar file.
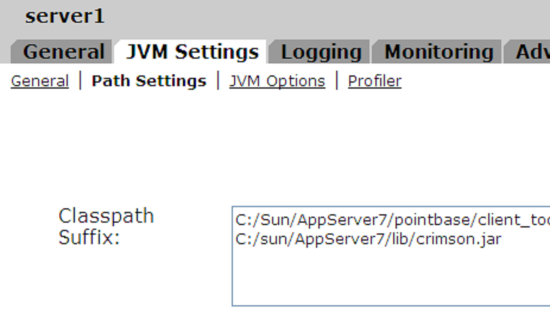
-
Save the settings and then, click he JVM Options link. In the JVM Option text box of Figure 9, specify the following:
-Dcom.sun.management.config.file=<Full path to the management.properties file of the JRE used by the target Sun Java System Application server>
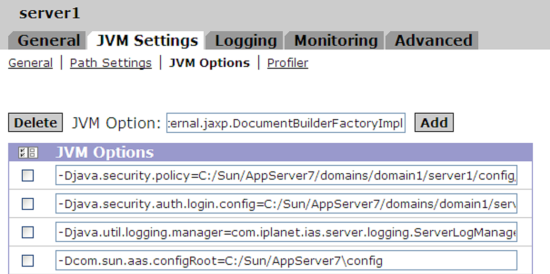
Figure 9 : Configuring the path to the management.properties file
- Then, click the Add button in Figure 9 to add the path specification to the JVM Options section.
- Click the General link, click on Apply changes, and then restart the target server.
- If the server does not start and throws errors instead, check the <App_Server_Home>\domains\domain1\server1\logs\server.log for details.
Note:
To know how to enable SNMP support for the JRE, refer to the Monitoring Java Applications document.