Sessions by Users Report
The key challenge in monitoring large thin client farms or virtual desktop environments is to keep track of the user activity on the servers in the farm. Using the Sessions by Users Report provided by eG Enterprise, administrators can figure out at what times the specified user logged in, which server the user accessed, how much CPU/memory was utilized by the user, and the applications/VMs used by the user. Like the other Citrix / VDI reports, the Sessions by Users Report too permits administrators to customize the view by specifying the measures to be displayed in the report and computations to be performed on the measures (such as Avg, Max, Min etc.). Additionally, you can generate a report for all the users who are part of the active directory groups in a domain.
To view the User session details report, do the following:
-
From the eG Reporter interface, select the Sessions by Users option from the Sessions sub node by following the menu sequence: REPORTS BY FUNCTION -> Domain-specific Reports -> Virtual Applications /Desktops.
-
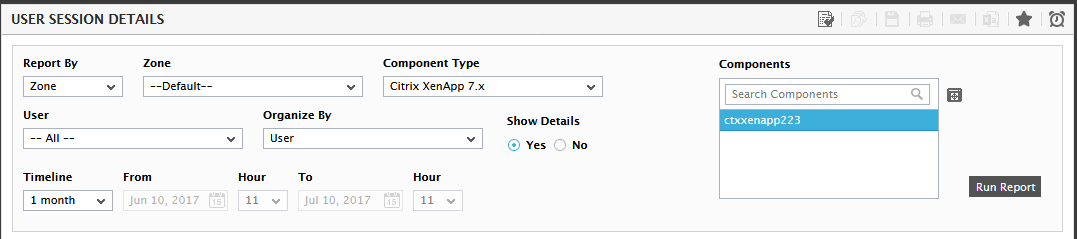
When Figure 1 appears, select a criterion for analysis from the Report By list box. Using this report, you can analyze the user session details of the virtual components that are included in a zone. This way, you can assess the impact of the user sessions on the virtual components of a particular service/segment/zone, and accordingly take decisions. The options provided by the Report By list box are discussed hereunder:
- Component:Select this option to choose the component(s) from across all the managed components in the environment. For instance, for a report on the user session details of all the managed vSphere ESX hosts in the environment, select VMware vSphere ESX from the Component Type list, select Component from the Report By list, and then select all the virtual hosts listed in the Components list of Figure 1. If the Components list consists of too many components, then viewing all the components and selecting the ones you need for report generation could require endless scrolling. To avoid this, you can click the
 button next to the Components list. The COMPONENTS pop up window will then appear using which you can view almost all the components in a single interface and Select the ones for which the report is to be generated.
 - Service: Select this option if the components for which a report is to be generated are involved in the delivery of a business service. Then, select a Service.
- Segment: Choose this option if the virtual hosts to be evaluated are part of a segment. Then, pick a Segment for analysis.
- Component:Select this option to choose the component(s) from across all the managed components in the environment. For instance, for a report on the user session details of all the managed vSphere ESX hosts in the environment, select VMware vSphere ESX from the Component Type list, select Component from the Report By list, and then select all the virtual hosts listed in the Components list of Figure 1. If the Components list consists of too many components, then viewing all the components and selecting the ones you need for report generation could require endless scrolling. To avoid this, you can click the
-
If Citrix XenApp 4/5/6.x is chosen from the Component Type list, then a Worker Group list box will appear. Worker groups are collections of XenApp servers, residing in the same farm, that are managed as a single unit. You can publish applications to a worker group. Select a Worker Group from this list if you wish to view the usage of a User belonging to that particular worker group. By default, Any option is selected from this list.
Note:
The Worker Group list box will appear only if the SHOW WORKER GROUPS flag is set to Yes while configuring the Citrix XA Users test.
-
Next, choose the User whose usage needs to be tracked. For a report on all users to the chosen Zone, select All from User.
Note:
If the number of users to the zone exceeds the value configured for the MoreUsers parameter of the [CITRIX_USER_REPORT] section (in the {EG_INSTALL_DIR}\manager\config\eg_report.ini file), then a text box will be displayed instead of the list box for the User field. In the case of the text box, you will have to specify (and not choose) the name of the user for whom the report is to be generated. To generate a report for all available users, specify '*'.
-
The Organize By list box appears only when All option is selected from the User list. To generate this report for a particular thin client user, select the Users option from this list. To generate a thin client report for all users who belong to active directory groups, pick the Active Directory Group option from this list (see Figure 2).
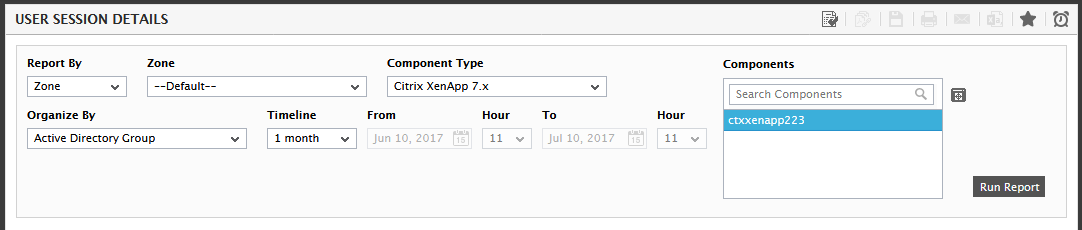
Figure 2 : Selecting the Active Directory Group option
Note:
The Organize By list box will appear only if the Report by security group flag in the SETTINGS FOR AD USERS REPORT (see Figure 7) is set to Yes. Selecting the Active Directory Group option from this list box alone will not ensure you of generating an active directory group-wise user report. To generate the active directory group-wise user report, you need to configure the domains of the active directory groups in the first place. To know how to discover the domains and configure the Active Directory Groups for which this report is to be generated, refer Section Procedure for discovering the domains of the Security Groups.
- By default, the Show Details flag is set to Yes indicating that the report will be generated for each user session initiated on the target server. If this flag is set to No, then the sessions initiated by each user will be consolidated while the generating the report.
- If this report is to be generated for virtual desktop infrastructure component types (for e.g., VMware vSphere VDI), then, by default, this report will provide the outside view of user performance. However, if you wish to optionally display/generate the inside view of user performance, then, you can pick the Inside view option from the Resource Details from list. By default, the Outside view option is chosen from this list.
-
Then, specify the Timeline for the graph. You can either provide a fixed time line such as 1 hour, 2 days, etc., or select the Any option from the list to provide a From and To date/time for report generation.
Note:
- The default Timeline can be set using the consolidated reports page in the eG administrative interface; to access this page, follow the menu sequence: Configure -> Reports -> Consolidated. For more details regarding this page, refer to Section Consolidated Reports of this manual.
-
Shorter the Timeline for a report, lighter would be the query that is executed on the database, and faster the report generation. Report Timelines that run across many weeks therefore, cause excessive strain on the database, thus slowing-down report generation. To save the eG backend from injury, eG Enterprise automatically restricts the maximum Timeline for which a thin client report can be generated to the lower of the following values:
- the value of the CtxLoginTest parameter in the [ddd_cleanup] section of the eg_format.ini file (in the <EG_INSTALL_DIR>\manager\config directory)
- the value of the MaxTimeline parameter in the [misc] section of the eg_report.ini file (in the <EG_INSTALL_DIR>\manager\config directory).
-
The maximum timeline for which the current user to eG Reporter is permitted to generate reports;
The [ddd_cleanup] section is where you define the interval (in days) at which the detailed diagnosis of specific tests is to be purged from the database. For the CtxLoginTest, the default interval is set to 32 days (i.e., just over a month), indicating that, by default, the detailed diagnosis of the CtxLoginTest is cleared from the database at the end of every month. Since critical thin client reports are generated based on the detailed diagnosis information, a Timeline that exceeds the duration set against CtxLoginTest would result in a report that displays invalid/no data. This duration however, is configurable. Similarly, you can also configure a MaxTimeline in the [misc] section of the eg_report.ini file. By default, this parameter is set to 168 (hours), indicating that the maximum Timeline for a thin client report is 1 week (i.e., 24 * 7 = 168 hours). Also, while creating user profiles using the eG administrative interface, an administrator can indicate the maximum timeline for which that user can generate reports, so as to avoid long running reports.
Now, assume that you have set the CtxLoginTest parameter to 21 days (i.e., 3 weeks) and the MaxTimeline parameter to 336 hours (i.e., 2 weeks). Also, say that user john with access rights to eG Reporter has been configured to generate reports for a maximum timeline of 1 week. Therefore, whenever user john logs into eG Reporter and attempts to generate a thin client report, eG Enterprise compares the three values, picks the lowest of the three, and sets that value as the maximum Timeline for thin client reports. In our example, the maximum timeline settings of user john (i.e., 1 week) is the lowest Therefore, the maximum value that will be available for selection from the Fixed Timeline list box in the thin client report page will be 1 week.
Note that this timeline restriction does not apply to fixed timeline settings alone. If a user chooses the Any option from the Timeline list and proceeds to provide a start date and end date for report generation using the From and To specifications, eG Enterprise will first check if the user's Timeline specification is equal to or below the lowest of the three values discussed above. If not, report generation will fail. For instance, for a user who is allowed to generate reports spanning over a maximum period of 3 days only, the difference between the From and To dates should never be over 3 days. If it is, then, upon clicking the Run Report button a message box will appear, prompting the user to change the From and To specification.
-
In addition to the settings discussed above, this report comes with a set of default specifications. These settings are hidden by default. If you do not want to disturb these default settings, then you can proceed to generate the report by clicking the Run Report button soon after you pick a User. However, if you want to view and then alter these settings (if required), click on the
 icon. The default settings will then appear in the MORE OPTIONS drop down window (see Figure 3). The steps below discuss each of these settings and how they can be customized.
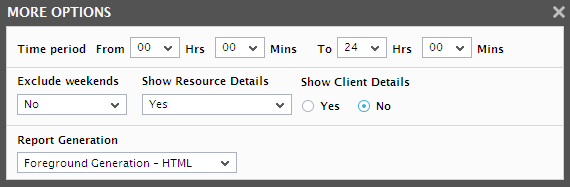
Figure 3 : The default settings for generating the User Session Details report
-
Specify the start time and end time for report generation against the Time period field (see Figure 3).
Note:
The default Time period to be displayed here can be configured using the consolidated reports page in the eG administrative interface; to access this page, follow the menu sequence: Settings -> Reporter -> Consolidated Reports. For more details regarding this page, refer to Section Consolidated Reports of this manual.
-
If the timeline specified for the report needs to exclude the data collected during the Weekends, then set Exclude weekends to Yes. If not, select No.
Note:
You can configure the days of the week that need to be considered as a ‘weekend’ using the consolidated reports page in the eG administrative interface; to access this page, follow the menu sequence: Settings -> Reporter -> Consolidated Reports. For more details regarding this page, refer to Section Consolidated Reports of this manual.
- By default, the Show Resource Details flag is set to Yes indicating that the resource utilization of each user session will be reported by the generated report. If you do not wish to generate the resource utilization in this report, then set this flag to No.
- By default, the Show Client Details flag is set to Yes indicating that the IP address from which the user has initiated the session will be reported by the generated report. If you do not wish to track the IP address of the user, then set this flag to No.
-
In large environments, reports generated using months of data can take a long time to complete. Administrators now have the option of generating reports on-line or in the background. When a report is scheduled for background generation, administrators can proceed with their other monitoring, diagnosis, and reporting tasks, while the eG manager is processing the report. This saves the administrator valuable time. To schedule background processing of a report, you can either select the Background Save - PDF option or the Background Save - CSV option from the Report Generation list. In this case, a Report Name text box will appear, where you would have to provide the name with which the report is to be saved in the background. To process reports in the foreground, select the Foreground Generation - HTML option from this list.
Note:
- The Report Generation list will appear only if the EnableBackgroundReport flag in the [BACKGROUND_PROCESS] section of the eg_report.ini file (in the {EG_INSTALL_DIR}\manager\config directory) is set to Yes.
- The default selection in the Report Generation list will change according to the Timeline specified for the report. If the Timeline set is greater than or equal to the number of days specified against the MinDurationForReport parameter in the [BACKGROUND_PROCESS] section of the eg_report.ini file, then the default selection in the Report Generation list will be Background Save - PDF. On the other hand, if the Timeline set for the report is lesser than the value of the MinDurationForReport parameter, then the default selection in the Report Generation list will be Foreground. This is because, the MinDurationForReport setting governs when reports are to be processed in the background. By default, this parameter is set to 2 weeks - this indicates that by default, reports with a timeline of 2 weeks and above will be processed in the background.
- Finally, click the Run Report button to generate the report.
-
If a specific user is chosen from the User list and the option chosen from the Report Generation list is Foreground Generation - HTML, then, a report depicted by Figure 4 will appear upon clicking the Run Report button.
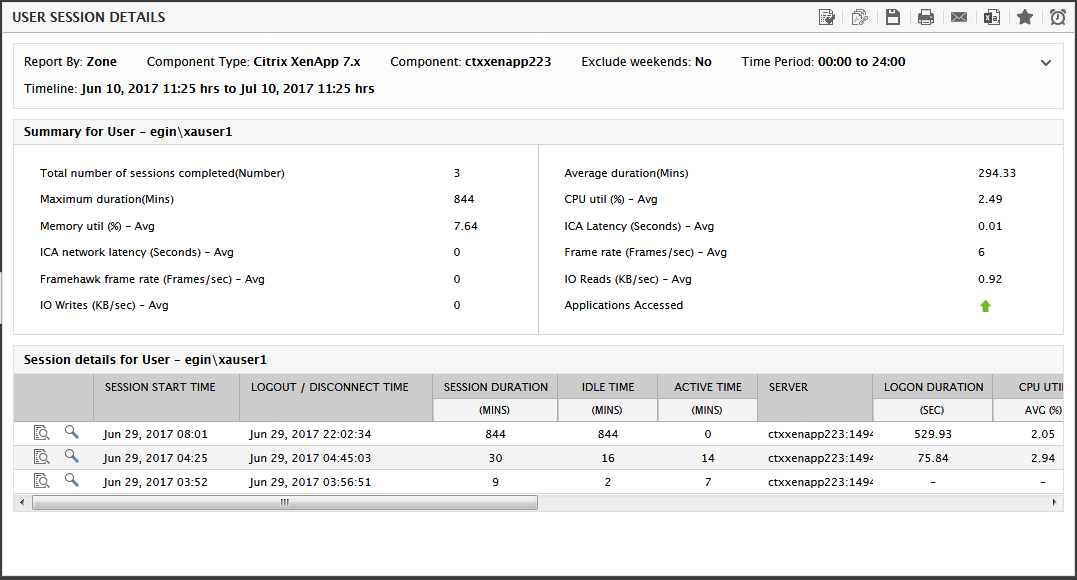
- The report consists of a Summary section that displays the average and maximum duration for which the specified user accessed the servers in the farm, and the values of the user-configured measures aggregated at the farm-level. The session details section of the report displays the user-configured measures along with when and to which Citrix/ Microsoft RDS/VDI/Hyper-V server the chosen user logged in and the duration of every access. Besides, this report displays the idle time for each user. Users who are not effectively using the server/desktop resources made available to them can be identified in the process. For Citrix and Microsoft RDS servers alone, the SESSION DETAILS section is followed by another section that provides details of the disconnected sessions (if any) of the chosen user during the specified timeline. These details include the exact time at which the eG agent reported the disconnect, the session ID corresponding to the disconnected session, and the client type. Typically, when a user disconnects, the applications started by the user will keep running on the server consuming resources. By providing the complete details of disconnected sessions pertaining to a user, the User report enables administrators to identify times when the resources available to the server were unnecessarily locked owing to disconnects, investigate the reasons behind the disconnects, and endeavour to minimize these occurrences.
-
From the User Report for a Citrix XenApp/MF XP server in particular, you can determine which applications in the entire farm were excessively utilized by the given user, and which Citrix servers these applications are executing on. To do so, click on the arrow against the Applications Accessed link in the summary section. Figure 5 will then appear.
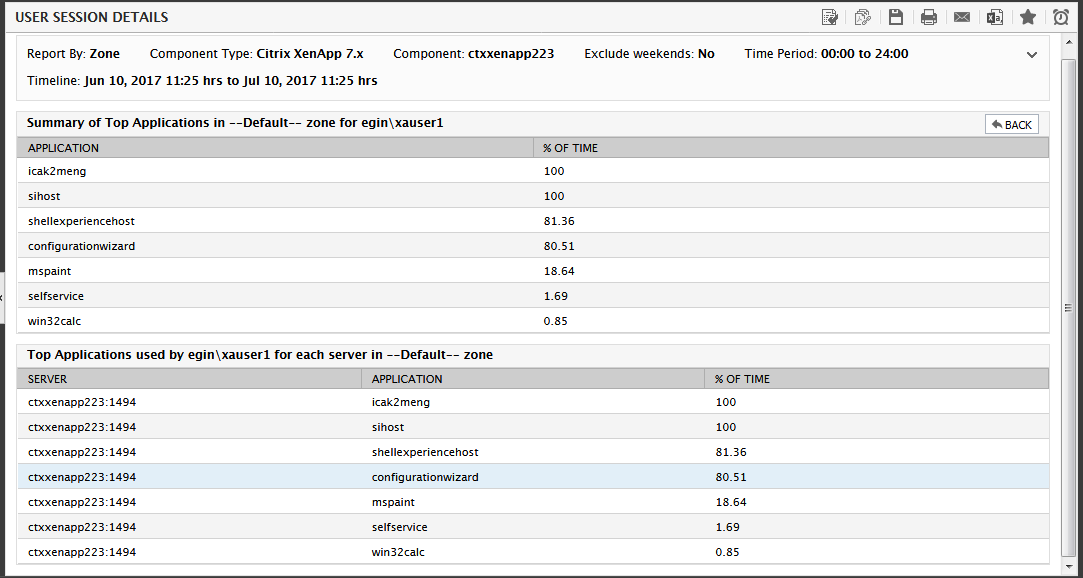
- The first section of Figure 5 provides a farm-level summary of the utilization of the applications. The second section lists the servers in the farm, the applications executing on each of the servers, and the percentage of time every application on that server was utilized.
- To return to the User Report click on the BACK button in Figure 5.
- Now, to receive a quick update on the health of any of the servers in the chosen Zone, simply click on the corresponding Server hyperlink in the session details section of the User Report. A Server Report will then appear.
-
Also, if the user report pertains to a Citrix/Microsoft RDS user (i.e., if the Component Type chosen for the report is Citrix XenApp, Citrix MF XP, or Microsoft RDS), then, the Session Details section of the User Report will include a
 icon corresponding to each Server in the Session Details section. Click on the icon to view the detailed diagnosis of the resource (CPU and memory) utilization of the individual applications (see Figure 6) on the Citrix/Terminal server.
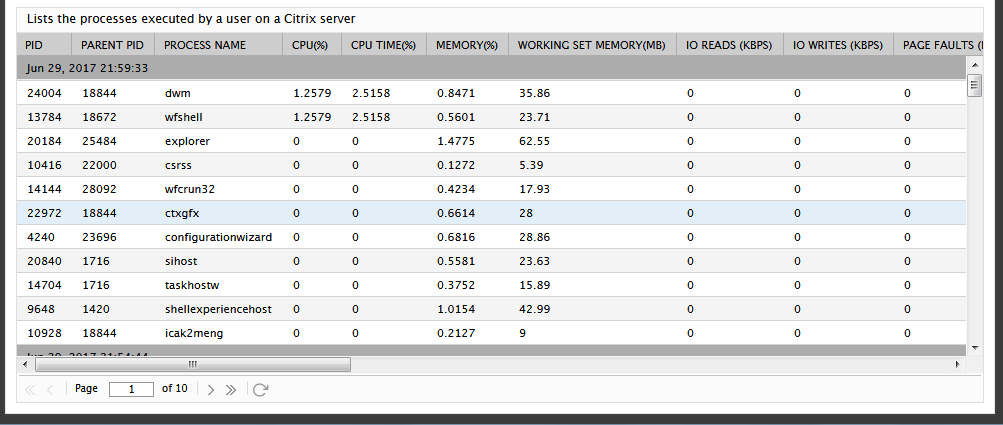
Figure 6 : Detailed diagnosis of the resource utilization of applications
-
In addition to the above, this report also enables you to figure out how the user-configured measures displayed in the session details section performed during the period for which the user was accessing the server. To achieve this, just click on the value of the measure against a Server in the session details section. A graph depicted by Figure 7 will then appear.
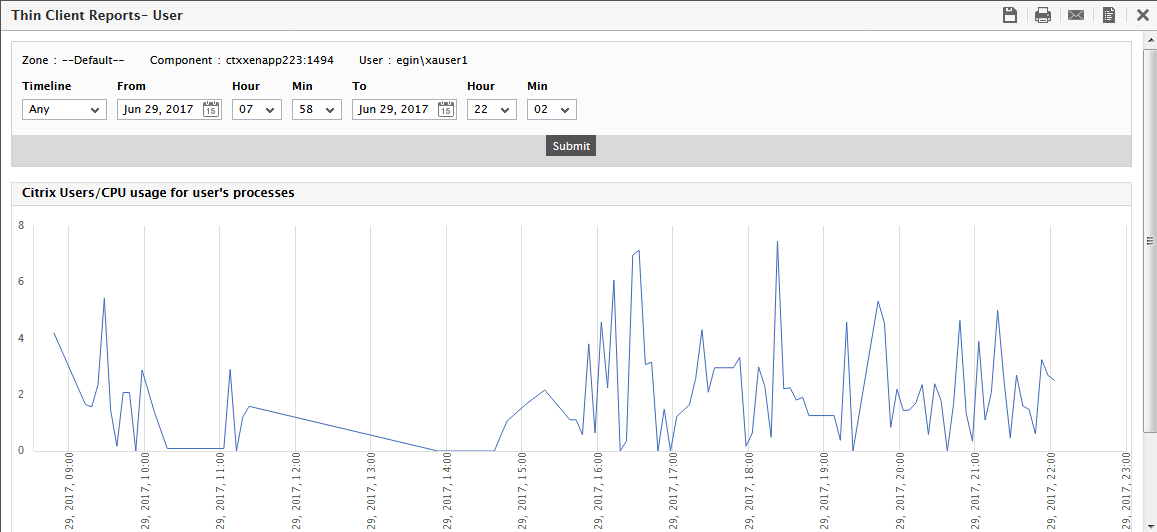
- Using the graph of Figure 7, administrators can determine whether the server has experienced any spikes in resource usage during the user access. If so, then, this could indicate that the user was performing resource-intensive activities on the server, and could warrant a thorough investigation.
-
To view a graphical representation of the performance of certain key session related metrics such as login time, applications accessed, active/idle time, session start-up details, resource usage during the session, etc., you can click on the
 icon. Figure 8 then appears.
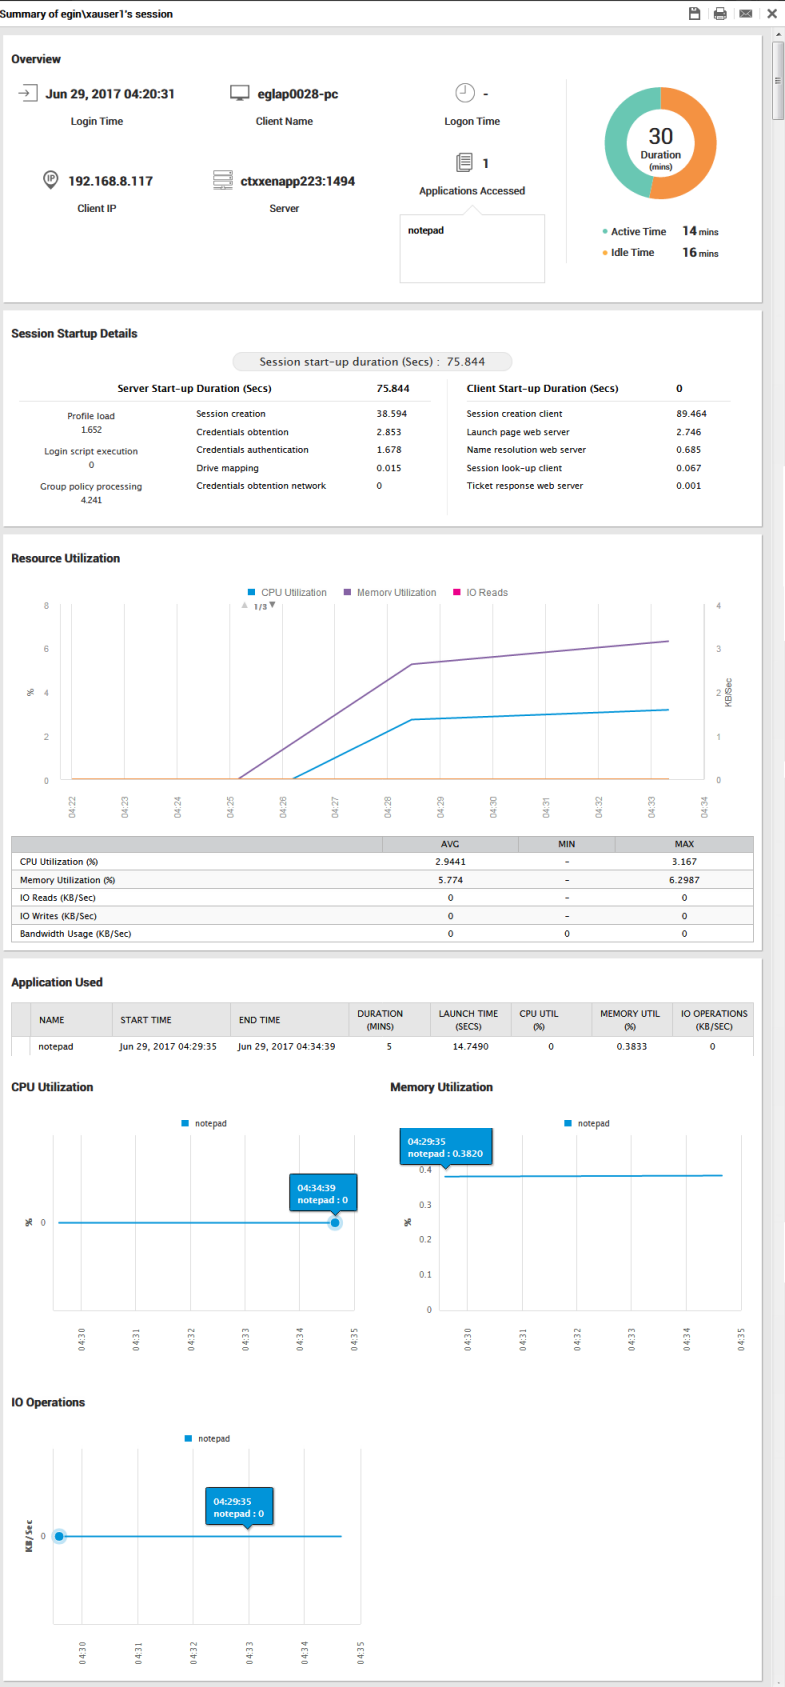
Figure 8 : The graphical representation of key metrics
Besides being visually appealing, the graphics also help rapidly detect problem areas.
-
If you have chosen All from the User list, the Active Directory Group is chosen from the Organize By list box, All from the AD Group list and the AD Users list (see Figure 9) and the option chosen from the Report Generation list is Foreground Generation - HTML, then, a report depicted by Figure 10 will appear upon clicking the Run Report button.
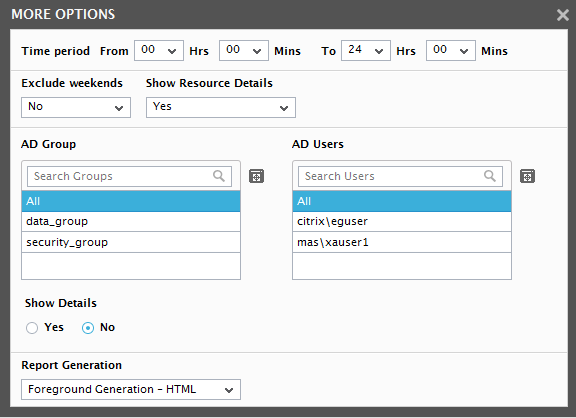
Figure 9 : Selecting the All option from the AD Group and the AD Users list
-
The session details section of the report displays the user-configured measures along with when and to which Citrix/ Microsoft RDS/VDI server the users of an Active Directory group logged in, the duration of their access and the time. If the users are not part of any of the active directory groups, then the session details of such users will be listed under the Default section.
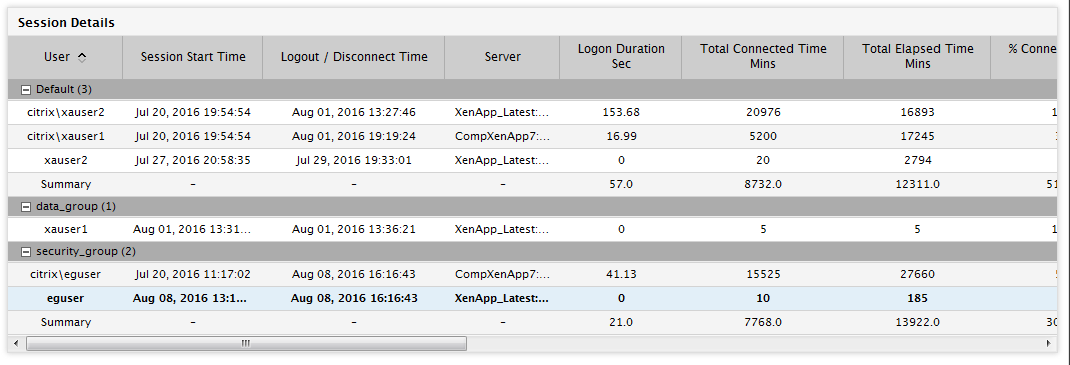
Figure 10 : The Active Directory group wise Thin client User report
-
If you want to generate the User Session Details report for a chosen Active Directory group, then you can do so by selecting the group from the AD Group list. For example, if you want to generate this report for the security_group group, then Figure 11 will appear listing the users within the AD group.
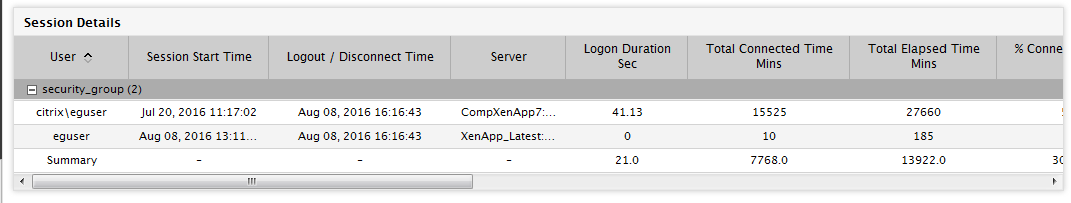
Figure 11 : The User Sessions Details report generated for a chosen AD group
-
Clicking on a server in the Server column of Figure 10 and Figure 11 will lead you to Figure 12 which displays the APPLICATION PERFORMANCE report.
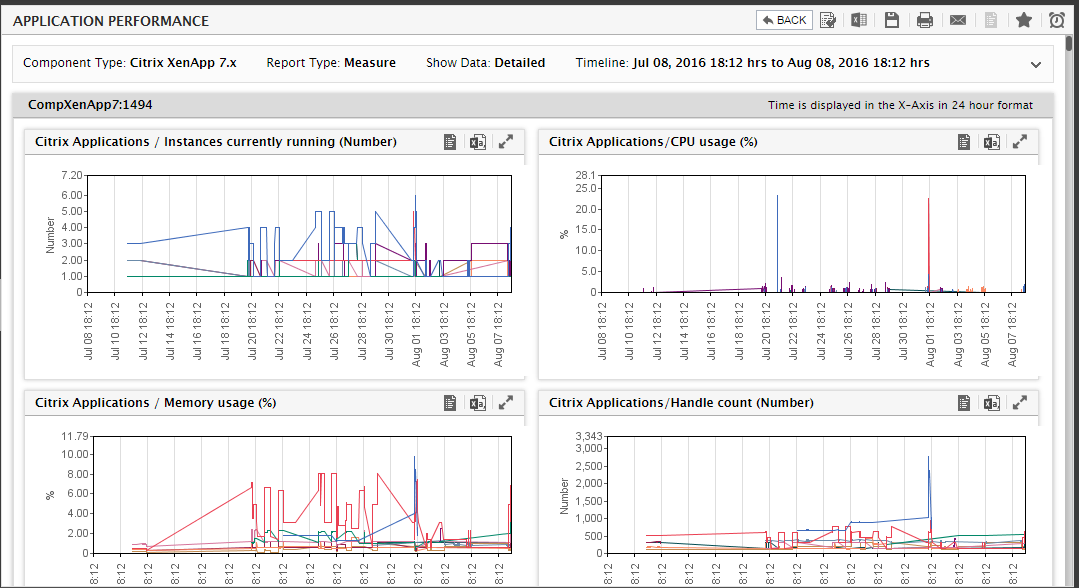
Figure 12 : The Application Performance report that appears when a Server is clicked
- On the other hand, if the Background Save - PDF option is chosen from the Report Generation list, then clicking on the Run Report button will not generate the report and display it in this page for your benefit. Instead, a message indicating that the report is being processed in the background will appear. This will be accompanied by a link that will lead you to the page that lists all the reports that are being processed in the background, and their current status. If background report generation fails for a report, you can regenerate that report using this page, or can even delete that report if need be. On the other hand, if background processing successfully completes for your report, then, you can view a PDF of the report by clicking on the
 icon in that page.
Note:
To configure the details that need to appear in the Summary and session details section of the report, edit the [CITRIX_user_report] section of the eg_report.ini file in the <EG_INSTALL_DIR>\manager\config directory. For example, you can specify the following in the above-mentioned section:
[CITRIX_USER_REPORT]
Citrix_MF_XP:CtxXpUserTest:Cpu_util#Cpu utilization=Avg,Max
Citrix_MF_XP:CtxXpUserTest:Mem_util#Mem util=Avg,Max
Citrix_MF_XP:CtxXpUserTest:Latency_avg=Avg,Max
From the above example, the following format can be inferred for the measure specification.
<InternalComponenttype>:<InternalTest>:<InternalMeasure>#<Display name of Measure>=<Comma-separated list of functions>
Before proceeding with the configuration, determine the internal component-type, test, and measure names that you intend using in your measure specification, using the procedure discussed in Page First, determine the Internal name of the test and measure to be configured. For that, do the following: of this manual.
Accordingly, in the first line of the example above:
- Citrix_MF_XP is the <InternalComponenttype>
- CtxXpUserTest is the <InternalTest>
- Cpu_util is the <InternalMeasure>
-
Cpu utilization is the <Display name of Cpu_util>
Note:
If a display name is not provided for a measure, then the actual measure name will automatically become the display name.
- Avg and Max are the functions that will be executed on the value of the Cpu_util measure.
Note:
By default, the Summary section will display only the average (Avg) values of the configured measures. However, if specific function names are provided in the [citrix USER_REPORT] section in the format discussed above, then such a specification will override the default setting.