Applications - Top Applications Report
In order to make sure that a Citrix/Terminal server performs at its peak at all occasions, it is essential to keep tab on the number of applications executing on the server and their combined and individual resource usage. If the most popular applications in a farm can be identified, administrators can consider alternative load balancing strategies to ensure that the most popular or most resource intensive applications are hosted on different servers.
The Applications - Top Applications Report provided by eG Enterprise facilitates a comprehensive review of the usage of applications hosted on a Citrix/Microsoft RDS server farm. By allowing administrators to configure the application-specific metrics that they want displayed in the report, eG Enterprise ensures that useful and workable information is at the disposal of the administrators at all times. As the administrators get to see what they want to see, they will be able to take more effective performance decisions.
In order to generate the application report, do the following:
- Select the Top Applications option by following the menu sequence: REPORTS BY FUNCTION -> Domain-specific Reports -> Virtual Applications / Desktops -> Applications
-
Figure 1 will then appear. To monitor the servers in a farm, select the Zone to which the servers in the farm have been added.
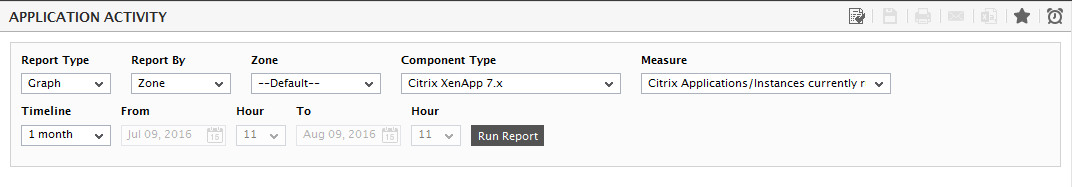
Figure 1 : Generating the Applications - Top Applications report
- When Figure 1 appears, choose a Report Type (Graph or Data). The default Report Type is Graph. To closely observe and clearly understand the behavior of a single performance parameter across a zone, you can plot a single measure's data alone in a Graph report (see Figure 1).
-
Next, select a criterion for analysis from the Report By list box. Using this report, you can analyze the application activity on one/more independent virtualized components, or those that are part of a segment, service, or a zone. This way, you can assess the impact of the applications hosted on the virtual components of a particular service/segment/zone, and accordingly take decisions. The options provided by the Report By list box are discussed hereunder:
- Component: Select this option to choose the component(s) from across all the managed components in the environment. For instance, for a report on the utilization of the application hosted on all the managed vSphere VDI hosts in the environment, select VMware vSphere VDI from the Component Type list, select Component from the Report By list, and then select all the virtual hosts listed in the Components list. If the Components list consists of too many components, then viewing all the components and selecting the ones you need for report generation could require endless scrolling. To avoid this, you can click the
 button next to the Components list. The COMPONENTS pop up window will then appear using which you can view almost all the components in a single interface and Select the ones for which the report is to be generated. You can narrow your search further by using the Search text box. Specify the whole/part of the component name to search for in this text box, and click the
  icon next to it.
 - Service: Select this option if the components for which a report is to be generated are involved in the delivery of a business service. Then, select a Service.
- Segment: Choose this option if the virtual hosts to be evaluated are part of a segment. Then, pick a Segment for analysis.
- Zone: Pick this option for a report on the performance of virtual components that are included in a zone. Then, choose a Zone.
- Component: Select this option to choose the component(s) from across all the managed components in the environment. For instance, for a report on the utilization of the application hosted on all the managed vSphere VDI hosts in the environment, select VMware vSphere VDI from the Component Type list, select Component from the Report By list, and then select all the virtual hosts listed in the Components list. If the Components list consists of too many components, then viewing all the components and selecting the ones you need for report generation could require endless scrolling. To avoid this, you can click the
-
If Citrix XenApp 4/5/6.x is chosen from the Component Type list, then an additional Worker Group list box will appear. Worker groups are collections of XenApp servers, residing in the same farm, that are managed as a single unit. You can publish applications to a worker group. Select a worker group from this list if you wish to view the usage of a User belonging to that particular worker group. By default, Any option is selected from this list.
Note:
The Worker Group list box will appear only if the SHOW WORKER GROUPS flag is set to Yes while configuring the Citrix XA Applications test.
- If the Report Type is Graph, a Measure list box will appear, containing the complete list of measures that you have configured for the report (see Figure 1). From this list, pick the Measure for which a graph is to be generated.
-
Then, specify the Timeline for the graph. You can either provide a fixed time line such as 1 hour, 2 days, etc., or select the Any option from the list to provide a From and To date/time for report generation.
Note:
- The default Timeline can be set using the consolidated reports page in the eG administrative interface; to access this page, follow the menu sequence: Configure -> Reports -> Consolidated. For more details regarding this page, refer to Section Consolidated Reports of this manual.
-
Shorter the Timeline for a report, lighter would be the query that is executed on the database, and faster the report generation. Report Timelines that run across many weeks therefore, cause excessive strain on the database, thus slowing-down report generation. To save the eG backend from injury, eG Enterprise automatically restricts the maximum Timeline for which a thin client report can be generated to the lower of the following values:
- the value of the CtxLoginTest parameter in the [ddd_cleanup] section of the eg_format.ini file (in the <EG_INSTALL_DIR>\manager\config directory)
- the value of the MaxTimeline parameter in the [misc] section of the eg_report.ini file (in the <EG_INSTALL_DIR>\manager\config directory).
- The maximum timeline for which the current user to eG Reporter is permitted to generate reports;
The [ddd_cleanup] section is where you define the interval (in days) at which the detailed diagnosis of specific tests is to be purged from the database. For the CtxLoginTest, the default interval is set to 32 days (i.e., just over a month), indicating that, by default, the detailed diagnosis of the CtxLoginTest is cleared from the database at the end of every month. Since critical thin client reports are generated based on the detailed diagnosis information, a Timeline that exceeds the duration set against CtxLoginTest would result in a report that displays invalid/no data. This duration however, is configurable. Similarly, you can also configure a MaxTimeline in the [misc] section of the eg_report.ini file. By default, this parameter is set to 168 (hours), indicating that the maximum Timeline for a thin client report is 1 week (i.e., 24 * 7 = 168 hours). Also, while creating user profiles using the eG administrative interface, an administrator can indicate the maximum timeline for which that user can generate reports, so as to avoid long running reports.
Now, assume that you have set the CtxLoginTest parameter to 21 days (i.e., 3 weeks) and the MaxTimeline parameter to 336 hours (i.e., 2 weeks). Also, say that user john with access rights to eG Reporter has been configured to generate reports for a maximum timeline of 1 week. Therefore, whenever user john logs into eG Reporter and attempts to generate a thin client report, eG Enterprise compares the three values, picks the lowest of the three, and sets that value as the maximum Timeline for thin client reports. In our example, the maximum timeline settings of user john (i.e., 1 week) is the lowest Therefore, the maximum value that will be available for selection from the Fixed Timeline list box in the thin client report page will be 1 week.
Note that this timeline restriction does not apply to fixed timeline settings alone. If a user chooses the Any option from the Timeline list and proceeds to provide a start date and end date for report generation using the From and To specifications, eG Enterprise will first check if the user's Timeline specification is equal to or below the lowest of the three values discussed above. If not, report generation will fail. For instance, for a user who is allowed to generate reports spanning over a maximum period of 3 days only, the difference between the From and To dates should never be over 3 days. If it is, then, upon clicking the Run Report button a message box will appear, prompting the user to change the From and To specification.
-
In addition to the settings discussed above, this report comes with a set of default specifications. These settings are hidden by default. If you do not want to disturb these default settings, then you can proceed to generate the report by clicking the Run Report button soon after you pick a Measure. However, if you want to view and then alter these settings (if required), click on the
 icon. The default settings will then appear in the MORE OPTIONS drop down window (see Figure 2). The steps below discuss each of these settings and how they can be customized.
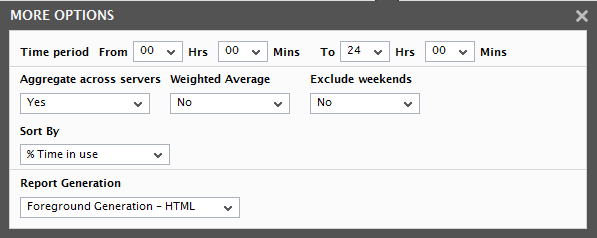
Figure 2 : The default settings for generating an Application Activity report
-
Specify the start time and end time for report generation against the Time period field (See Figure 2).
Note:
The default Time period to be displayed here can be configured using the consolidated reports page in the eG administrative interface; to access this page, follow the menu sequence: Settings -> Reporter -> Consolidated Reports. For more details regarding this page, refer to Section Consolidated Reports of this manual.
-
If the timeline specified for the report needs to exclude the data collected during the Weekends, then set Exclude weekends to Yes. If not, select No.
Note:
You can configure the days of the week that need to be considered as a ‘weekend’ using the consolidated reports page in the eG administrative interface; to access this page, follow the menu sequence: Settings -> Reporter -> Consolidated Reports. For more details regarding this page, refer to Section Consolidated Reports of this manual.
- Using the Weighted Average flag, you can indicate how the Avg value is to be computed for a chosen measure for the purpose of this report. The status of the Weighted Average flag is relevant only if the Test chosen is a descriptor-based test, and the descriptors are dynamic in nature. For instance, the Citrix XA Applications test in our example auto-discovers the applications that are currently running on a Citrix XenApp farm. For each application hosted into the Citrix XenApp, the test reports a variety of statistics. Unlike descriptors such as disk partitions or processors that rarely change, the applications are dynamic descriptors, which may change often; in other words, an application that is currently in use, may not be used at all by the user during the next measurement period. The Citrix XA Applications test will neither report metrics for the inactive descriptors nor display it in the eG monitoring console. This is why, applications in the Citrix XA Applications test are considered ‘dynamic descriptors’.
- By default, this report compares the Avg value of the chosen measure across all selected descriptors. Since the Weighted Average flag is set to No by default, this Avg is computed as the ratio of the sum total of the measure values reported by a descriptor during the given timeline and the total number of times the test is executed during the same timeline. In case of dynamic descriptors however, the Avg values so computed may not reveal the ‘true picture of performance’. This is because, the test may not discover or report metrics for dynamic descriptors throughout a given timeline. For example, take the case of the Citrix XA Applications test. Say, two applications - namely, ‘A’ and ‘B’ are currently published in the Citrix XenApp server. During its first measurement period; the processes running for each application is registered as 2 and 8 respectively. Assume that the second time the Citrix XA Applications test ran, it captured 5 as the number of processes running for application ‘A’. Application ‘B’ however was inactive during the second measurement period, and hence, was not discovered at all. If the Weighted Average flag is set to No by default, then, this report will plot the Avg value of 4 (3+5=8/2=4) for application ‘A’ and 4 (8/2=4) again for application ‘B’. If you notice, unlike application ‘A’, where 8 processes were running over a period of time, in case of application ‘B’, 8 processes were running at one shot! Logically therefore, application ‘B’ has to be ranked above application ‘A’ in terms of the number of processes that were running. However, since the default Avg value computation does not clearly bring out this difference, both application ‘A’ and ‘B’ are treated at par in this report! This is why, in case of dynamic descriptors, you may want to set the Weighted Average flag to Yes. In this case, the eG Enterprise system expresses Avg as the ratio of the sum total of the measure values reported by a descriptor during a given timeline and the ‘total number of times that descriptor was active’ during the same timeline. This implies that if the Weighted Average flag is set to Yes in the example above, the Avg value for application ‘A’ will continue to be 4 (3+5=8/2=4), but the same for application ‘B’ will be 8 (8/1=8). In this report therefore, application ‘B’ will be placed above application ‘A’, thereby accurately pointing you to the top application with the highest number of currently running processes.
- If you have selected Data option from the Report Type list, then an additional Sort By list will appear as shown in Figure 2. Selecting an option (%Time in use or Number of Unique users) from this list to sort the report when generated as PDF.
- If you wish to exclude certain processes of the applications for which the report is to be generated, then select those processes/applications from the Exclude Applications list.
-
In large environments, reports generated using months of data can take a long time to complete. Administrators now have the option of generating reports on-line or in the background. When a report is scheduled for background generation, administrators can proceed with their other monitoring, diagnosis, and reporting tasks, while the eG manager is processing the report. This saves the administrator valuable time. To schedule background processing of a report, you can either select the Background Save - PDF option or the Background Save - CSV option from the Report Generation list. In this case, a Report Name text box will appear, where you would have to provide the name with which the report is to be saved in the background. To process reports in the foreground, select the Foreground Generation - HTML option from this list.
Note:
- The Report Generation list will appear only if the EnableBackgroundReport flag in the [BACKGROUND_PROCESS] section of the eg_report.ini file (in the <EG_INSTALL_DIR>\manager\config directory) is set to Yes.
- The default selection in the Report Generation list will change according to the Timeline specified for the report. If the Timeline set is greater than or equal to the number of days specified against the MinDurationForReport parameter in the [BACKGROUND_PROCESS] section of the eg_report.ini file, then the default selection in the Report Generation list will be Background Save - PDF. On the other hand, if the Timeline set for the report is lesser than the value of the MinDurationForReport parameter, then the default selection in the Report Generation list will be Foreground. This is because, the MinDurationForReport setting governs when reports are to be processed in the background. By default, this parameter is set to 2 weeks - this indicates that by default, reports with a timeline of 2 weeks and above will be processed in the background.
- Finally, click the Run Report button to generate the report.
-
If the Report Type is Graph and the option chosen from the Report Generation list is Foreground Generation - HTML, then, clicking on the Run Report button will invoke Figure 3 revealing the following:
-
A distribution pie chart reveals the number of components in different distribution ranges(see Figure 3). The distribution ranges are obtained based on the first of the configured functions for the chosen Measure. For instance, assume that CPU usageis the chosen Measure. Say that you have configured to display the Avg and Maxof CPU usagein the application report. Typically, both these configured values will appear only in a Data report. In the case of a Graph report however, the first of the two functions - i.e., Avg of CPU usage- alone is calculated for the chosen zone. A quick glance at the pie chart indicates where CPU has been excessively spent. Click on a particular slice in the pie chart to view the list of applications that fall within the value range represented by that slice (see Figure 4). Against every application name, the actual values for each of the configured functions (both Avg and Max, in our example) will be displayed.
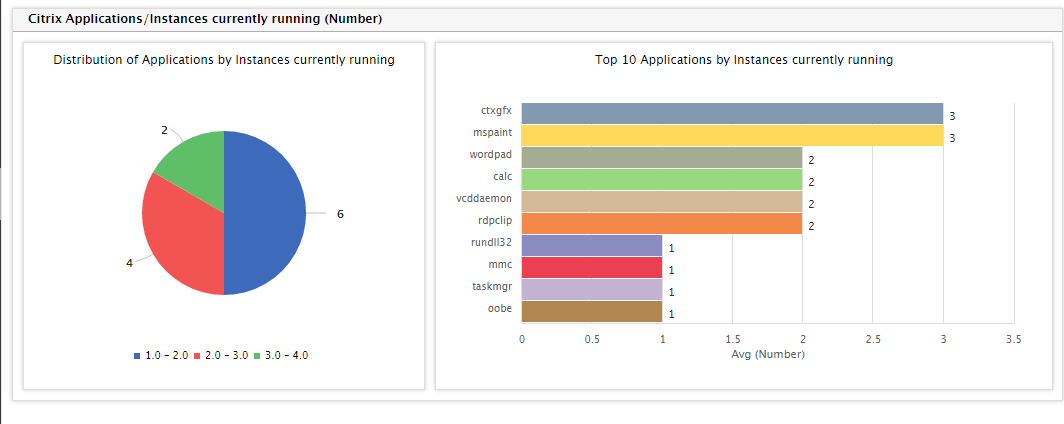
Figure 3 : A graphical Thin client Application Activity report
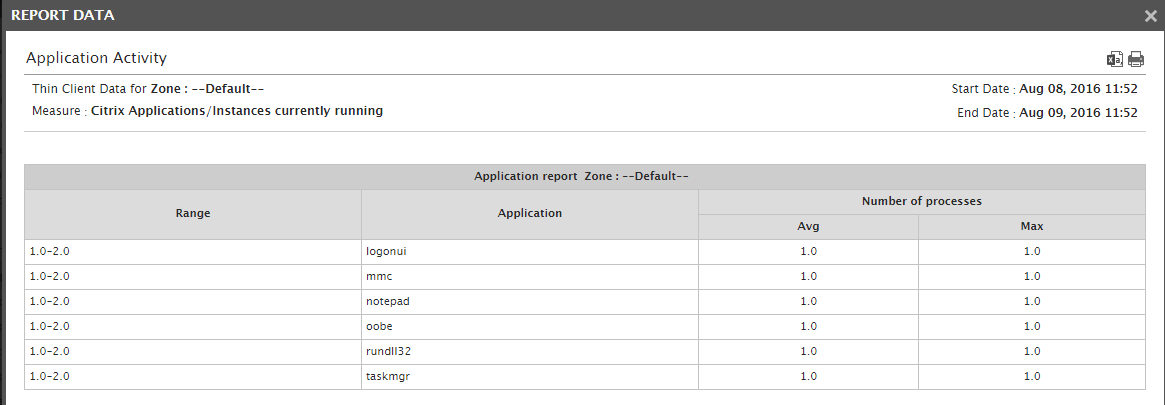
Figure 4 : A list of applications with Instances running in a given range
Note:
-
By default, the chart type for distribution is a pie chart. However, you can have a bar graph depict the same data instead of a pie chart, by following the steps given below:
- Edit the eg_report.ini file in the <EG_INSTALL_DIR>\manager\config directory.
- Change the value of the chartTypeForDist parameter in the [application_report] section of this file from the default Pie, to Bar.
- Save the eg_report.ini file.
-
By default, the number of value ranges that need to be configured for the distribution chart is 10. To override this default setting, do the following:
- Edit the eg_report.ini file in the <eg_install_dir>\manager\config directory.
- Specify a number of your choice against the nofRangeForDist parameter in the [application_report] section of this file. By default, this parameter will hold the value 10.
- Save the eg_report.ini file.
-
-
Alongside the pie chart, you will find a bar chart that indicates the applications that have topped/failed in a selected performance realm (i.e., the Measure) during the specified Timeline. For example, for the Processes running measure, this bar chart reveals the top processes-consuming applications in the entire zone. Like the pie chart, the values for the bar chart are also calculated by applying the first of the configured functions on the chosen Measure.
Note:
- The number of components to be displayed in the Top <N> Components bar chart is configurable. To specify the number, do the following:
- Edit the eg_report.ini file in the <eg_install_dir>\manager\config directory.
- Specify a number of your choice against the NoOfServersforChart parameter in the [application_report] section of the file. By default, the value displayed here is 10, indicating that, by default, the bar chart will be for the Top 10 Components. For example, if you change this value to 5, then a bar chart displaying the Top 5 Components will appear.
-
Finally, save the eg_report.ini file.
Note:
You can configure the colors to be used in the distribution chart and the Top <N> Components bar chart in the application report, by editing the eg_report.ini file in the <eg_install_dir>\manager\config directory. The [application_report] section of this file defines the 20 default colors of the distribution and bar charts of an application report, in the following format:
[APPLICATION_REPORT]
ChartColor=#8399b0,#ffd95a,#a4ac91,#98d980,#d5b996,#f48848,#8b8cc2,
#eb4052,#c4b3d0,#b18651,#ebb7ce,#028768,#f5c372,#887c65,#e4c536,
#b5582c,#f94989,#770d72,#97a067,#89aeb7distColor=#115fa6,#f25454,#60bd68,#b276b2,#81bef7,#a61120,#ffd13e,
#770d72,#887c65,#a4ac91You can override the default color settings of the distribution chart by modifying the color-codes specified against distColor. For changing the colors used by the Top <N> Components chart, alter the codes listed against the ChartColor parameter.
-
- A Data report, on the other hand, does not graphically represent the measure data. Instead, the configured details are presented in a tabular format in the report (see Figure 5).
- If you choose Data as the Report Type, then you will have to select the server for which the report is to be generated from the Components list.
- If you choose Data as the Report Type, you will have to select the column by which the report data is to be sorted from the Sort By list (see Figure 2). Selecting an option (%Time in use or Number of Unique users) from this list will sort the report based on the chosen column when generated as PDF.
- Next, choose a specific Application to be monitored, or select the All Applications option.
- Then, like in the case of a Graph report, provide a Time period, Timeline, and indicate whether/not to Exclude weekends. Also, pick the Foreground Generation - HTML option from the Report Generation list. Finally, click on the Run Report button.
-
In case of a Data report, a table providing the critical performance statistics (see Figure 5) for the chosen server will appear. By default, the following metrics will be displayed:
- The Avg number of instances of an application executing on the chosen server
- The Avg CPU utilization of every application
- The Avg memory utilization of every application
While these default metrics cannot be changed, you can, however, configure functions other than Avg to be executed on the values reported by these metrics. Similarly, additional metrics can also be configured for display in the report.
Besides the default and configured measure information, the Data report displays the percentage of time for which the chosen application(s) was in use, and the number of distinct (unique) users who were accessing the application(s) during the specified timeline. This information clearly indicates the least and the most used applications on the server.
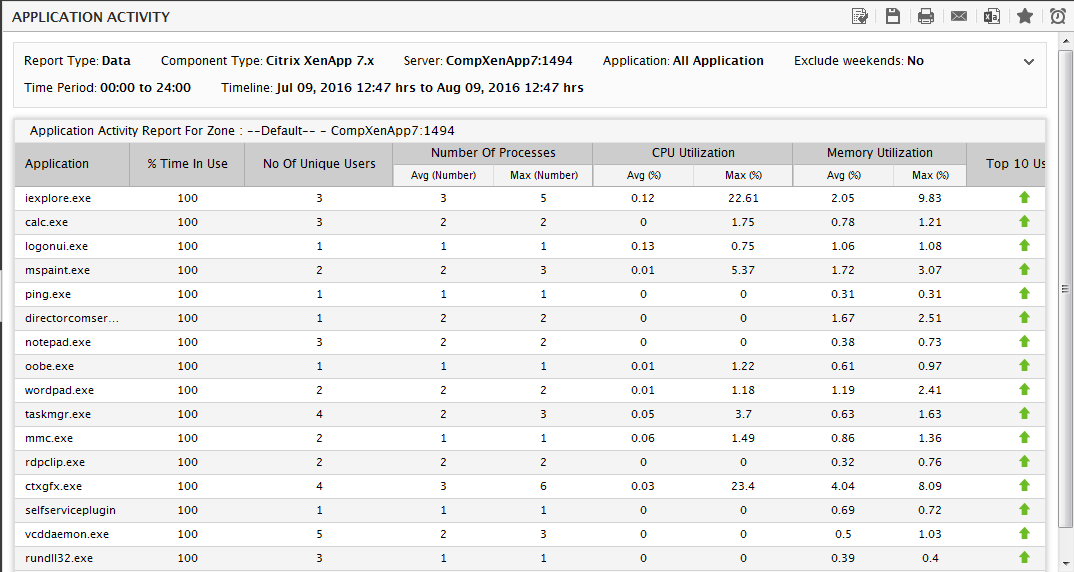
Figure 5 : The Application Activity data report
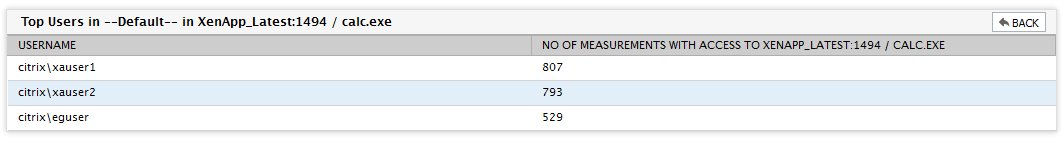
Also, to view the top-n users of the application at the server-level, click on the Top <N> users link corresponding to the application. Figure 6 will then appear listing the top-n users of the application on the chosen Server.
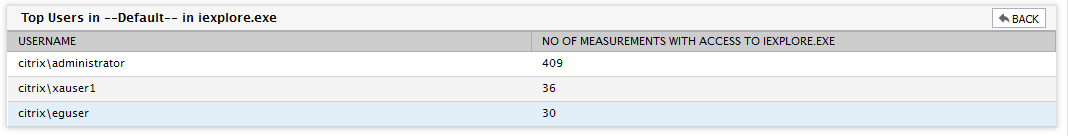
Figure 6 : Top users of the application at the server-level
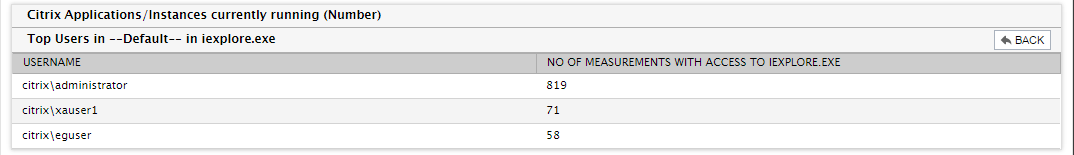
If, at step 16 above, if all the Components of a chosen Component Type or the All Applications options had been chosen, then an additional Aggregate across servers list will appear, as depicted by Figure 2. While monitoring the applications executing on all the servers in a chosen Zone, you can indicate whether the measures to be displayed in the report are to be aggregated at the zone-level or the individual server-level. Selecting Yes from the Aggregate across servers will ensure that the usage metrics displayed in the report for the chosen application(s) is aggregated across all the servers in the selected zone. Clicking on the Top <N> users link corresponding to an application in this report will therefore reveal the top-n users of the application across the entire zone (see Figure 8).
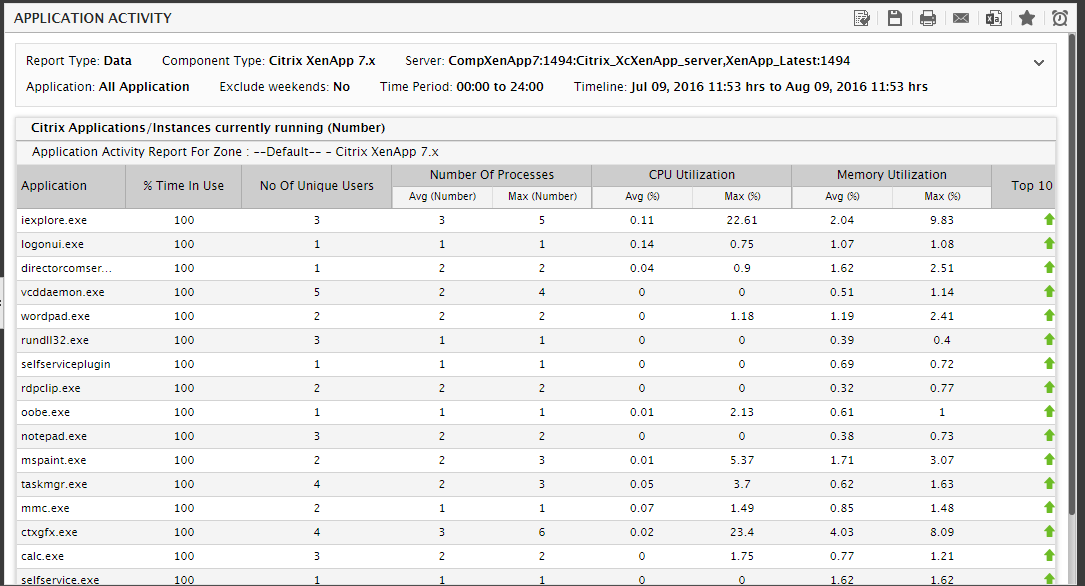
Figure 7 : Zone-based aggregation
-
On the other hand, if you select the No from Aggregate across servers list, then the report will reflect the usage of every chosen application(s) on every server in the selected zone - in other words, the report will display a different set of metrics for every server-application combination (see Figure 9). In this case therefore, clicking on the Top <N> users link that corresponds to a server-application combination will list the top-n users of that application on that server (see Figure 10).
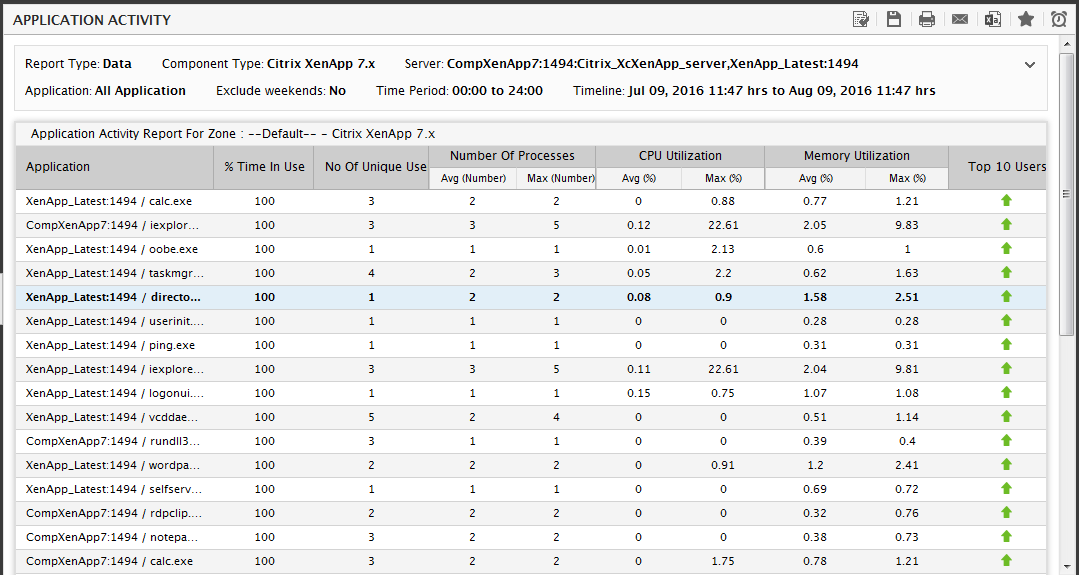
Figure 9 : Aggregation at the server-level
-
If the Background Save - PDF option is chosen from the Report Generation list, then clicking on the Run Report button will not generate the report and display it in this page for your benefit. Instead, a message indicating that the report is being processed in the background will appear. This will be accompanied by a link that will lead you to the page that lists all the reports that are being processed in the background, and their current status. If background report generation fails for a report, you can regenerate that report using this page, or can even delete that report if need be. On the other hand, if background processing successfully completes for your report, then, you can view a PDF of the report by clicking on the PDF icon in that page.
Note:
You can configure the ‘N’ in the Top <N> applications, by editing the eg_report.ini file (in the <eg_install_dir>\manager\config directory). In the [application_report] section of this file, set the Top parameter to a particular number as indicated below:
[CITRIX_APPLICATION_REPORT]
Top=10
In the example above, Top has been set to 10. This ensures that all ‘Top <N>’ hyperlinks in the Citrix Application Report page now read as “Top 10”. Moreover, clicking on the Top 10 hyperlink will list the top 10 applications in terms of utilization.
In order to configure additional information to be displayed in the report, you will have to edit the [application_report] section of the eg_report.ini file in the Edit the eg_report.ini file in the <EG_INSTALL_DIR>\manager\config directory. By default, the [APPLICATION_REPORT] section will contain the following specifications:
[APPLICATION_REPORT]
Citrix_MF_XP:CtxAppTest:Number_of_processes#No of Processes=Avg
Citrix_MF_XP:CtxAppTest:Cpu_util#Cpu util=Avg
Citrix_MF_XP:CtxAppTest:Memory_util#Memory util=Avg
Terminal:TermAppTest:Number_of_processes#No of Processes=Avg
Terminal:TermAppTest:Cpu_util#Cpu util=Avg
Terminal:TermAppTest:Memory_util#Memory util=Avg
Close scrutiny of the default specifications reveals the following format:
<InternalComponentType>:<InternalTest>:<InternalMeasure>#<Display name of Measure>=<Comma-separated list of functions to be executed on the value of the Measure>
Accordingly, in the first line of the default specification:
- Citrix_MF_XPis the <InternalComponentType>
- CtxAppTest is the <InternalTest>
- Number_of_processes is the <InternalMeasure>
-
No of Processes is the <Display name of Number_of_processes>
Note:
If a display name is not provided for a measure, then the actual measure name will automatically become the display name.
- Avg is the function that will be executed on the value of the Number_of_processes measure
To ascertain the internal component-type, test, and measure names, follow the procedure detailed in Page First, determine the Internal name of the test and measure to be configured. For that, do the following: of this manual. This indicates that by default, the Avg of the Number_of_processes, Cpu_util, and Mem_util measures of the CtxAppTest will be available in every 'Citrix' application report. Similarly, by default, the Avg of the Number_of_processes, Cpu_util, and Mem_util measures of the TermAppTest will be available in every 'Terminal server' application report.
Note:
The default measures mentioned above should not be removed from the [application_report]section. However, the following details pertaining to these default measures can be changed, if need be:
- The display name of the default measures
-
The functions to be executed on the default measure. For example, if you want the application report to display both the Avg and Max values of the Number_of_processes measure, the default specification can be changed as follows:
Citrix_MF_XP:CtxAppTest:Number_of_processes#No of Processes=Avg,Max
Besides, you can add more measure specifications in the format specified above. Before configuring more measures, determine the internal component type, test, and measure names using the procedure discussed in Page First, determine the Internal name of the test and measure to be configured. For that, do the following: of this manual. Note that a report can contain a maximum of 17 columns of data.
Note:
-
While generating any of the above-mentioned Citrix / VDI reports, you can make sure that specific descriptors are omitted from the Avg, Max, Min computations for the configured measures, by specifying the descriptor names in the following format in the [infos_to_be_omitted] section of the eg_report.ini file (in the <EG_INSTALL_DIR>\manager\config directory):
<InternalTest>:<InternalMeasure>=<Descriptor>
For example, to ensure that the Summary descriptor of SystemTest is excluded while calculating the average of Cpu_util, provide the following specification in the [INFOS_TO_BE_OMITTED] section:
[INFOS_TO_BE_OMITTED]
SystemTest:Cpu_util=Summary
- If the eG license disables the detailed diagnosis capability, or if the diagnosis frequencies are set to 0, then the following thin client reports cannot be generated: Application, User, and Session.