JVM Memory Usage Test
This test monitors every memory type on the JVM and reports how efficiently the JVM utilizes the memory resources of each type.
Note:
- This test works only on Windows platforms.
- This test can provide detailed diagnosis information for only those monitored Java applications that use JRE 1.6 or higher.
Target of the test : A Java application
Agent deploying the test : An internal/remote agent
Outputs of the test : One set of results for every memory type on the JVM being monitored.
| Parameter | Description |
|
Test period |
How often should the test be executed |
|
Host |
The host for which the test is to be configured. |
|
Port |
The port number at which the specified host listens to |
|
Metric Collection Type |
This test can extract metrics from Tomcat's JVM using one of the following mechanisms:
To configure the test to collect metrics from the eg_btm.jar file, select the JAR option. On the other hand, to configure the test to use SNMP or JMX options, choose the Others option. By default, JAR option is chosen here. |
|
Mode |
This flag will appear only when the Others option is chosen against the Metric Collection Type flag. To configure the test to use SNMP to extract metrics from the target Java application, select the SNMP option. On the other hand, choose the JMX option to configure the test to use JMX instead. By default, the JMX option is chosen here. |
|
JMX Remote Port |
This parameter appears only if the Metric Collection Type flag is set to JMX. Here, specify the port at which the jmx listens for requests from remote hosts. To know more, refer to Using JMX to Monitor the Tomcat Server/JVM |
|
JNDI Name |
This parameter appears only if the mode is set to JMX. The JNDIname is a lookup name for connecting to the JMX connector. By default, this is jmxrmi. If you have resgistered the JMX connector in the RMI registery using a different lookup name, then you can change this default value to reflect the same. |
|
JMX User, JMX Password, and Confirm password |
These parameters appear only if the Mode is set to JMX. If JMX requires authentication only (but no security), then ensure that the user and password parameters are configured with the credentials of a user with read-write access to JMX. To know how to create this user, refer to Using JMX to Monitor the Tomcat Server/JVM. Confirm the password by retyping it in the Confirm Password text box. |
|
Provider |
This parameter appears only if the Mode is set to JMX. This test uses a JMX Provider to access the MBean attributes of the target Java application and collect metrics. Specify the package name of this JMX Provider here. By default, this is set to com.sun.jmx.remote.protocol. |
|
JMX Registry SSL |
This parameter appears only if the Metric Collection Type flag is set to JMX. If you have registered the JMX connector in an SSL-enabled RMI registry , set this flag to Yes. By default, this is set to No. |
|
Timeout |
Specify the duration (in seconds) for which this test should wait for a response from the target Java application. If there is no response from the target beyond the configured duration, the test will timeout. By default, this is set to 240 seconds if the Mode is JMX, and 10 seconds if the Mode is SNMP. |
|
SNMPPort |
This parameter appears only if the Mode is set to SNMP. Here specify the port number through which the server exposes its SNMP MIB. Ensure that you specify the same port you configured in the management.properties file in the <JAVA_HOME>\jre\lib\management folder used by the target application. To know more, refer to Enabling SNMP Support for JRE |
|
SNMP Version |
This parameter appears only if the Mode is set to SNMP. The default selection in the SNMP version list is v1. However, for this test to work, you have to select SNMP v2 or v3 from this list, depending upon which version of SNMP is in use in the target environment. |
|
SNMP Community |
This parameter appears only if the Mode is set to SNMP. Here, specify the SNMP community name that the test uses to communicate with the mail server. The default is public. This parameter is specific to SNMP v1 and v2 only. Therefore, if the SNMP version chosen is v3, then this parameter will not appear. |
|
User Name |
This parameter appears only when v3 is selected as the SNMP version. SNMP version 3 (SNMPv3) is an extensible SNMP Framework which supplements the SNMPv2 Framework, by additionally supporting message security, access control, and remote SNMP configuration capabilities. To extract performance statistics from the MIB using the highly secure SNMP v3 protocol, the eG agent has to be configured with the required access privileges – in other words, the eG agent should connect to the MIB using the credentials of a user with access permissions to be MIB. Therefore, specify the name of such a user against this parameter. |
|
Authpass |
Specify the password that corresponds to the above-mentioned user name. This parameter once again appears only if the snmpversion selected is v3. |
|
Confirm password |
Confirm the Authpass by retyping it here |
|
Authtype |
This parameter too appears only if v3 is selected as the SNMPversion. From the AuthType list box, choose the authentication algorithm using which SNMP v3 converts the specified username and password into a 32-bit format to ensure security of SNMP transactions. You can choose between the following options:
|
|
Encryptflag |
This flag appears only when v3 is selected as the SNMPVersion. By default, the eG agent does not encrypt SNMP requests. Accordingly, the flag is set to No by default. To ensure that SNMP requests sent by the eG agent are encrypted, select the Yes option. |
|
EncryptType |
If the EncryptFlag is set to Yes, then you will have to mention the encryption type by selecting an option from the EncryptType list. SNMP v3 supports the following encryption types:
|
|
Encrypt Password |
Specify the Encryption Password here. |
|
Confirm Password |
Confirm the Encryption Password by retyping it here. |
|
Data over TCP |
This parameter is applicable only if mode is set to SNMP. By default, in an IT environment, all data transmission occurs over UDP. Some environments however, may be specifically configured to offload a fraction of the data traffic – for instance, certain types of data traffic or traffic pertaining to specific components – to other protocols like TCP, so as to prevent UDP overloads. In such environments, you can instruct the eG agent to conduct the SNMP data traffic related to the monitored target over TCP (and not UDP). For this, set this flag to Yes. By default, this flag is set to No. |
|
Use Sudo |
By default, the Use SUDO parameter is set to No. This indicates that, by default, this test will report detailed metrics by executing the JDK command, jmap, directly on the target Tomcat JVM. However, in some highly secure environments, this command cannot be executed directly on a Linux JVM. In such cases, do the following:
|
|
Heap Analysis |
By default, this flag is set to off. This implies that the test will not provide detailed diagnosis information for memory usage, by default. To trigger the collection of detailed measures, set this flag to On. Note:
|
|
Exclude Packages |
The detailed diagnosis of this test, if enabled, lists the Java classes/packages that are using the pool memory and the amount of memory used by each class/package. To enable administrators to focus on the memory consumed by those classes/packages that are specific to their application, without being distracted by the memory consumption of basic Java classes/packages, the test, by default, excludes some common Java packages from the detailed diagnosis. The packages excluded by default are as follows:
This is why, the Exclude Packages parameter is by default configured with the packages mentioned above. You can, if required, append more packages or patterns of packages to this comma-separated list. This will ensure that such packages also are excluded from the detailed diagnosis of the test. Note that the exclude packages parameter is of relevance only if the Heap Analysis flag is set to 'Yes'. |
|
Include Packages |
By default, this is set to all. This indicates that, by default, the detailed diagnosis of the test (if enabled) includes all classes/packages associated with the monitored Java application, regardless of whether they are basic Java packages or those that are crucial to the functioning of the application. However, if you want the detailed diagnosis to provide the details of memory consumed by a specific set of classes/packages alone, then, provide a comma-separated list of classes/packages to be included in the detailed diagnosis in the include packages text box. Note that the include packages parameter is of relevance only if the Heap Analysis flag is set to 'Yes'. |
|
Java Home |
This parameter appears only when the Heap Analysis flag is switched On. Here, provide the full path to the install directory of JDK 1.6 or higher on the application host. For example, c:\JDK1.6.0. |
|
Engine ID |
This parameter appears only when v3 is selected as the SNMPVersion. Sometimes, the test may not report metrics when AES192 or AES256 is chosen as the Encryption type. To ensure that the test report metrics consistently, administrators need to set this flag to Yes. By default, this parameter is set to No. |
|
DD Frequency |
Refers to the frequency with which detailed diagnosis measures are to be generated for this test. The default is 1:1. This indicates that, by default, detailed measures will be generated every time this test runs, and also every time the test detects a problem. You can modify this frequency, if you so desire. Also, if you intend to disable the detailed diagnosis capability for this test, you can do so by specifying none against this parameter. |
|
Detailed Diagnosis |
To make diagnosis more efficient and accurate, the eG Enterprise embeds an optional detailed diagnostic capability. With this capability, the eG agents can be configured to run detailed, more elaborate tests as and when specific problems are detected. To enable the detailed diagnosis capability of this test for a particular server, choose the On option. To disable the capability, click on the Off option. The option to selectively enable/disable the detailed diagnosis capability will be available only if the following conditions are fulfilled:
|
| Measurement | Description | Measurement Unit | Interpretation |
|---|---|---|---|
|
Initial memory |
Indicates the amount of memory initially allocated at startup. |
MB |
|
|
Used memory |
Indicates the amount of memory currently used. |
MB |
It includes the memory occupied by all objects, including both reachable and unreachable objects. Ideally, the value of this measure should be low. A high value or a consistent increase in the value could indicate gradual erosion of memory resources. In such a situation, you can take the help of the detailed diagnosis of this measure (if enabled), to figure out which class is using up memory excessively. |
|
Available memory |
Indicates the amount of memory guaranteed to be available for use by the JVM. |
MB |
The amount of Available memory may change over time. The Java virtual machine may release memory to the system and committed memory could be less than the amount of memory initially allocated at startup. Committed will always be greater than or equal to used memory. |
|
Free memory |
Indicates the amount of memory currently available for use by the JVM. |
MB |
This is the difference between Available memory and Used memory. Ideally, the value of this measure should be high. |
|
Max free memory |
Indicates the maximum amount of memory allocated for the JVM. |
MB |
|
|
Used percentage |
Indicates the percentage of used memory. |
Percent |
Ideally, the value of this measure should be low. A very high value of this measure could indicate excessive memory consumption by the JVM, which in turn, could warrant further investigation. In such a situation, you can take the help of the detailed diagnosis of this measure (if enabled), to figure out which class is using up memory excessively. |
The detailed diagnosis of the Used memory measure, if enabled, lists all the classes that are using the pool memory, the amount and percentage of memory used by each class, the number of instances of each class that is currently operational, and also the percentage of currently running instances of each class. Since this list is by default sorted in the descending order of the percentage memory usage, the first class in the list will obviously be the leading memory consumer.
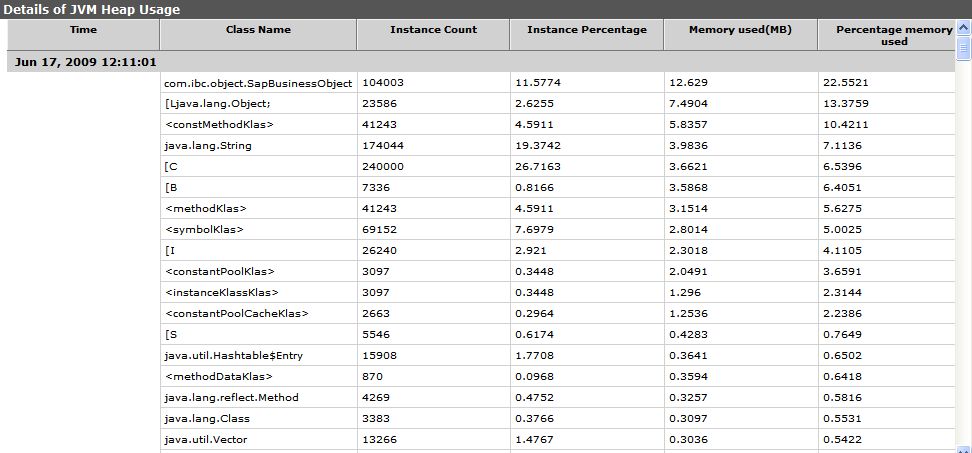
Figure 1 : The detailed diagnosis of the Used memory measure