
App Volume Details - OS Test
In some virtual desktop infrastructures, hosting of applications is performed using VMware App Volumes to remove, update, or install applications for users in real time. A VMware App Volume is a real-time application delivery system that enterprises can use to dynamically deliver and manage applications. Applications are bundled in AppStacks and delivered by attaching a standard VMDK file to a virtual desktop. The Appstacks are provisioned to the target VDI server using App Volumes Manager (Web-based interface) that is integrated with Active Directory (AD) and vSphere. The App Volumes Manager centrally manages the applications, Appstacks and App Volumes. The 24x7 availability of the App Volumes Manager is imperative to ensure that users have uninterrupted access to the AppStacks that are attached when a user logs in to the target VDI server. If the App Volumes Manager is inaccessible or an AppStack is not attached on time or not attached properly, then, the user experience in accessing the AppStack may seriously suffer. This in turn can impact the productivity of the users and overall user experience with the VDI server. To avoid such inconveniences, it is important for the administrators to continuously monitor the availability of App Volumes Manager and Appstacks attachment to the VDI server. This can be easily achieved using the App Volume Details - OS test.
This test instantly reveals the inaccessibility of the App Volumes Manager which helps administrators to quickly resolve the issue and restore the availability of the App Volumes Manager before the users complain. In the process, this test also reports whether/not all the Appstacks are attached to the VDI server. This way, the test informs administrators of non-attachment of Appstacks (if any). In addition, this test reports the number of Appstacks attached, the applications attached with the Appstacks and the time taken for attaching the Appstacks. By analyzing these measures, administrators can figure out if the Appstacks attachment took longer time than expected, and if it took too long, initiate remedial measures to fix the same.
Note:
This test will report the measures only if the applications are provisioned to the target VDI server through VMware App Volumes Manager.
This test is disabled by default. To enable the test, go to the enable / disable tests page using the menu sequence : Agents -> Tests -> Enable/Disable, pick the desired Component type, set Performance as the Test type, choose the test from the disabled tests list, and click on the < button to move the test to the ENABLED TESTS list. Finally, click the Update button.
Target of the test : An ESX server host
Agent deploying the test: An internal/remote agent
Outputs of the test : One set of results for the target virtual server that is being monitored.
| Parameter | Description |
|---|---|
|
Testperiod |
How often should the test be executed. |
|
Host |
The host for which the test is to be configured |
|
Port |
The port at which the host listens. By default, this is NULL. |
|
ESX user and ESX password |
In order to enable the test to extract the desired metrics from a target ESX server, you need to configure the test with an ESX USER and ESX PASSWORD. The user credentials to be passed here depend upon the mechanism used by the eG agent for discovering the VMs on the target ESX server and collecting performance statistics from it. These monitoring/discovery methodologies and their corresponding configuration requirements have been discussed hereunder:
VM discovery using the vCenter in the target environment: By default, the eG agent connects to each ESX server and discovers the VMs executing on it. While this approach scales well, it requires additional configuration for each server being monitored. For example, separate user accounts may need to be created on each server for read-only access to VM details. While monitoring large virtualized installations however, the agents can be optionally configured to perform guest discovery using the VM information already available in vCenter. In this case therefore, the ESX USER and ESX PASSWORD that you specify should be that of an Administrator or Virtual Machine Administrator in vCenter. However, if, owing to security constraints, you prefer not to use the credentials of such users, then, you can create a special role on vCenter with ‘Read-only’ privileges. Refer to Assigning the ‘Read-Only’ Role to a Local/Domain User to vCenter to know how to create a user on vCenter. If the ESX server for which this test is being configured had been discovered via vCenter, then the eG manager automatically populates the esx user and esx password text boxes with the vCenter user credentials using which the ESX discovery was performed. Like ESX servers, vCenter servers too terminate user sessions based on timeout periods. The default timeout period is 30 mins. When you stop an agent, sessions currently in use by the agent will remain open for this timeout period until vCenter times out the session. If the agent is restarted within the timeout period, it will open a new set of sessions. If you want the eG agent to close already existing sessions before it opens new sessions, then you would have to configure all the tests with the credentials of a vCenter user with permissions to View and Terminate Sessions (from vCenter 4.1, this is called the View and stop sessions permission). To know how to grant this permission to a user to vCenter, refer to Creating a Special Role on vCenter and Assigning the Role to a New User. When the eG agent is started/restarted, it first attempts to connect to the vCenter server and terminate all existing sessions for the user whose credentials have been provided for the tests. This is done to ensure that unnecessary sessions do not remain established in the vCenter server for the session timeout period. Ideally, you should create a separate user account with the required credentials and use this for the test configurations. If you provide the credentials for an existing user for the test configuration, when the eG agent starts/restarts, it will close all existing sessions for this user (including sessions you may have opened using the Virtual Infrastructure client). Hence, in this case, you may notice that your VI client sessions are terminated when the eG agent starts/restarts. |
|
Confirm password |
Confirm the password by retyping it here. |
|
SSL |
By default, the ESX server is SSL-enabled. Accordingly, the SSL flag is set to Yes by default. This indicates that the eG agent will communicate with the ESX server via HTTPS by default. On the other hand, if the eG agent has been configured to use the VMPerl API or CLI for monitoring (i.e., if the ESX USER parameter is set to none), then the status of the SSL flag is irrelevant. Like the ESX sever, the vCenter is also SSL-enabled by default. If you have chosen to use the vCenter for monitoring all the ESX servers in your environment, then you have to set the SSL flag to Yes. |
|
Webport |
By default, in most virtualized environments, the ESX server and vCenter listen on port 80 (if not SSL-enabled) or on port 443 (if SSL-enabled). This implies that while monitoring an SSL-enabled ESX server directly, the eG agent, by default, connects to port 443 of the ESX server to pull out metrics, and while monitoring a non-SSL-enabled ESX server, the eG agent connects to port 80. Similarly, while monitoring an ESX server via an SSL-enabled vCenter, the eG agent connects to port 443 of vCenter to pull out the metrics, and while monitoring via a non-SSL-enabled vCenter, the eG agent connects to port 80 of vCenter. Accordingly, the WEBPORT parameter is set to 80 or 443 depending upon the status of the SSL flag. In some environments however, the default ports 80 or 443 might not apply. In such a case, against the WEBPORT parameter, you can specify the exact port at which the ESX server or vCenter in your environment listens so that the eG agent communicates with that port. |
|
Virtual Center |
If the eG manager had discovered the target ESX server by connecting to vCenter, then the IP address of the vCenter server used for discovering this ESX server would be automatically displayed against the VIRTUAL CENTER parameter; similarly, the ESX USER and ESX PASSWORD text boxes will be automatically populated with the vCenter user credentials, using which ESX discovery was performed. If this ESX server has not been discovered using vCenter, but you still want to discover the guests on the ESX server via vCenter, then select the IP address of the vCenter host that you wish to use for guest discovery from the VIRTUAL CENTER list. By default, this list is populated with the IP address of all vCenter hosts that were added to the eG Enterprise system at the time of discovery. Upon selection, the ESX USERand ESX PASSWORD that were pre-configured for that vCenter server will be automatically displayed against the respective text boxes. On the other hand, if the IP address of the vCenter server of interest to you is not available in the list, then, you can add the details of the vCenter server on-the-fly, by selecting the Other option from the VIRTUAL CENTER list. This will invoke the ADD VCENTER SERVER DETAILS page. Refer to Adding the Details of a vCenter Server for VM Discovery On the other hand, if you want the eG agent to behave in the default manner -i.e., communicate with each ESX server for monitoring and VM information - then set the VIRTUAL CENTER parameter to ‘none’. |
|
Exclude VMs |
Administrators of some virtualized environments may not want to monitor some of their less-critical VMs - for instance, VM templates - both from ‘outside’ and from ‘inside’. The eG agent in this case can be configured to completely exclude such VMs from its monitoring purview. To achieve this, provide a comma-separated list of VMs to be excluded from monitoring in the Exclude VMs text box. Instead of VMs, VM name patterns can also be provided here in a comma-separated list. For example, your exclude vms specification can be: *xp,*lin*,win*,vista. Here, the * (asterisk) is used to denote leading and trailing spaces (as the case may be). By default, this parameter is set to none indicating that the eG agent obtains the inside and outside views of all VMs on a virtual host by default. By providing a comma-separated list of VMs/VM name patterns in the Exclude VMs text box, you can make sure the eG agent stops collecting ‘inside’ and ‘outside’ view metrics for a configured set of VMs. |
|
Ignore VMs inside view |
Administrators of some high security VMware environments might not have permissions to internally monitor one/more VMs. The eG agent can be configured to not obtain the ‘inside view’ of such ‘inaccessible’ VMs using the Ignore VMs inside view parameter. Against this parameter, you can provide a comma-separated list of VM names, or VM name patterns, for which the inside view need not be obtained. For instance, your ignore vms inside view specification can be: *xp,*lin*,win*,vista. Here, the * (asterisk) is used to denote leading and trailing spaces (as the case may be). By default, this parameter is set to none indicating that the eG agent obtains the inside view of all VMs on an ESX host by default. Note: While performing VM discovery, the eG agent will not discover the operating system of the VMs configured in the Ignore VMs inside view text box. |
|
Ignore winnt |
By default, the eG agent does not support the inside view for VMs executing on Windows NT operating systems. Accordingly, the ignore winnt flag is set to Yes by default. |
|
Inside view using |
By default, this test obtains the “inside view” of VMs using the eG VM Agent. Accordingly, the Inside view using flag is set to eG VM Agent by default. The eG VM Agent is a piece of software, which should be installed on every VM on a hypervisor. Every time the eG agent runs this test, it uses the eG VM Agent to pull relevant 'inside view' metrics from each VM. Once the metrics are collected, the eG agent then communicates with each VM agent and pulls these metrics, without requiring administrator privileges. Refer to Configuring the Remote Agent to Obtain the Inside View of VMs for more details on the eG VM Agent. |
|
Domain, Admin User, and Admin Password, and Confirm Password |
By default, these parameters are set to none. This is because, by default, the eG agent collects 'inside view' metrics using the eG VM agent on each VM. Domain administrator privileges need not be granted to the eG agent if it uses this default approach to obtain the 'inside view' of Windows VMs. |
|
Report by User |
This flag is set to Yes by default. The value of this flag cannot be changed. This implies that the virtual machines in VDI environments will always be identified using the login name of the user. In other words, in VDI environments, this test will, by default, report measures for every username_on_virtualmachinename |
|
Report Powered OS |
This flag becomes relevant only if the report by user flag is set to ‘Yes’. If the report powered os flag is set to Yes (which is the default setting), then this test will report measures for even those VMs that do not have any users logged in currently. Such guests will be identified by their virtualmachine name and not by the username_on_virtualmachinename. On the other hand, if the report powered os flag is set to No, then this test will not report measures for those VMs to which no users are logged in currently. |
|
DD Frequency |
Refers to the frequency with which detailed diagnosis measures are to be generated for this test. The default is 1:1. This indicates that, by default, detailed measures will be generated every time this test runs, and also every time the test detects a problem. You can modify this frequency, if you so desire. Also, if you intend to disable the detailed diagnosis capability for this test, you can do so by specifying none against DD FREQUENCY. |
|
Detailed Diagnosis |
To make diagnosis more efficient and accurate, the eG suite embeds an optional detailed diagnostic capability. With this capability, the eG agents can be configured to run detailed, more elaborate tests as and when specific problems are detected. To enable the detailed diagnosis capability of this test for a particular server, choose the On option. To disable the capability, click on the Off option. The option to selectively enable/disable the detailed diagnosis capability will be available only if the following conditions are fulfilled:
|
|
|
|
| Measurement | Description | Measurement Unit | Interpretation | ||||||
|---|---|---|---|---|---|---|---|---|---|
|
Is App Volume manager accessible? |
Indicates whether the App Volumes Manager is currently accessible or not. |
|
The values reported by this measure and its numeric equivalents are mentioned in the table below:
Note: By default, this measure reports the Measure Values listed in the table above to indicate the current accessibility status of the App Volumes Manager. The graph of this measure however, is represented using the numeric equivalents only. The detailed diagnosis of this measure reveals the details of the Apps Volume Manager. |
||||||
|
Total AppStacks attached |
Indicates the total number of AppStacks attached to the VDI server. |
Number |
Appstack is a read-only volume containing one or more Windows applications. Once provisioned, an individual AppStack or multiple AppStacks can be mapped to a user, a group of users, or computers at login, or in real-time and to computers only at the time of startup. The detailed diagnosis of this measure displays the details of the Appstacks attached to the App Volumes Manager. |
||||||
|
Total applications attached in AppStacks |
Indicates the total number of applications attached in the AppStacks that have been attached to the target VDI server. |
|
The detailed diagnosis of this measure displays the details of the applications bundled in the Appstacks. |
||||||
|
Are all AppStacks attached? |
Indicates whether/not all the appstacks are attached to the target VDI server. |
|
The values reported by this measure and its numeric equivalents are mentioned in the table below:
Note: By default, this measure reports the Measure Values listed in the table above to indicate whether all Appstacks are attached to the App Volumes Manager or not. The graph of this measure however, is represented using the numeric equivalents only. |
||||||
|
Is Writable Volume available? |
Indicates whether/not a writable App Volume is attached to the target VDI server. |
|
The values reported by this measure and its numeric equivalents are mentioned in the table below:
Note: By default, this measure reports the Measure Values listed in the table above to indicate the availability of the writable App Volume attached to the VDI server. The graph of this measure however, is represented using the numeric equivalents only. |
||||||
|
Total App Volumes attached |
Indicates the total number of App Volumes attached to the target VDI server. |
Number |
The detailed diagnosis of this measure reveals the name of the AppStack and application, the version of the application and the name of the application publisher. |
||||||
|
Total App Volumes attached duration |
Indicates the time taken for attaching the App Volumes to the target VDI server. |
Seconds |
The detailed diagnosis of this measure reveals the details of the App Volumes attached to target VDI server. |
The detailed diagnosis capability of the Is App Volume manager accessible? measure, reveals the IP address detail of the Apps Volume Manager.

Figure 1 : The detailed diagnosis of the Is App Volume manager accessible? measure
The detailed diagnosis capability of the Total AppStacks attached measure, reveals the IP address detail of the Apps Volume Manager.

Figure 2 : The detailed diagnosis of the Total AppStacks attached measure
The detailed diagnosis capability of the Total applications attached in AppStacks measure, reveals the name of the Appstack to which the applications are bundled with, name and version of the applications, and the name of the application publishers.
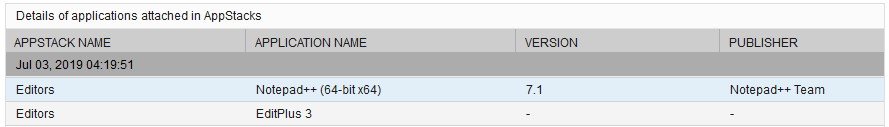
Figure 3 : The detailed diagnosis of the Total applications attached in AppStacks measure
The detailed diagnosis of the Total App Volumes attached duration measure, displays the time taken during at which each App Volume was attached.
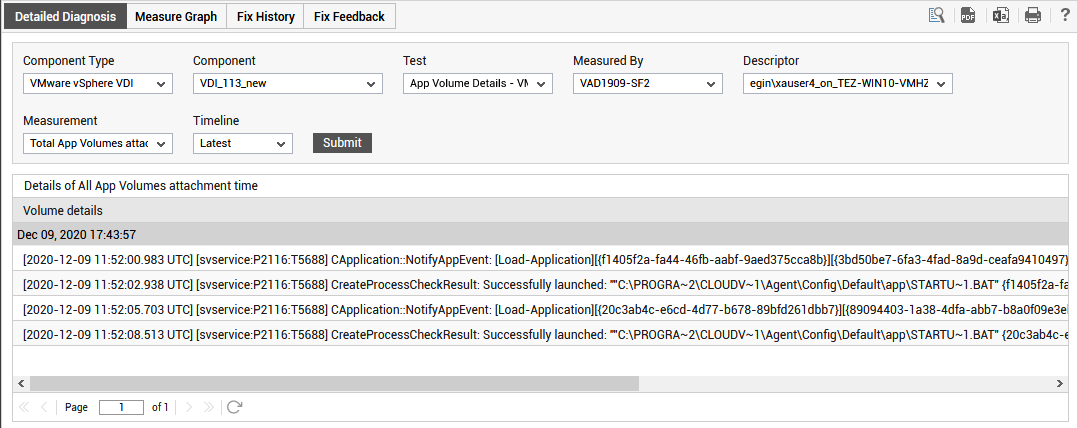
Figure 4 : The detailed diagnosis of theTotal App Volumes attached duration measure
