
Browser Activity – OS Test
When a user complains of a virtual desktop slowdown, administrators will have to instantly figure out if that VM is experiencing a resource crunch, and if so, which process/application on the desktop is contributing to it. One of the common reasons for CPU/memory contentions and handle leaks on a virtual desktop is web browsing! If a user to a virtual desktop browses resource-intensive web sites, it is bound to result in over-usage of the resources allocated to that VM, which in turn degrades the performance of not just that VM but even the other VMs on that host. While the System Details – OS test can lead administrators to the exact browser application that is consuming the CPU/memory resources of the VM excessively, it does not provide visibility into the precise websites that were been browsed when the resource contention occurred. This is where the Browser Activity – OS test helps. For each web browser that is being accessed by a user per virtual desktop, this test reports how every browser uses the allocated CPU, memory, and disk resources and reveals the number and URLs of the web sites that are being accessed using each browser. This way, the test not only points administrators to resource-hungry browsers, but also indicates which web sites were being accessed using that browser.
Note:
- This test will report metrics only if the Windows VM being monitored uses the .Net framework v3.0 (or above).
- This test will not be able to monitor the Microsoft Edge browser on Windows 10 VMs.
Target of the test : An ESX server host
Agent deploying the test : A remote agent
Outputs of the test : One set of results for every user to each Windows virtual desktop on the vSphere/ESX server being monitored.
| Parameter | Description |
|---|---|
|
Testperiod |
How often should the test be executed. |
|
Host |
The host for which the test is to be configured |
|
Port |
The port at which the HOSTlistens. By default, this is NULL. |
|
ESX user and ESX password |
In order to enable the test to extract the desired metrics from a target ESX server, you need to configure the test with an ESX USER and ESX PASSWORD. The user credentials to be passed here depend upon the mechanism used by the eG agent for discovering the VMs on the target ESX server and collecting performance statistics from it. These monitoring/discovery methodologies and their corresponding configuration requirements have been discussed hereunder:
VM discovery using the vCenter in the target environment: By default, the eG agent connects to each ESX server and discovers the VMs executing on it. While this approach scales well, it requires additional configuration for each server being monitored. For example, separate user accounts may need to be created on each server for read-only access to VM details. While monitoring large virtualized installations however, the agents can be optionally configured to perform guest discovery using the VM information already available in vCenter. In this case therefore, the ESX USER and ESX PASSWORD that you specify should be that of an Administrator or Virtual Machine Administrator in vCenter. However, if, owing to security constraints, you prefer not to use the credentials of such users, then, you can create a special role on vCenter with ‘Read-only’ privileges. Refer to Assigning the ‘Read-Only’ Role to a Local/Domain User to vCenter to know how to create a user on vCenter. If the ESX server for which this test is being configured had been discovered via vCenter, then the eG manager automatically populates the ESX USER and ESX PASSWORD text boxes with the vCenter user credentials using which the ESX discovery was performed. Like ESX servers, vCenter servers too terminate user sessions based on timeout periods. The default timeout period is 30 mins. When you stop an agent, sessions currently in use by the agent will remain open for this timeout period until vCenter times out the session. If the agent is restarted within the timeout period, it will open a new set of sessions. If you want the eG agent to close already existing sessions before it opens new sessions, then you would have to configure all the tests with the credentials of a vCenter user with permissions to View and Terminate Sessions (from vCenter 4.1, this is called the View and stop sessions permission). To know how to grant this permission to a user to vCenter, refer to Creating a Special Role on vCenter and Assigning the Role to a New User. When the eG agent is started/restarted, it first attempts to connect to the vCenter server and terminate all existing sessions for the user whose credentials have been provided for the tests. This is done to ensure that unnecessary sessions do not remain established in the vCenter server for the session timeout period. Ideally, you should create a separate user account with the required credentials and use this for the test configurations. If you provide the credentials for an existing user for the test configuration, when the eG agent starts/restarts, it will close all existing sessions for this user (including sessions you may have opened using the Virtual Infrastructure client). Hence, in this case, you may notice that your VI client sessions are terminated when the eG agent starts/restarts. |
|
Confirm password |
Confirm the password by retyping it here. |
|
SSL |
By default, the ESX server is SSL-enabled. Accordingly, the SSL flag is set to Yes by default. This indicates that the eG agent will communicate with the ESX server via HTTPS by default. On the other hand, if the eG agent has been configured to use the VMPerl API or CLI for monitoring (i.e., if the ESX USER parameter is set to none), then the status of the SSL flag is irrelevant. Like the ESX sever, the vCenter is also SSL-enabled by default. If you have chosen to use the vCenter for monitoring all the ESX servers in your environment, then you have to set the SSL flag to Yes. |
|
Webport |
By default, in most virtualized environments, the ESX server and vCenter listen on port 80 (if not SSL-enabled) or on port 443 (if SSL-enabled). This implies that while monitoring an SSL-enabled ESX server directly, the eG agent, by default, connects to port 443 of the ESX server to pull out metrics, and while monitoring a non-SSL-enabled ESX server, the eG agent connects to port 80. Similarly, while monitoring an ESX server via an SSL-enabled vCenter, the eG agent connects to port 443 of vCenter to pull out the metrics, and while monitoring via a non-SSL-enabled vCenter, the eG agent connects to port 80 of vCenter. Accordingly, the WEBPORT parameter is set to 80 or 443 depending upon the status of the ssl flag. In some environments however, the default ports 80 or 443 might not apply. In such a case, against the WEBPORT parameter, you can specify the exact port at which the ESX server or vCenter in your environment listens so that the eG agent communicates with that port. |
|
Virtual Center |
If the eG manager had discovered the target ESX server by connecting to vCenter, then the IP address of the vCenter server used for discovering this ESX server would be automatically displayed against the VIRTUAL CENTER parameter; similarly, the ESX USER and ESX PASSWORD text boxes will be automatically populated with the vCenter user credentials, using which ESX discovery was performed. If this ESX server has not been discovered using vCenter, but you still want to discover the guests on the ESX server via vCenter, then select the IP address of the vCenter host that you wish to use for guest discovery from the VIRTUAL CENTER list. By default, this list is populated with the IP address of all vCenter hosts that were added to the eG Enterprise system at the time of discovery. Upon selection, the ESX USERand ESX PASSWORD that were pre-configured for that vCenter server will be automatically displayed against the respective text boxes. On the other hand, if the IP address of the vCenter server of interest to you is not available in the list, then, you can add the details of the vCenter server on-the-fly, by selecting the Other option from the VIRTUAL CENTER list. This will invoke the ADD VCENTER SERVER DETAILS page. Refer to Adding the Details of a vCenter Server for VM Discovery On the other hand, if you want the eG agent to behave in the default manner -i.e., communicate with each ESX server for monitoring and VM information - then set the VIRTUAL CENTER parameter to ‘none’. |
|
Exclude VMs |
Administrators of some virtualized environments may not want to monitor some of their less-critical VMs - for instance, VM templates - both from ‘outside’ and from ‘inside’. The eG agent in this case can be configured to completely exclude such VMs from its monitoring purview. To achieve this, provide a comma-separated list of VMs to be excluded from monitoring in the Exclude VMs text box. Instead of VMs, VM name patterns can also be provided here in a comma-separated list. For example, your exclude vms specification can be: *xp,*lin*,win*,vista. Here, the * (asterisk) is used to denote leading and trailing spaces (as the case may be). By default, this parameter is set to none indicating that the eG agent obtains the inside and outside views of all VMs on a virtual host by default. By providing a comma-separated list of VMs/VM name patterns in the Exclude VMs text box, you can make sure the eG agent stops collecting ‘inside’ and ‘outside’ view metrics for a configured set of VMs. |
|
Ignore VMs inside view |
Administrators of some high security VMware environments might not have permissions to internally monitor one/more VMs. The eG agent can be configured to not obtain the ‘inside view’ of such ‘inaccessible’ VMs using the Ignore VMs inside view parameter. Against this parameter, you can provide a comma-separated list of VM names, or VM name patterns, for which the inside view need not be obtained. For instance, your ignore vms inside view specification can be: *xp,*lin*,win*,vista. Here, the * (asterisk) is used to denote leading and trailing spaces (as the case may be). By default, this parameter is set to none indicating that the eG agent obtains the inside view of all VMs on an ESX host by default. Note: While performing VM discovery, the eG agent will not discover the operating system of the VMs configured in the Ignore VMs inside view text box. |
|
Ignore winnt |
By default, the eG agent does not support the inside view for VMs executing on Windows NT operating systems. Accordingly, the ignore winnt flag is set to Yes by default. |
|
Inside view using |
By default, this test obtains the “inside view” of VMs using the eG VM Agent. Accordingly, the Inside view using flag is set to eG VM Agent by default. The eG VM Agent is a piece of software, which should be installed on every VM on a hypervisor. Every time the eG agent runs this test, it uses the eG VM Agent to pull relevant 'inside view' metrics from each VM. Once the metrics are collected, the eG agent then communicates with each VM agent and pulls these metrics, without requiring administrator privileges. Refer to Configuring the Remote Agent to Obtain the Inside View of VMs for more details on the eG VM Agent. |
|
Domain, Admin User, and Admin Password, and Confirm Password |
By default, these parameters are set to none. This is because, by default, the eG agent collects 'inside view' metrics using the eG VM agent on each VM. Domain administrator privileges need not be granted to the eG agent if it uses this default approach to obtain the 'inside view' of Windows VMs. |
|
Report by User |
This flag is set to Yes by default. The value of this flag cannot be changed. This implies that the virtual machines in VDI environments will always be identified using the login name of the user. In other words, in VDI environments, this test will, by default, report measures for every username_on_virtualmachinename |
|
Show Recent Websites DD |
Typically, the detailed diagnosis of the Recent websites measure, if enabled, reveals the URL that is open in each browser tab of a virtual desktop. In large VDI environments supporting hundreds of virtual desktops and users, collecting and storing the details of every browser tab that a user opens can increase the strain on the eG database. To avoid this, by default, this test does not collect detailed diagnostics for the Recent websites measure. Accordingly, the SHOW RECENT WEBSITES DD is set to No by default. You can turn this flag on if you want, by selecting the Yes option. If this is done, then this test will collect detailed metrics for the Recent websites measure. |
|
DD Frequency |
Refers to the frequency with which detailed diagnosis measures are to be generated for this test. The default is 1:1. This indicates that, by default, detailed measures will be generated every time this test runs, and also every time the test detects a problem. You can modify this frequency, if you so desire. Also, if you intend to disable the detailed diagnosis capability for this test, you can do so by specifying none against DD FREQUENCY. |
|
Detailed Diagnosis |
|
|
|
|
| Measurement | Description | Measurement Unit | Interpretation |
|---|---|---|---|
|
Running browser instances: |
Indicates the number of instances of this browser currently running on this virtual desktop. |
Number |
Use the detailed diagnosis of this measure to know how much resources were utilized by each instance of a browser, so that the resource-hungry instance can be isolated. |
|
Recent web sites: |
Indicates the number of websites that were accessed using this browser on this virtual desktop during the last measurement period. |
Number |
Use the detailed diagnosis of this measure to know which web sites are being accessed using a browser. |
|
CPU utilization: |
Indicates the percentage CPU usage of this browser on this virtual desktop. |
Percent |
Compare the value of this measure across browsers to know which browser consumed the maximum CPU on a desktop. If the value of this measure is close to 100% on that desktop, it indicates excessive CPU usage by the browser. You may then want to use the detailed diagnosis of the Recent web sites measure to know which web sites are being accessed using that browser, which caused CPU usage to soar. |
|
Memory used: |
Indicates the percent usage of memory by this browser on this virtual desktop. |
Percent |
Compare the value of this measure across browsers to know which browser consumed the maximum memory on a desktop. If the value of this measure is close to 100% on that desktop, it indicates excessive memory usage by the browser. You may then want to use the detailed diagnosis of the Recent web sites measure to know which web sites are being accessed using that browser, which caused CPU usage to soar. |
|
Handles used: |
Indicates the number of handles opened by this browser on this virtual desktop. |
Number |
Compare the value of this measure across browsers to know which browser opened the maximum number of handles on a desktop. If the value of this measure consistently increases on that desktop, it indicates that the corresponding browser is leaking memory. You may then want to use the detailed diagnosis of the Recent web sites measure to know which web sites are being accessed using that browser, which caused the memory leak. |
|
Disk reads: |
Indicates the rate at which this browser read from the disks supported by this virtual desktop. |
KB/Sec |
A high value for these measures indicates that the browser is generating high disk I/O. You may then want to use the detailed diagnosis of the Recent web sites measure of this browser to know which web sites on the browser are responsible for the high disk I/O. |
|
Disk writes: |
Indicates the rate at which this browser read from the disks of this virtual desktop. |
KB/Sec |
|
|
Disk IOPS: |
Indicates the rate of read and write operations performed by this browser on the disks of this virtual desktop. |
Operations/Sec |
A high value for this measure indicates that the browser is generating high disk I/O. You may then want to use the detailed diagnosis of the Recent web sites measure of this browser to know which web sites on the browser are responsible for the high disk I/O. |
|
Page faults: |
Indicates the rate at which page faults by the threads executing in this browser are occurring on this virtual desktop. |
Faults/Sec |
Ideally, the value of this measure should be low. A high value for a browser is a cause for concern. You may then want to use the detailed diagnosis of the Recent web sites measure of this browser to know which web sites on the browser are responsible for page faults. |
The detailed diagnosis of the Running browser instances measure reveals the process ID of each browser instance that is currently running on the virtual desktop and the resource usage of each instance. This way, you can easily and accurately identify the instance that is consuming resources excessively.
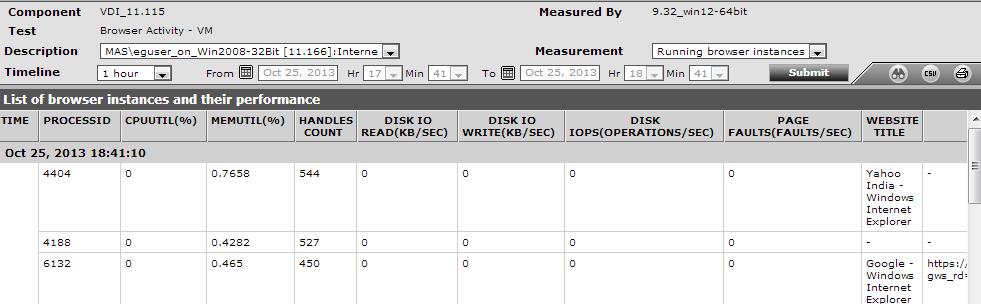
Figure 1 : The detailed diagnosis of the Running browser instances measure
The detailed diagnosis of the Recent web sites measure reveals the names and URLs of the web sites that are being accessed using a browser.
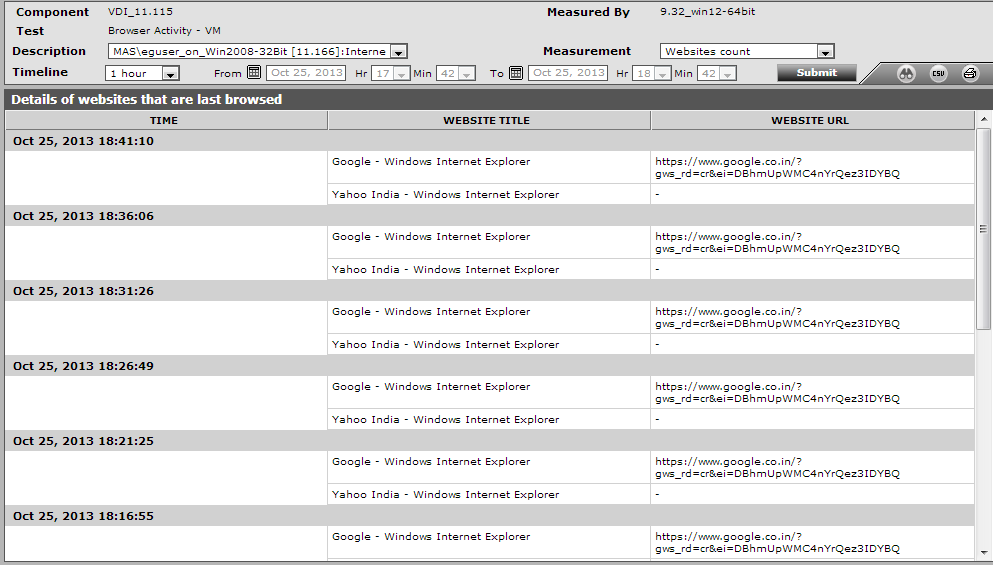
Figure 2 : The detailed diagnosis of the Recent web sites measure
