Datastores - ESX Test
This test monitors the space usage of VMFS partitions on a vSphere/ESXi server host.
Target of the test : An ESX server host
Agent deploying the test : An internal/remote agent
Outputs of the test : One set of results for every VMFS partition/datastore supported by the ESX server host that is monitored
| Parameter | Description |
|---|---|
|
Test Period |
How often should the test be executed |
|
Host |
The host for which the test is to be configured |
|
Port |
The port at which the HOSTlistens. By default, this is NULL. |
|
ESX user and ESX password |
In order to enable the test to extract the desired metrics from a target ESX server, you need to configure the test with an ESX USER and ESX PASSWORD. The user credentials to be passed here depend upon the mechanism used by the eG agent for discovering the VMs on the target ESX server and collecting performance statistics from it. These monitoring/discovery methodologies and their corresponding configuration requirements have been discussed hereunder:
VM discovery using the vCenter in the target environment: By default, the eG agent connects to each ESX server and discovers the VMs executing on it. While this approach scales well, it requires additional configuration for each server being monitored. For example, separate user accounts may need to be created on each server for read-only access to VM details. While monitoring large virtualized installations however, the agents can be optionally configured to perform guest discovery using the VM information already available in vCenter. In this case therefore, the ESX USER and ESX PASSWORD that you specify should be that of an Administrator or Virtual Machine Administrator in vCenter. However, if, owing to security constraints, you prefer not to use the credentials of such users, then, you can create a special role on vCenter with ‘Read-only’ privileges. Refer to Assigning the ‘Read-Only’ Role to a Local/Domain User to vCenter to know how to create a user on vCenter. If the ESX server for which this test is being configured had been discovered via vCenter, then the eG manager automatically populates the ESX USER and ESX PASSWORD text boxes with the vCenter user credentials using which the ESX discovery was performed. Like ESX servers, vCenter servers too terminate user sessions based on timeout periods. The default timeout period is 30 mins. When you stop an agent, sessions currently in use by the agent will remain open for this timeout period until vCenter times out the session. If the agent is restarted within the timeout period, it will open a new set of sessions. If you want the eG agent to close already existing sessions before it opens new sessions, then you would have to configure all the tests with the credentials of a vCenter user with permissions to View and Terminate Sessions (from vCenter 4.1, this is called the View and stop sessions permission). To know how to grant this permission to a user to vCenter, refer to Creating a Special Role on vCenter and Assigning the Role to a New User. When the eG agent is started/restarted, it first attempts to connect to the vCenter server and terminate all existing sessions for the user whose credentials have been provided for the tests. This is done to ensure that unnecessary sessions do not remain established in the vCenter server for the session timeout period. Ideally, you should create a separate user account with the required credentials and use this for the test configurations. If you provide the credentials for an existing user for the test configuration, when the eG agent starts/restarts, it will close all existing sessions for this user (including sessions you may have opened using the Virtual Infrastructure client). Hence, in this case, you may notice that your VI client sessions are terminated when the eG agent starts/restarts. |
|
Confirm password |
Confirm the password by retyping it here. |
|
SSL |
By default, the ESX server is SSL-enabled. Accordingly, the SSL flag is set to Yes by default. This indicates that the eG agent will communicate with the ESX server via HTTPS by default. On the other hand, if the eG agent has been configured to use the VMPerl API or CLI for monitoring (i.e., if the ESX USER parameter is set to none), then the status of the SSL flag is irrelevant. Like the ESX sever, the vCenter is also SSL-enabled by default. If you have chosen to use the vCenter for monitoring all the ESX servers in your environment, then you have to set the SSL flag to Yes. |
|
Webport |
By default, in most virtualized environments, the ESX server and vCenter listen on port 80 (if not SSL-enabled) or on port 443 (if SSL-enabled). This implies that while monitoring an SSL-enabled ESX server directly, the eG agent, by default, connects to port 443 of the ESX server to pull out metrics, and while monitoring a non-SSL-enabled ESX server, the eG agent connects to port 80. Similarly, while monitoring an ESX server via an SSL-enabled vCenter, the eG agent connects to port 443 of vCenter to pull out the metrics, and while monitoring via a non-SSL-enabled vCenter, the eG agent connects to port 80 of vCenter. Accordingly, the WEBPORT parameter is set to 80 or 443 depending upon the status of the ssl flag. In some environments however, the default ports 80 or 443 might not apply. In such a case, against the WEBPORT parameter, you can specify the exact port at which the ESX server or vCenter in your environment listens so that the eG agent communicates with that port. |
|
Virtual Center |
If the eG manager had discovered the target ESX server by connecting to vCenter, then the IP address of the vCenter server used for discovering this ESX server would be automatically displayed against the VIRTUAL CENTER parameter; similarly, the ESX USER and ESX PASSWORD text boxes will be automatically populated with the vCenter user credentials, using which ESX discovery was performed. If this ESX server has not been discovered using vCenter, but you still want to discover the guests on the ESX server via vCenter, then select the IP address of the vCenter host that you wish to use for guest discovery from the VIRTUAL CENTER list. By default, this list is populated with the IP address of all vCenter hosts that were added to the eG Enterprise system at the time of discovery. Upon selection, the ESX USERand ESX PASSWORD that were pre-configured for that vCenter server will be automatically displayed against the respective text boxes. On the other hand, if the IP address of the vCenter server of interest to you is not available in the list, then, you can add the details of the vCenter server on-the-fly, by selecting the Other option from the VIRTUAL CENTER list. This will invoke the ADD VCENTER SERVER DETAILS page. Refer to Adding the Details of a vCenter Server for VM Discovery On the other hand, if you want the eG agent to behave in the default manner -i.e., communicate with each ESX server for monitoring and VM information - then set the VIRTUAL CENTER parameter to ‘none’. |
|
Report Shared Datastores |
If the target vSphere/ESX server is being monitored via vCenter, then, you can set this flag to Yes to instruct the test to monitor both shared and local datastores, or set it to No so that, only the local datastores are monitored. However, if the target vSphere/ESX server is not monitored via vCenter, then the test will report metrics for all shared and local datastores, regardless of the status of this flag. |
|
Detailed Diagnosis |
To make diagnosis more efficient and accurate, eG Enterprise embeds an optional detailed diagnostic capability. With this capability, the eG agents can be configured to run detailed, more elaborate tests as and when specific problems are detected. To enable the detailed diagnosis capability of this test for a particular server, choose the On option. To disable the capability, click on the Off option. The option to selectively enable/disable the detailed diagnosis capability will be available only if the following conditions are fulfilled:
|
| Measurement | Description | Measurement Unit | Interpretation |
|---|---|---|---|
|
Datastore availability: |
Indicates whether/not this datastore is available. |
Percent |
The value 100 indicates that the datastore is available and the value 0 indicates that it is not. The detailed diagnosis of this measure reveals the datastore type. |
|
Number of LUNs for the physical storage: |
Indicates the number of LUNs in this datastore. |
Number |
The detailed diagnosis of this measure reveals the names of the LUNs in the datastore. |
|
Physical disk capacity: |
Indicates the total capacity of a datastore. For the Total descriptor, this is the total capacity across all datastores used by the target host. |
MB |
|
|
Used space: |
Indicates the amount of space used in a datastore. For the Total descriptor, this is the total space used across all datastores. |
MB |
Use the detailed diagnosis of this measure to know the top 10 files consuming the maximum space in the datastore. |
|
Free space: |
Indicates the current free space available on every datastore of a host. For the Total descriptor, this is the sum of unused space in all datastores. |
MB |
Ideally, the value of this measure should be high. |
|
Physical disk space usage: |
Indicates the percentage of disk space utilized on every datastore. To know the percentage of total space utilized across all datastores, click on the Total descriptor. |
Percent |
A value close to 100% can indicate a potential problem situation where applications executing on the host may not be able to write data to the disk partition(s) with very high usage. The detailed diagnosis of this measure reveals the top-10 files consuming maximum space in the datastore. The detailed diagnosis capability will not be available for the ‘Total’ descriptor. |
|
Datastore availability: |
Indicates whether/not this VMFS disk partition/datastore is available. |
Percent |
While the value 0 indicates that the datastore is not available, the value 100 indicates that the datastore is currently available. If a datastore becomes unavailable, then VMs that are currently using that datastore could be rendered inaccessible to users. To know which VMs would be / have been impacted by the non-availability of a datastore, use the detailed diagnosis capability of this measure (if enabled). This measure is not available for the ‘Total’ descriptor. |
|
Virtual disks: |
Indicates the total size of the virtual disk files in this datastore. For the Total descriptor, this is the total size of all virtual disk files in all datastores. |
MB |
The detailed diagnosis of this measure, if enabled, lists the disk files on this datastore and the size of each disk file. The detailed diagnosis capability will not be available for the ‘Total’ descriptor. |
|
Snapshot files: |
Indicates the total size of the snapshot files in this datastore. For the Total descriptor, this is the total size of all snapshot files in all datastores. |
MB |
The detailed diagnosis of this measure, if enabled, lists the snapshot files on this datastore and the size of each snapshot file. The detailed diagnosis capability will not be available for the ‘Total’ descriptor. |
|
Swap files: |
Indicates the total size of the swap files in this datastore. For the Total descriptor, this is the total size of all swap files in all datastores. |
MB |
The detailed diagnosis of this measure, if enabled, lists the swap files on this datastore and the size of each swap file. The detailed diagnosis capability will not be available for the ‘Total’ descriptor. |
|
Other VM files: |
Indicates the total size of the other VM files in this datastore. For the Total descriptor, this is the total size of all other VM files in all datastores. |
MB |
The value of this measure reports the space that is being used by files such as configuration, suspend data, NVRAM, screenshots and others. The detailed diagnosis of this measure, if enabled, lists these files and the size of each such file on this datastore. The detailed diagnosis capability will not be available for the ‘Total’ descriptor. By comparing the values reported by the Disk files, Snapshot files, Swap files, and Other VM files measures, you can accurately identify the type of files that are occupying too much space on a datastore. |
|
Allocated space: |
Indicates the amount of physical space provisioned by an administrator for this datastore. For the Total descriptor, this is the total physical space provisioned for all datastores used by this host. |
MB |
This measure reports the storage size up to which files on this datastore (or all datastores) can be stacked. |
|
Number of LUNs for the physical storage: |
Indicates the number of LUNs through which the host communicates with this datastore. |
Number |
This measure is not available for the ‘Total’ descriptor. |
|
Average write requests rate: |
Indicates the average number of write commands issued per second to this datastore. |
Commands/Sec |
These measures are good indicators of the load on a datastore. Compare the values of these measures across datastores to accurately identify th overloaded datastores. Both these measures are not available for the ‘Total’ descriptor. |
|
Average read requests rate: |
Indicates the average number of read commands issued per second to this datastore. |
Commands/Sec |
|
|
Write latency: |
Indicates the average amount of time taken to write to this datastore. |
Secs |
Very high values for these measures are indicative of processing bottlenecks in a datastore. To know which datastore is experiencing the maximum latency, compare the values of these measures across datastores. Both these measures are not available for the ‘Total’ descriptor. |
|
Read latency: |
Indicates the average amount of time taken to read from this datastore. |
Secs |
|
|
Storage I/O control normalized latency: |
Indicates the device latency that the host observes while communicating with this datastore; this latency is a normalized average across virtual machines |
Secs |
Storage I/O Control allows cluster-wide storage I/O prioritization, which allows better workload consolidation and helps reduce extra costs associated with over provisioning. When you enable Storage I/O Control on a datastore, ESX/ESXi begins to monitor the device latency that hosts observe when communicating with that datastore. When device latency exceeds a threshold, the datastore is considered to be congested and each virtual machine that accesses that datastore is allocated I/O resources in proportion to their shares. You set shares per virtual machine. You can adjust the number for each based on need. This measure is not available for the ‘Total’ descriptor. Use the detailed diagnosis of this measure to know how much I/O resources have been allocated to each VM using this datastore. |
|
Storage I/O control aggregated IOPS: |
Indicates the aggregate number of I/O operations that are occurring on this datastore. |
Number |
This measure is not available for the ‘Total’ descriptor. Use the detailed diagnosis of this measure to know how much I/O resources have been allocated to each VM using this datastore. |
|
Read rate: |
Indicates the rate at which data is read from this datastore. |
MB/Sec |
This measure is not available for the ‘Total’ descriptor. |
|
Write rate: |
Indicates the rate at which data is written to this datastore. |
MB/Sec |
This measure is not available for the ‘Total’ descriptor. |
|
Storage I/O Control active time: |
Indicates whether storage I/O control (SIOC) is active on this datastore or not. |
|
Storage I/O Control (SIOC) is used to provide I/O prioritization of virtual machines running on a group of VMware vSphere hosts that have access to a shared storage pool. It extends the familiar constructs of shares and limits, which exist for CPU and memory, to address storage utilization through a dynamic allocation of I/O capacity across a cluster of vSphere hosts. If SIOC is active, the value of this measure will be 100%. If it is not active, the value of this measure will be 0. |
|
Total iops: |
Indicates the total number of read and write commands issued per second to this datastore. |
Commands/Sec |
Compare the value of this measure across datastores to identify the busiest datastore in terms of the rate at which read/write commands are issued on it. A consistent increase in the value of this measure for a particular datastore could indicate a potential I/O overload. |
|
Total latency: |
Indicates the total amount of time taken to read and write to this datastore. |
Secs |
Ideally, the value of this measure should be low. A high value could indicate an I/O processing bottleneck. By comparing the value of this measure across datastore, you can quickly identify which datastore is the most latent. Such datastores are ideal candidates for enabling SIOC. Enabling IOC on a datastore triggers the the monitoring of device latency that hosts observe when communicating with that datastore. When latency exceeds a set threshold the feature engages automatically as the datastore is experiencing congestion. Each virtual machine that accesses that datastore is then allocated I/O resources in proportion to their shares. |
|
Throughput: |
Indicates the rate at which the data is read and written to this datastore. |
MB/Sec |
Ideally, the value of this measure should be high. A steady decrease in the value of this measure could indicate that the datastore is experiencing a congestion. You may want to enable SIOC on such datastores, so that when latency exceeds a set threshold the SIOC feature engages automatically and then allocates I/O resources to each VM that acceses that datastore in proportion to their shares. |
The detailed diagnosis of the Datastore availability measure reveals the type of the datastore.

Figure 1 : The detailed diagnosis of the Datastore availability measure
The detailed diagnosis of the Number of LUNs for physical storage measure reveals the names of the LUNs in the datastore.
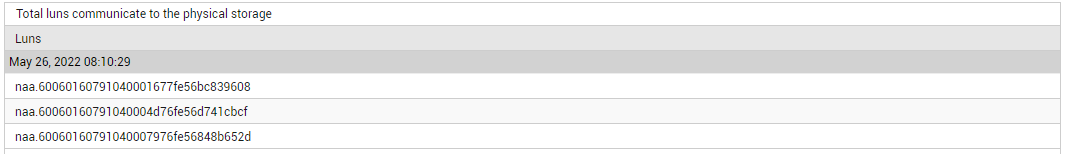
Figure 2 : The detailed diagnosis of the Number of LUNs for physical storage measure
The detailed diagnosis of the Used space measure reveals the top-10 files that are consuming the maximum storage space in the datastore. If any datastore is running out of space, you can use this information to identify the precise files on that datastore that are contributing to the space contention.
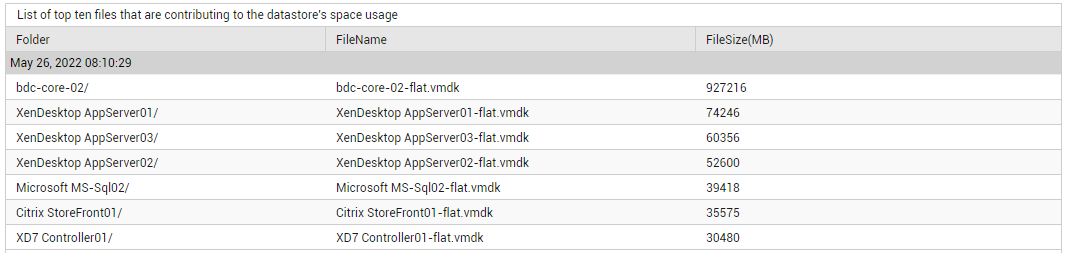
Figure 3 : The detailed diagnosis of the Used space measure
The detailed diagnosis of the Storage I/O control normalized latency measure and the Storage I/O control aggregated IOPS measure reveal how much I/O resources have been allocated to each VM that is using a datastore.

Figure 4 : The detailed diagnosis of the Storage I/O control normalized latency measure

Figure 5 : The detailed diagnosis of the Storage I/O control aggregated IOPS measure