WEM Startup Details - OS Test
One of the common reasons for poor user logon experience in a VDI environment is the delay in profile loading and group policy application. Using Citrix Workspace Environment Management (WEM), this delay can be greatly minimized!
Citrix WEM uses intelligent resource management and Profile Management technologies to provide the best logon experience to users in Citrix XenApp and XenDesktop deployments.
Figure 1 depicts the architecture of Citrix WEM. The WEM Administration Console is where policies are defined and managed, resources are created and assigned, and users are authorized. The settings so defined are communicated to a WEM Broker, which stores the same in a SQL server backend. WEM Agents are deployed on VDAs or physical Windows devices. These agents communicate with the WEM Broker and enforce the settings you configured. An Active Directory server is used to push the settings to users.
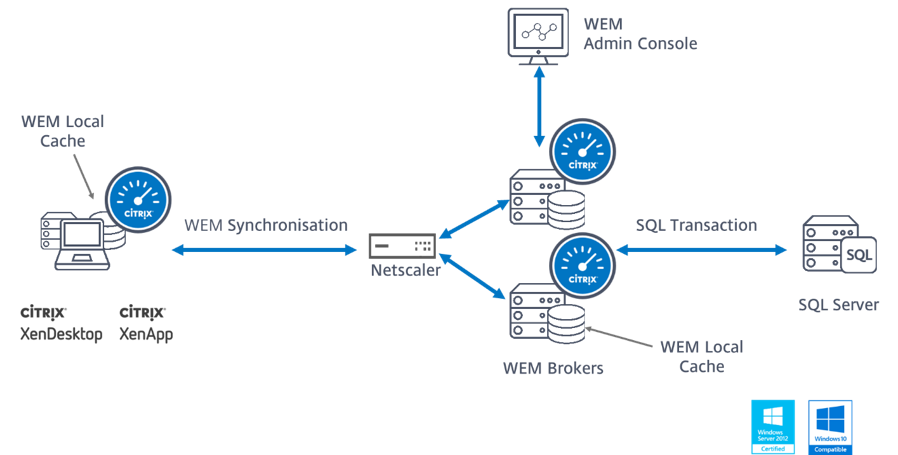
Figure 1 : Architecture of Citrix WEM
Typically, the WEM agents offload the critical logon processing steps – eg., group policy application, logon script execution, drive/printer mapping, etc. – and perform them after the logon, thus significantly improving logon speed (see Figure 2).
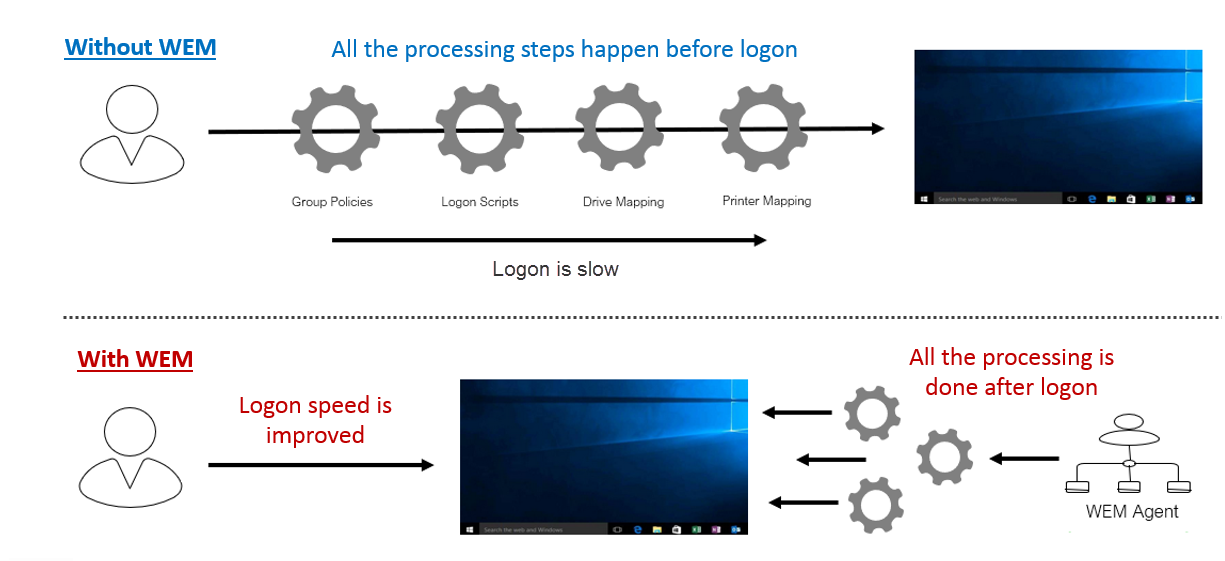
Figure 2 : How Citrix WEM helps minimize logon time
This is why, where WEM is employed, user logons will be quick and hassle-free. However, if WEM clients – i.e., the WEM agents - experience delays or errors in logon processing, it can cause serious performance issues post logon. In other words, user profile loading, logon script execution, drive mapping etc., can become very slow. Because of such issues, a user will be unable to access the application/desktop profile, even after logging in quickly.
Therefore, to assure users of a high quality experience at all times, administrators of WEM-enabled environments should continuously monitor the WEM processing times on the clients. This is exactly where the WEM Startup Details - OS test helps!
For each user of a desktop OS machine (provisioned on a VDI server) that hosts a WEM agent, this test reports on the overall WEM processing duration, the time taken by the WEM agent to perform initial processing (this includes tasks such as detecting and reading initial configuration, reading SQL configuration, etc.), and the time taken by the WEM agent to perform main processing (this includes processing of main instructions - eg., mapping network/virtual drives, processing environmental variables, application launching etc.). In the process, administrators are proactively alerted to a delay in WEM processing. The root-cause of the delay is also accurately pinpointed - is it because WEM agent took too long to perform initial processing? or was too much time spent on processing the main instructions? if initial processing was delayed, then was the delay due to a bottleneck when the WEM agent was reading the initial configuration? or was it due to a delay when reading other settings such as SQL configuration, environmental settings, kiosk settings, etc.? if main processing was delayed, then was the delay because the WEM agent was slow detecting the OS/agent log settings? or was it owing to a delay in processing the critical instructions such as network drive mapping, virtual drive mapping, external task processing, application launching, etc? Errors in processing that could be slowing down WEM start-up are also highlighted, so that administrators can easily rectify them. This way, the WEM Startup Details - OS test promptly captures and reports performance bottlenecks on WEM clients that can impact overall user experience with VDI server, thus prompting administrators to rapidly initiate remedial measures.
This test is disabled by default. To enable the test, go to the enable / disable tests page using the menu sequence : Agents -> Tests -> Enable/Disable, pick VMware vSphere VDI as the desired Component type, set Performance as the Test type, choose the test from the disabled tests list, and click on the < button to move the test to the ENABLED TESTS list. Finally, click the Update button.
Note:
This test will report measures only if the desktops are brokered by Citrix XenDesktop.
Target of the test : A ESX server host
Agent deploying the test : An internal agent
Outputs of the test : One set of results for each user who is currently logged into the desktop OS machines hosting a WEM agent.
| Parameter | Description |
|---|---|
|
Test Period |
How often should the test be executed |
|
Host |
The host for which the test is to be configured |
|
Port |
The port at which the specified HOST listens. By default, this is NULL. |
|
ESX User and ESX Password |
In order to enable the test to extract the desired metrics from a target ESX server, you need to configure the test with an ESX USER and ESX PASSWORD. The user credentials to be passed here depend upon the mechanism used by the eG agent for auto-discovering the VMs on the target vSphere server and monitoring the server and its VMs. These discovery/monitoring methodologies and their corresponding configuration requirements have been discussed hereunder:
|
|
Confirm Password |
Confirm the specified ESX PASSWORD by retyping it here. |
|
SSL |
By default, the ESX server is SSL-enabled. Accordingly, the SSL flag is set to Yes by default. This indicates that the eG agent will communicate with the ESX server via HTTPS by default. On the other hand, if the eG agent has been configured to use the VMPerl API or CLI for monitoring (i.e., if the ESX USER parameter is set to none), then the status of the SSL flag is irrelevant. Like the ESX sever, the vCenter is also SSL-enabled by default. If you have chosen to use the vCenter for monitoring all the ESX servers in your environment, then you have to set the SSL flag to Yes. |
|
Webport |
By default, in most virtualized environments, the ESX server and vCenter listen on port 80 (if not SSL-enabled) or on port 443 (if SSL-enabled). This implies that while monitoring an SSL-enabled ESX server directly, the eG agent, by default, connects to port 443 of the ESX server to pull out metrics, and while monitoring a non-SSL-enabled ESX server, the eG agent connects to port 80. Similarly, while monitoring an ESX server via an SSL-enabled vCenter, the eG agent connects to port 443 of vCenter to pull out the metrics, and while monitoring via a non-SSL-enabled vCenter, the eG agent connects to port 80 of vCenter. Accordingly, the WEBPORT parameter is set to 80 or 443 depending upon the status of the SSL flag. In some environments however, the default ports 80 or 443 might not apply. In such a case, against the WEBPORT parameter, you can specify the exact port at which the ESX server or vCenter in your environment listens so that the eG agent communicates with that port. |
|
Virtual Center |
If the eG manager had discovered the target ESX server by connecting to vCenter, then the IP address of the vCenter server used for discovering this ESX server would be automatically displayed against the VIRTUAL CENTER parameter; similarly, the ESX USER and ESX PASSWORD text boxes will be automatically populated with the vCenter user credentials, using which ESX discovery was performed. If this ESX server has not been discovered using vCenter, but you still want to discover the guests on the ESX server via vCenter, then select the IP address of the vCenter host that you wish to use for guest discovery from the VIRTUAL CENTER list. By default, this list is populated with the IP address of all vCenter hosts that were added to the eG Enterprise system at the time of discovery. Upon selection, the ESX USERand ESX PASSWORD that were pre-configured for that vCenter server will be automatically displayed against the respective text boxes. On the other hand, if the IP address of the vCenter server of interest to you is not available in the list, then, you can add the details of the vCenter server on-the-fly, by selecting the Other option from the VIRTUAL CENTER list. This will invoke the ADD VCENTER SERVER DETAILS page. Refer to Adding the Details of a vCenter Server for VM Discovery On the other hand, if you want the eG agent to behave in the default manner -i.e., communicate with each ESX server for monitoring and VM information - then set the VIRTUAL CENTER parameter to ‘none’. |
|
Exclude VMs |
Administrators of some virtualized environments may not want to monitor some of their less-critical VMs - for instance, VM templates - both from ‘outside’ and from ‘inside’. The eG agent in this case can be configured to completely exclude such VMs from its monitoring purview. To achieve this, provide a comma-separated list of VMs to be excluded from monitoring in the EXCLUDE VMS text box. Instead of VMs, VM name patterns can also be provided here in a comma-separated list. For example, your exclude vms specification can be: *xp,*lin*,win*,vista. Here, the * (asterisk) is used to denote leading and trailing spaces (as the case may be). By default, this parameter is set to none indicating that the eG agent obtains the inside and outside views of all VMs on a virtual host by default. By providing a comma-separated list of VMs/VM name patterns in the EXCLUDE VMS text box, you can make sure the eG agent stops collecting ‘inside’ and ‘outside’ view metrics for a configured set of VMs. |
|
Exclude IP |
Typically, when performing VM discovery, the eG agent automatically discovers the operating system on which every VM runs, and all the IP addresses that each VM supports. If two are more VMs on a target vSphere server are in a VM cluster, then the eG agent will also auto-discover the cluster IP address. Since the cluster IP address is shared by all VMs in the cluster, this IP address will be in the discovery list of every VM in the cluster. In this case, if the eG agent attempts to obtain the 'inside view' of each VM in a cluster using their cluster IP address, incorrect metrics may be reported sometimes. To avoid this, you may want to instruct the eG agent to not use the cluster IP address when collecting 'inside view' metrics. For this, specify a comma-separated list of cluster IP addresses to be excluded in the EXCLUDE IP text box. |
|
Ignore VMs Inside View |
Administrators of some high security VMware environments might not have permissions to internally monitor one/more VMs. The eG agent can be configured to not obtain the ‘inside view’ of such ‘inaccessible’ VMs using the IGNORE VMS INSIDE VIEW parameter. Against this parameter, you can provide a comma-separated list of VM names, or VM name patterns, for which the inside view need not be obtained. For instance, your IGNORE VMS INSIDE VIEW specification can be: *xp,*lin*,win*,vista. Here, the * (asterisk) is used to denote leading and trailing spaces (as the case may be). By default, this parameter is set to none indicating that the eG agent obtains the inside view of all VMs on an ESX host by default. Note: While performing VM discovery, the eG agent will not discover the operating system of the VMs configured in the IGNORE VMS INSIDE VIEW text box. |
|
Ignore WINNT |
By default, the eG agent does not support the inside view for VMs executing on Windows NT operating systems. Accordingly, the IGNORE WINNT flag is set to Yes by default. |
|
Inside view using |
By default, this test obtains the “inside view” of VMs using the eG VM Agent. Accordingly, the Inside view using flag is set to eG VM Agent by default. The eG VM Agent is a piece of software, which should be installed on every VM on a hypervisor. Every time the eG agent runs this test, it uses the eG VM Agent to pull relevant 'inside view' metrics from each VM. Once the metrics are collected, the eG agent then communicates with each VM agent and pulls these metrics, without requiring administrator privileges. Refer to Configuring the Remote Agent to Obtain the Inside View of VMs for more details on the eG VM Agent. |
|
Domain, Admin User, and Admin Password, and Confirm Password |
By default, these parameters are set to none. This is because, by default, the eG agent collects 'inside view' metrics using the eG VM agent on each VM. Domain administrator privileges need not be granted to the eG agent if it uses this default approach to obtain the 'inside view' of Windows VMs. |
|
Citrix Home |
By default, this parameter is set to none indicating that the eG agent would automatically discover the location at which the Virtual Delivery Agent (VDA) is installed for collecting the metrics of this test. If the Virtual Delivery Agent is installed in a different location in your Citrix environment, then indicate that location in the CITRIX HOME text box. |
|
Report By User |
This flag is set to Yes by default. The value of this flag cannot be changed. This implies that the virtual machines in VDI environments will always be identified using the login name of the user. In other words, in VDI environments, this test will, by default, report measures for every username_on_virtualmachinename. |
|
Report Powered OS |
This flag becomes relevant only if the REPORT BY USERflag is set to ‘Yes’ If the REPORT POWERED OS flag is set to Yes (which is the default setting), then this test will report measures for even those VMs that do not have any users logged in currently. Such guests will be identified by their virtualmachine name and not by the username_on_virtualmachinename. On the other hand, if the REPORT POWERED OS flag is set to No, then this test will not report measures for those VMs to which no users are logged in currently. |
|
DD Frequency |
Refers to the frequency with which detailed diagnosis measures are to be generated for this test. The default is 1:1. This indicates that, by default, detailed measures will be generated every time this test runs, and also every time the test detects a problem. You can modify this frequency, if you so desire. Also, if you intend to disable the detailed diagnosis capability for this test, you can do so by specifying none against DD FREQUENCY. |
|
Detailed Diagnosis |
To make diagnosis more efficient and accurate, eG Enterprise embeds an optional detailed diagnostic capability. With this capability, the eG agents can be configured to run detailed, more elaborate tests as and when specific problems are detected. To enable the detailed diagnosis capability of this test for a particular server, choose the On option. To disable the capability, click on the Off option. The option to selectively enable/disable the detailed diagnosis capability will be available only if the following conditions are fulfilled:
|
| Measurement | Description | Measurement Unit | Interpretation |
|---|---|---|---|
|
Information messages |
Indicates the number of information messages logged in the event logs during WEM processing for this user. |
Number |
|
|
Warnings |
Indicates the number of warning messages logged in the WEM logs during WEM processing for this user. |
Number |
Ideally, the value of this measure should be 0. If a non-zero value is reported, use the detailed diagnosis of this measure to view the warning messages logged in the WEM logs. |
|
Errors |
Indicates the number of errors messages logged in the logs during WEM processing for this user. |
Number |
Ideally, the value of this measure should be 0. A non-zero value is a cause for concern, as it indicates that one/more errors have occurred. You may want to use the detailed diagnosis of this measure to know what errors occurred. |
|
Total WEM processing duration |
Indicates the total time taken for WEM processing for this user. |
Seconds |
A consistent rise in the value of this measure could indicate a bottleneck in WEM processing for that user. To know where the bottleneck lies, compare the value of the Total init processing duration and WEM agent processing duration metrics. This will indicate where WEM agent spent maximum time - in starting up? or in post logon activities (eg., drive mapping, printer mapping, etc.)? |
|
Total Init processing duration |
Indicates the total time taken by WEM to perform initial processing for this user. |
Seconds |
The init processing duration is the time taken by the WEM agent to start-up. This includes the time taken by the WEM agent to detect the start-up settings and then read its configuration. If the value of this measure is abnormally high, it could indicate a delay in WEM agent start-up. To diagnose the root-cause of the delay, compare the value of all metrics grouped under the section Init Processing Breakup in the Layers tab page of the eG monitoring console. This will point you to where the bottleneck lies - did the agent take too long to detect start-up settings? did it take a long time to read the start-up configuration? or did the WEM agent experience any slowness when reading SQL configuration, Microsoft USV settings, environmental settings, system utilities settings, system monitoring settings, or kiosk settings? |
|
WEM agent processing |
Indicates the time taken by the WEM agent to perform post-logon activities for this user. |
Seconds |
The WEM agent processing duration is the sum of the time taken by the WEM agent to process the instructions it detected and read during the init processing/start-up stage, and the time taken to perform post-logon tasks such as virtual drives mapping, network drives mapping, registry entry processing, etc. If the value of this measure is abnormally high, it could indicate a delay in processing by the WEM agent. To diagnose the root-cause of the delay, compare the value of all metrics grouped under the section WEM Agent Processing Breakup in the Layers tab page of the eG monitoring console. This will point you to where the bottleneck lies - did the agent take too long to process the initial configuration it read? did it take a long time to map virtual drives / network drives? did processing of environment variables, registry entries, printers, ports, DNS, file system operations, file associations, or ini file operations take too long? was external task processing slow? |
|
Initial processing duration |
Indicates the time taken by the WEM agent to detect desktop settings - i.e., detect the IP address, version, and OS of the desktop, the user desktop folder, the user taskbar, icons, shortcuts, etc. |
Seconds |
If the Total init processing duration measure reports an abnormally high value, then compare the value of the Initial processing duration measure with all other time values reported by the Init Processing Breakup section in the Layers tab page of the eG monitoring console, to figure out if a delay in discovering desktop settings is what caused initial processing by the WEM processing to slow down. |
|
Reading agent configuration processing duration |
Indicates the time taken by the WEM agent to read its initial configuration . |
Seconds |
If the Total init processing duration measure reports an abnormally high value, then compare the value of the Reading agent configuration processing duration measure with all other time values reported by the Init Processing Breakup section in the Layers tab page of the eG monitoring console to figure out if a delay in reading the configuration is what caused initial processing by WEM to slow down. |
|
SQL configuration setting duration |
Indicates the time taken by the WEM agent to read the SQL configuration settings for this user. |
Seconds |
If the Total init processing duration measure reports an abnormally high value, then compare the value of the SQL configuration setting duration measure with all other time values reported by the Init Processing Breakup section in the Layers tab page of the eG monitoring console to figure out if a delay in reading the SQL configuration is what caused initial processing by the WEM agent to slow down. If the comparative analysis reveals that the delay is indeed owing to a bottleneck when reading the SQL configuration, then use the detailed diagnosis of this measure to view the messages pertaining to SQL configuration reads that are logged in the Citrix WEM Agent.log. The time taken to process each instruction pertaining to SQL configuration reads is revealed, accurately pointing you to the exact step/instruction that took the longest time. |
|
Microsoft USV setting duration |
Indicates the time taken by the WEM agent to read the Microsoft USV settings for this user. |
Seconds |
If the Total init processing duration measure reports an abnormally high value, then compare the value of the Microsoft USV setting duration measure with all other time values reported by the Init Processing Breakup section in the Layers tab page of the eG monitoring console to figure out if a delay in reading the Microsoft USV settings is what caused initial processing by the WEM agent to slow down. If the comparative analysis reveals that the delay is indeed owing to a bottleneck when reading the Microsoft USV settings, then use the detailed diagnosis of this measure to view the messages pertaining to Microsoft USV setting reads that are logged in the Citrix WEM Agent.log. The time taken to process each instruction pertaining to Microsoft USV setting reads is revealed, accurately pointing you to the exact step/instruction that took the longest time. |
|
Environmental setting duration |
Indicates the time taken by the WEM agent to read the environmental settings for this user. |
Seconds |
If the Total init processing duration measure reports an abnormally high value, then compare the value of the Environmental setting duration measure with all other time values reported by the Init Processing Breakup section in the Layers tab page of the eG monitoring console to figure out if a delay in reading the environmental settings is what caused initial processing by the WEM agent to slow down. If the comparative analysis reveals that the delay is indeed owing to a bottleneck when reading the environmental settings, then use the detailed diagnosis of this measure to view the messages pertaining to environmental setting reads that are logged in the Citrix WEM Agent.log. The time taken to process each instruction pertaining to environmental setting reads is revealed, accurately pointing you to the exact step/instruction that took the longest time. |
|
System utilities setting duration |
Indicates the time taken by the WEM agent to read the system utilities settings for this user. |
Seconds |
If the Total init processing duration measure reports an abnormally high value, then compare the value of the System utilities setting duration measure with all other time values reported by the Init Processing Breakup section in the Layers tab page of the eG monitoring console to figure out if a delay in reading the system utilities settings is what caused initial processing by the WEM agent to slow down. If the comparative analysis reveals that the delay is indeed owing to a bottleneck when reading the system utilities settings, then use the detailed diagnosis of this measure to view the messages related to reading the system utilities settings that are logged in the Citrix WEM Agent.log. The time taken to process each instruction pertaining to system utilities setting reads is revealed, accurately pointing you to the exact step/instruction that took the longest time. |
|
System monitoring setting duration |
Indicates the time taken by the WEM agent to read the system monitoring settings for this user. |
Seconds |
If the Total init processing duration measure reports an abnormally high value, then compare the value of the System monitoring setting duration measure with all other time values reported by the Init Processing Breakup section in the Layers tab page of the eG monitoring console to figure out if a delay in reading the system monitoring settings is what caused initial processing by the WEM agent to slow down. If so, then you can use the detailed diagnosis of this measure to view the messages related to reading the system monitoring settings that are logged in the Citrix WEM Agent.log. The time taken to process each instruction pertaining to system monitoring setting reads is revealed, accurately pointing you to the exact step/instruction that took the longest time. |
|
Kiosk setting duration |
Indicates the time taken by the WEM agent to read the kiosk settings for this user. |
Seconds |
If the Total init processing duration measure reports an abnormally high value, then compare the value of the Kiosk setting duration measure with all other time values reported by the Init Processing Breakup section in the Layers tab page of the eG monitoring console to figure out if a delay in reading the kiosk settings is what caused initial processing by the WEM agent to slow down. If the comparative analysis reveals that the delay is indeed owing to a bottleneck when reading the kiosk settings, then use the detailed diagnosis of this measure to view the messages related to reading the kiosk settings that are logged in the Citrix WEM Agent.log. The time taken to process each instruction pertaining to kiosk setting reads is revealed, accurately pointing you to the exact step/instruction that took the longest time. |
|
WEM agent main log initial processing duration |
Indicates the time taken by the WEM agent to detect WEM broker settings, the WEM agent log settings, and desktop settings, before proceeding to process the main instructions (eg., network drive and virtual drive mapping, application launching, registry entry processing, etc.) for this user. |
Seconds |
If the WEM agent processing measure reports an abnormally high value, then compare the value of the WEM agent main log initial processing duration measure with all other time values reported by the WEM Agent Processing Breakup section in the Layers tab page of the eG monitoring console to figure out if a delay in processing desktop/logging/broker settings is what caused the WEM processing to slow down. |
|
Environment variables processing duration |
Indicates the time taken by the WEM agent to process environment variables for this user. |
Seconds |
If the WEM agent processing measure reports an abnormally high value, then compare the value of the Environment variables processing duration measure with all other time values reported by the WEM Agent Processing Breakup section in the Layers tab page of the eG monitoring console to figure out if a delay in processing environment variables is what caused WEM processing to slow down. If this processing is indeed found to be the reason for slowing down the WEM agent, then use the detailed diagnosis of this measure to identify the exact environment variables responsible for the delay. |
|
Registry entry processing duration |
Indicates the time taken by the WEM agent to process registry entries for this user. |
Seconds |
If the WEM agent processing measure reports an abnormally high value, then compare the value of the Registry entry processing duration measure with all other time values reported by the WEM Agent Processing Breakup section in the Layers tab page of the eG monitoring console to figure out if a delay in processing registry entries is what caused WEM processing to slow down. |
|
Networks processing duration |
Indicates the time taken by the WEM agent to process network drive mappings for this user. |
Seconds |
If the WEM agent processing measure reports an abnormally high value, then compare the value of the Networks processing duration measure with all other time values reported by the WEM Agent Processing Breakup section in the Layers tab page of the eG monitoring console to figure out if a delay in processing network drive mappings is what caused WEM processing to slow down. If the comparative analysis reveals that the processing of network drive mappings is indeed what is slowing down the WEM agent, then use the detailed diagnosis of this measure for messages pertaining to network drive mapping that are logged in the Citrix WEM Agent.log. The time taken to process each instruction pertaining to network drive mapping is revealed, accurately pointing you to the exact step/instruction that took the longest time. |
|
Virtual drives processing duration |
Indicates the time taken by the WEM agent to process virtual drive mappings for this user. |
Seconds |
If the WEM agent processing measure reports an abnormally high value, then compare the value of the Virtual drives processing duration measure with all other time values reported by the WEM Agent Processing Breakup section in the Layers tab page of the eG monitoring console to figure out if a delay in processing virtual drive mappings is what caused WEM processing to slow down. If the comparative analysis reveals that the processing of virtual drive mappings is indeed what is slowing down the WEM agent, then use the detailed diagnosis of this measure to view the messages pertaining to virtual drive mapping that are logged in the Citrix WEM Agent.log. The time taken to process each instruction pertaining to virtual drive mapping is revealed, accurately pointing you to the exact step/instruction that took the longest time. |
|
Printers processing duration |
Indicates the time taken by the WEM agent to process printers for this user. |
Seconds |
If the WEM agent processing measure reports an abnormally high value, then compare the value of the Printers processing duration measure with all other time values reported by the WEM Agent Processing Breakup section in the Layers tab page of the eG monitoring console to figure out if a delay in printer processing is what caused WEM processing to slow down. If the comparative analysis reveals that the processing of printers is indeed what is slowing down the WEM agent, then use the detailed diagnosis of this measure to view the messages pertaining to printer processing that are logged in the Citrix WEM Agent.log. The time taken to process each instruction pertaining to printer processing is revealed, accurately pointing you to the exact step/instruction that took the longest time. |
|
Port processing duration |
Indicates the time taken by the WEM agent to process ports for this user. |
Seconds |
If the WEM agent processing measure reports an abnormally high value, then compare the value of the Port processing duration measure with all other time values reported by the WEM Agent Processing Breakup section in the Layers tab page of the eG monitoring console to figure out if a delay in processing ports is what caused WEM processing to slow down. If the comparative analysis reveals that the processing of ports is indeed what is slowing down the WEM agent, then use the detailed diagnosis of this measure to view the messages pertaining to port processing that are logged in the Citrix WEM Agent.log. The time taken to process each instruction pertaining to port processing is revealed, accurately pointing you to the exact step/instruction that took the longest time. |
|
File system operation processing duration |
Indicates the time taken by the WEM agent to process file system operations for this user. |
Seconds |
If the WEM agent processing measure reports an abnormally high value, then compare the value of the File system operation processing duration measure with all other time values reported by the WEM Agent Processing Breakup section in the Layers tab page of the eG monitoring console to figure out if a delay in file system operation processing is what caused WEM processing to slow down. If the comparative analysis reveals that the processing of file system operations is indeed what is slowing down the WEM agent, then use the detailed diagnosis of this measure to view the messages pertaining to file system operations that are logged in the Citrix WEM Agent.log. The time taken to process each instruction pertaining to the processing of file system operations is revealed, accurately pointing you to the exact step/instruction that took the longest time. |
|
Ini file operations processing duration |
Indicates the time taken by the WEM agent to process ini file operations for this user. |
Seconds |
If the WEM agent processing measure reports an abnormally high value, then compare the value of the Ini file operations processing duration measure with all other time values reported by the WEM Agent Processing Breakup section in the Layers tab page of the eG monitoring console to figure out if a delay in ini file operation processing is what caused WEM processing to slow down. If the comparative analysis reveals that the processing of ini file operations is indeed what is slowing down the WEM agent, then use the detailed diagnosis of this measure to view the messages pertaining to ini file operation processing that are logged in the Citrix WEM Agent.log. The time taken to process each instruction pertaining to ini file operation processing is revealed, accurately pointing you to the exact step/instruction that took the longest time. |
|
User DNS processing duration |
Indicates the time taken by the WEM agent to perform DNS processing for this user. |
Seconds |
If the WEM agent processing measure reports an abnormally high value, then compare the value of the User DNS processing duration measure with all other time values reported by the WEM Agent Processing Breakup section in the Layers tab page of the eG monitoring console to figure out if a delay in DNS processing is what caused WEM processing to slow down. If the comparative analysis reveals that DNS processingis indeed what is slowing down the WEM agent, then use the detailed diagnosis of this measure to view the messages pertaining to DNS processing that are logged in the Citrix WEM Agent.log. The time taken to process each instruction pertaining to DNS processing is revealed, accurately pointing you to the exact step/instruction that took the longest time. |
|
File association processing duration |
Indicates the time taken by the WEM agent to process file associations for this user. |
Seconds |
If the WEM agent processing measure reports an abnormally high value, then compare the value of the File association processing duration measure with all other time values reported by the WEM Agent Processing Breakup section in the Layers tab page of the eG monitoring console to figure out if a delay in file association processing is what caused WEM processing to slow down. If the comparative analysis reveals that the processing of file associations is indeed what is slowing down the WEM agent, then use the detailed diagnosis of this measure to view the messages pertaining to file association processing that are logged in the Citrix WEM Agent.log. The time taken to process each instruction pertaining to file association processing is revealed, accurately pointing you to the exact step/instruction that took the longest time. |
|
External task processing duration |
Indicates the time taken by the WEM agent to process external tasks for this user. |
Seconds |
If the WEM agent processing measure reports an abnormally high value, then compare the value of the External task processing duration measure with all other time values reported by the WEM Agent Processing Breakup section in the Layers tab page of the eG monitoring console to figure out if a delay in external task processing is what caused WEM processing to slow down. If the comparative analysis reveals that the processing of external tasks is indeed what is slowing down the WEM agent, then use the detailed diagnosis of this measure to view the messages pertaining to external task processing that are logged in the Citrix WEM Agent.log. The time taken to process each instruction pertaining to external task processing is revealed, accurately pointing you to the exact step/instruction that took the longest time. |
|
Application processing duration |
Indicates the total duration to launch the applications configured in this user's work space environment. |
Seconds |
If the WEM agent processing measure reports an abnormally high value, then compare the value of the Application processing duration measure with all other time values reported by the WEM Agent Processing Breakup section in the Layers tab page of the eG monitoring console to figure out if a delay in launching of applications is what caused WEM processing to slow down. If the comparative analysis reveals that application launch processing is indeed what is slowing down the WEM agent, then use the detailed diagnosis of this measure to view the messages pertaining to application launch processing that are logged in the Citrix WEM Agent.log. The time taken to process each instruction pertaining to application launch processing is revealed, accurately pointing you to the exact step/instruction that took the longest time. |
Use the detailed diagnosis of the External task processing duration measure to view the messages related to the processing of external tasks that are logged in the Citrix WEM Agent.log. The time taken to process each instruction pertaining to external task processing is revealed, accurately pointing you to the exact step/instruction that took the longest time.
Figure 3 : The detailed diagnosis of the External task processing duration measure
Clicking on the 'right arrow' button at the end of the Inside View of Desktops layer lists the tests mapped to that layer (see Figure 4).
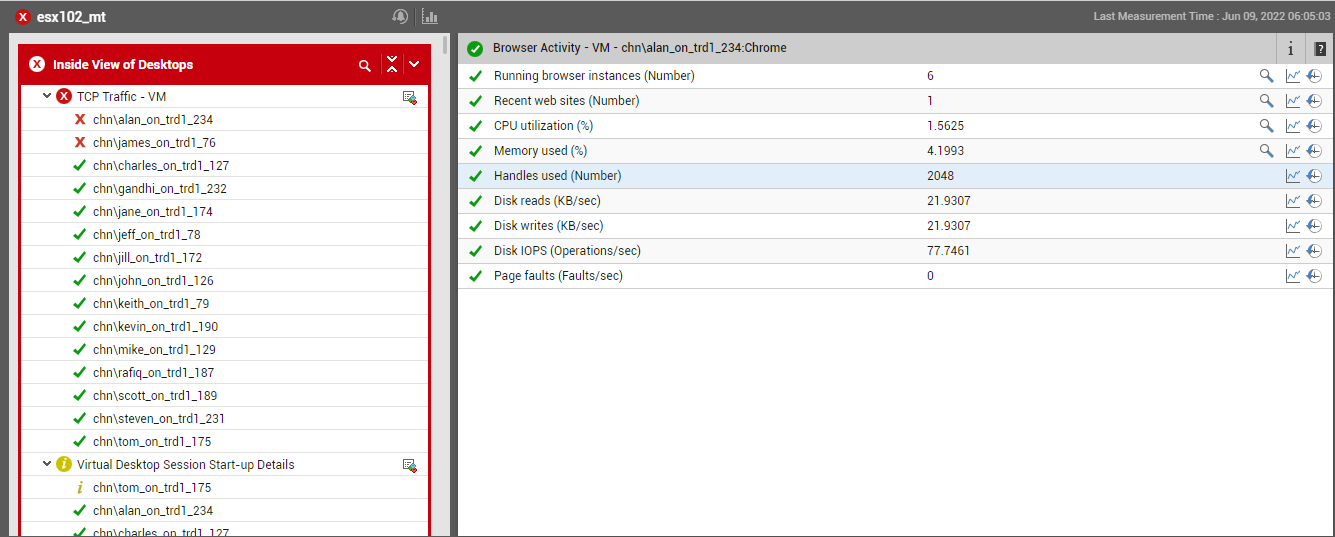
Figure 4 : The tests mapped to the Inside View of Desktops layer appearing when the right arrow is clicked
On the other hand, if you click on the Inside View of Desktops layer itself, you will be lead to the Desktop View (see Figure 5), where you will find all the desktops on the target vSphere server listed.
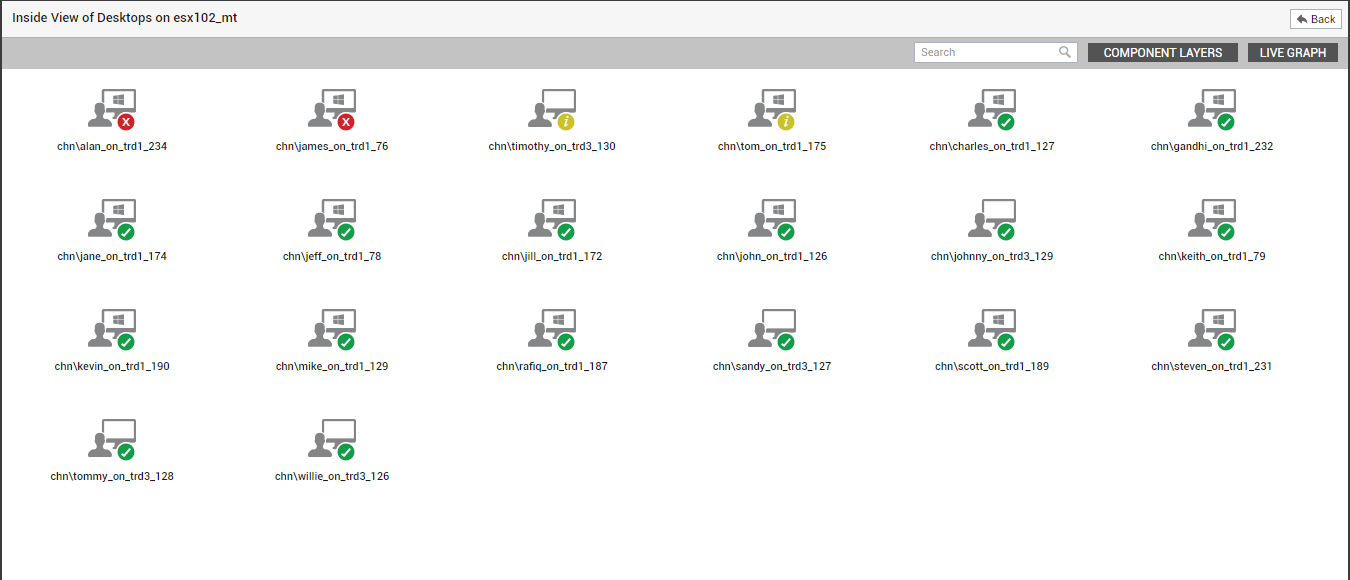
Figure 5 : The Desktop View that appears when the Inside View of Desktops layer is clicked
From the desktop view, you can further drill-down to focus on the health of a particular desktop, by clicking on the icon representing the desktop in . Figure 6 then appears displaying all the performance metrics extracted from that virtual desktop in real-time. In the Measures dashboard of , these 'inside view' metrics are logically grouped into 5 tab pages, namely - VM Operating System, Network/TCP, Logon, User Experience, and Others. To know more about the Measures dashboard and the tab pages it contains, refer to The Measures Dashboard
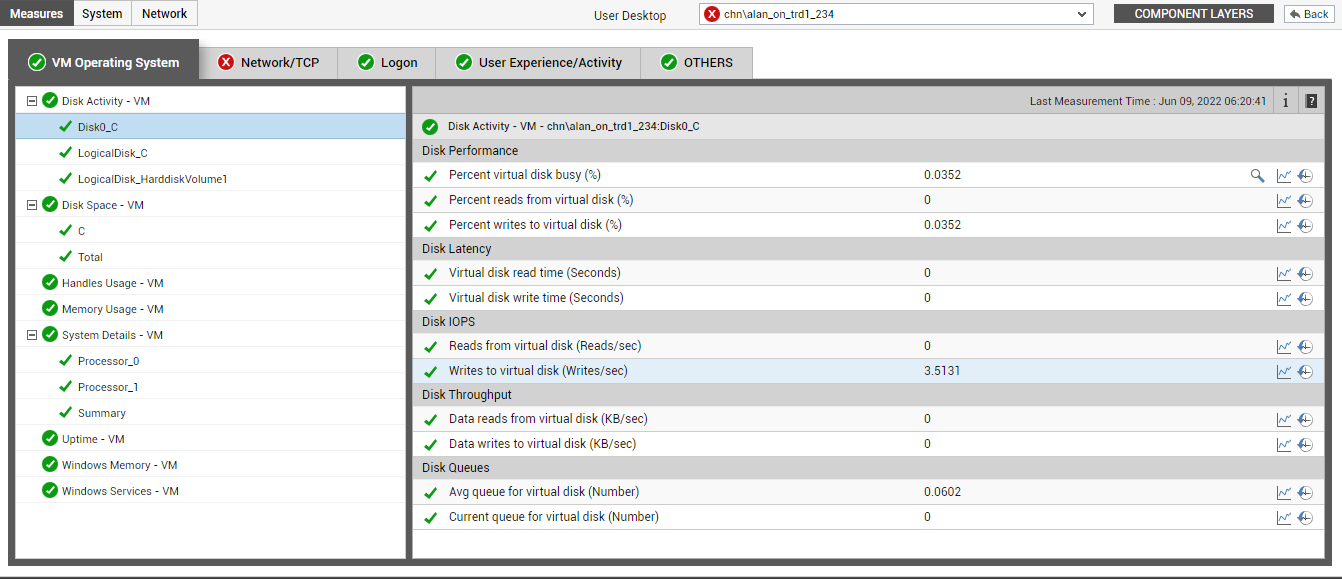
Figure 6 : The measures pertaining to a particular desktop
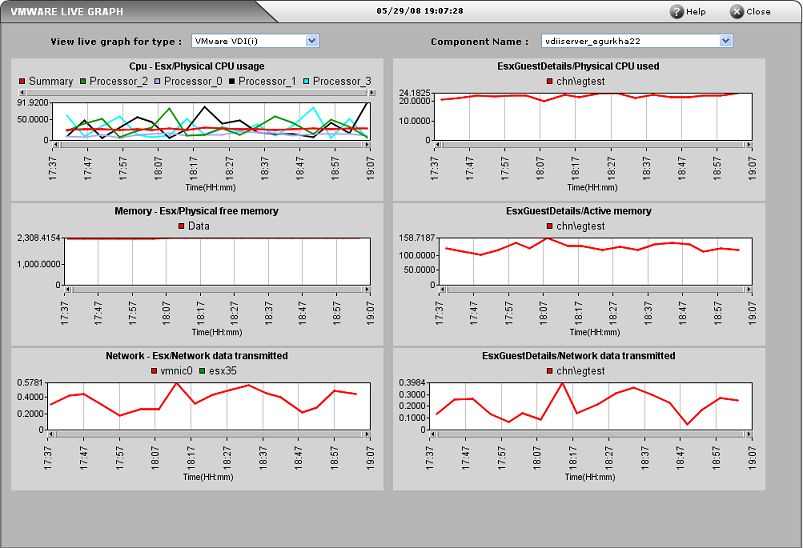
You can also view live graphs of pre-configured measures pertaining to an ESX server host and the virtual desktops configured on it, by clicking on the live graph button in Figure 5. Alternatively, you can click on the  icon that appears adjacent to the Outside View of VMs layer when it is clicked. The resulting graph display (see Figure 7) has been organized in such a way that next to every host-pertinent measure graph, the closely related guest-specific measure graph appears. For instance, next to the graph of the ‘CPU usage’ measure of the Cpu - Host test, you will find a graph of the ‘Cpu used’ measure of the EsxGuestDetails test. This way, you can easily compare and correlate how well the physical CPU resources are being utilized by both the ESX host and the guests. On the basis of this analysis, you can proactively isolate potential performance issues, and also determine the root-cause of the issue - is it the ESX host? or is it the virtual guest? If you access this page from the LIVE GRAPHbutton in , then, by default, you will view live graphs pertaining to the VMware vSphere VDI server. However, you can select a different virtualized component-type and a different virtualized component using the type and Component lists (respectively) in Figure 7.