This is just a quick blog to draw attention to some new and enhanced monitoring dashboards and reports we have added to eG Enterprise in our latest release (v7.5) to provide quick and powerful overviews when monitoring a range of Kubernetes technologies. As with all our dashboards, color-coded overlays provide guided drilldown for help desk operators and administrators. If a component has an issue, an amber or red indicator is overlaid to allow the viewer to click through to further diagnostic information.
As with other eG Enterprise dashboards, the new Kubernetes dashboards can be published for external viewers to provide an overview of service status and TV / Kiosk mode allows dashboards to be published to information screens, a feature often used in IT Helpdesk and support centers and by MSPs.
The new Kubernetes monitoring dashboards and reports provide a comprehensive and structured view of your entire Kubernetes ecosystem. The dashboards and reports include:
1. Kubernetes Cluster Overview Dashboard
- A high-level summary displaying all clusters, their health, and key performance metrics.
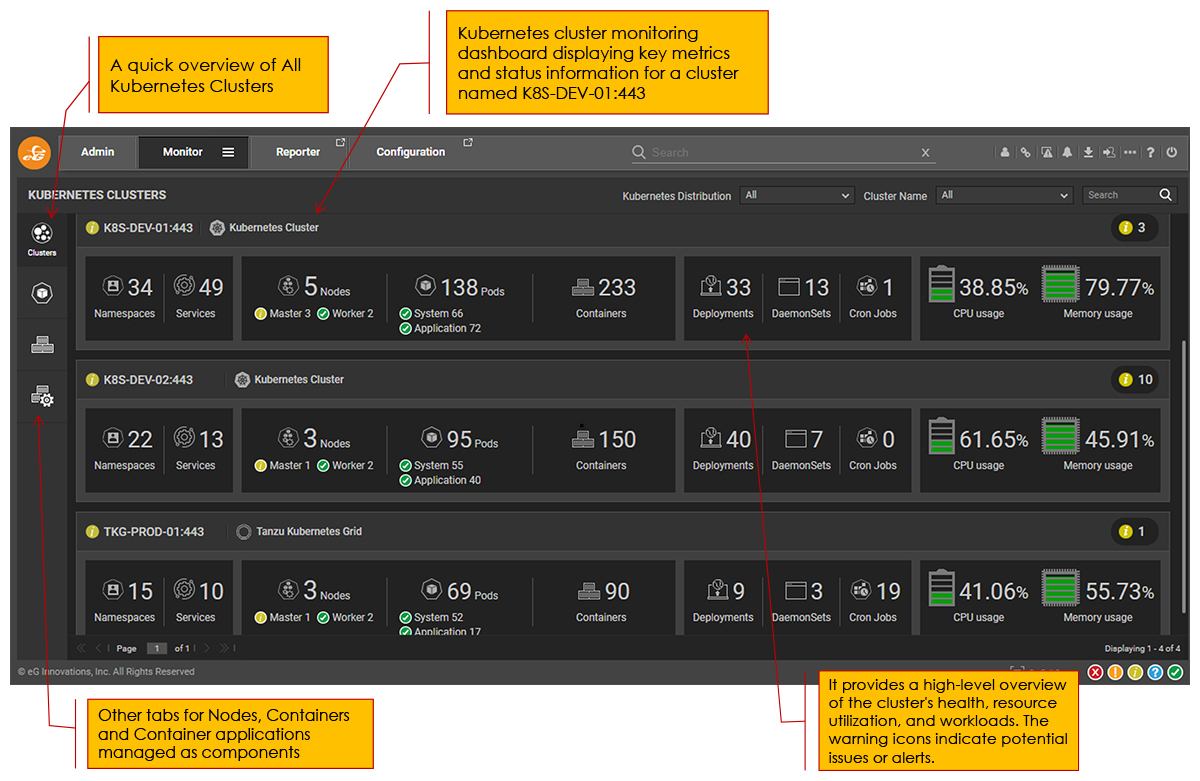
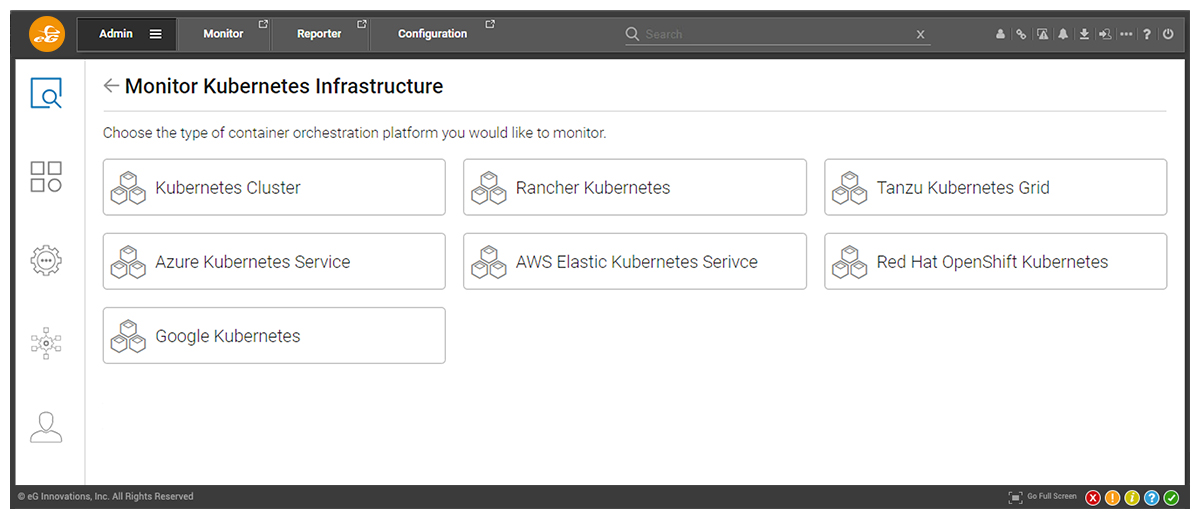
Notice that eG Enterprise can monitor multiple varieties of Kubernetes in the same way within a single console including proprietary technologies such as Tanzu and Red Hat OpenShift
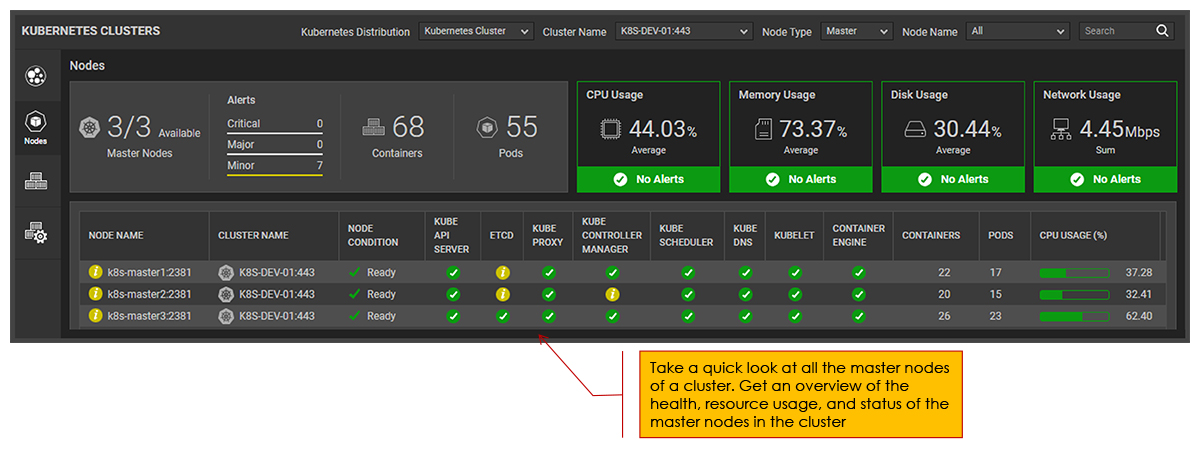
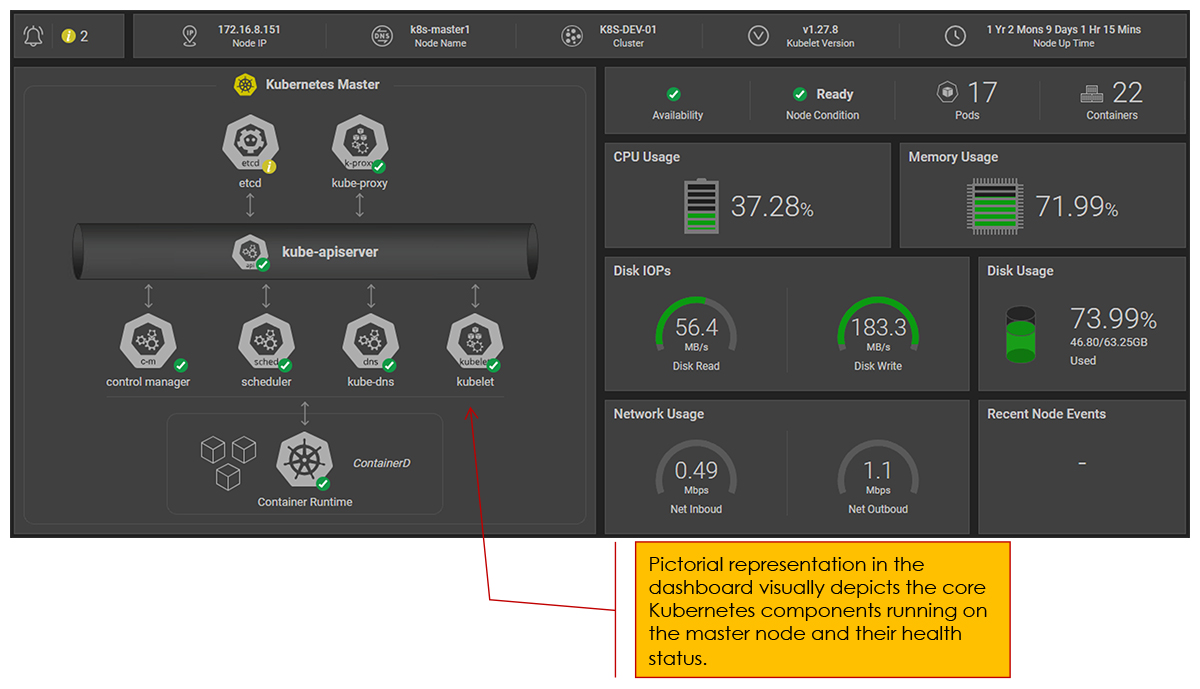
2. Kubernetes Master Node Monitoring Dashboard
-
Master Node Summary: A list view showing all master nodes with status indicators.

-
Detailed Master Node View: A pictorial representation of each master node’s internal components, including API server, etcd, scheduler, and controllers, along with real-time health status.

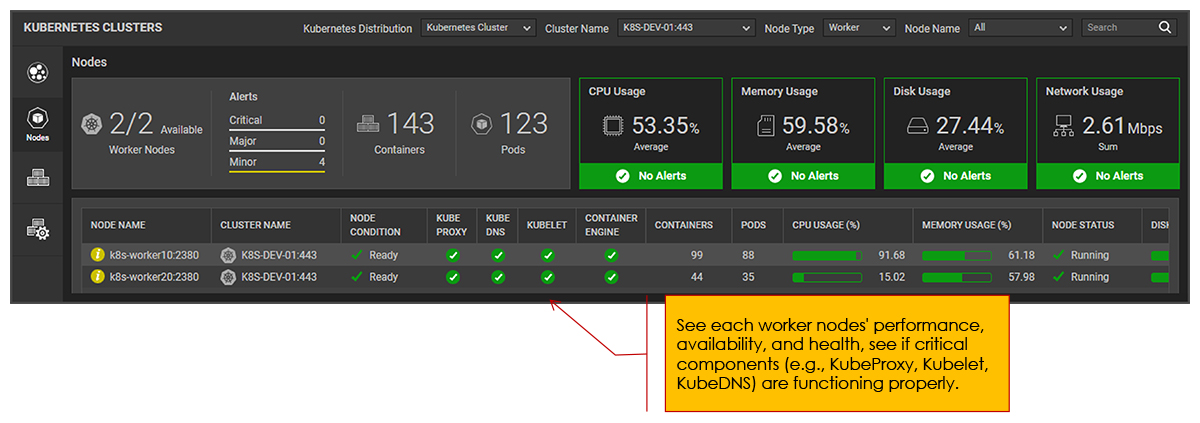
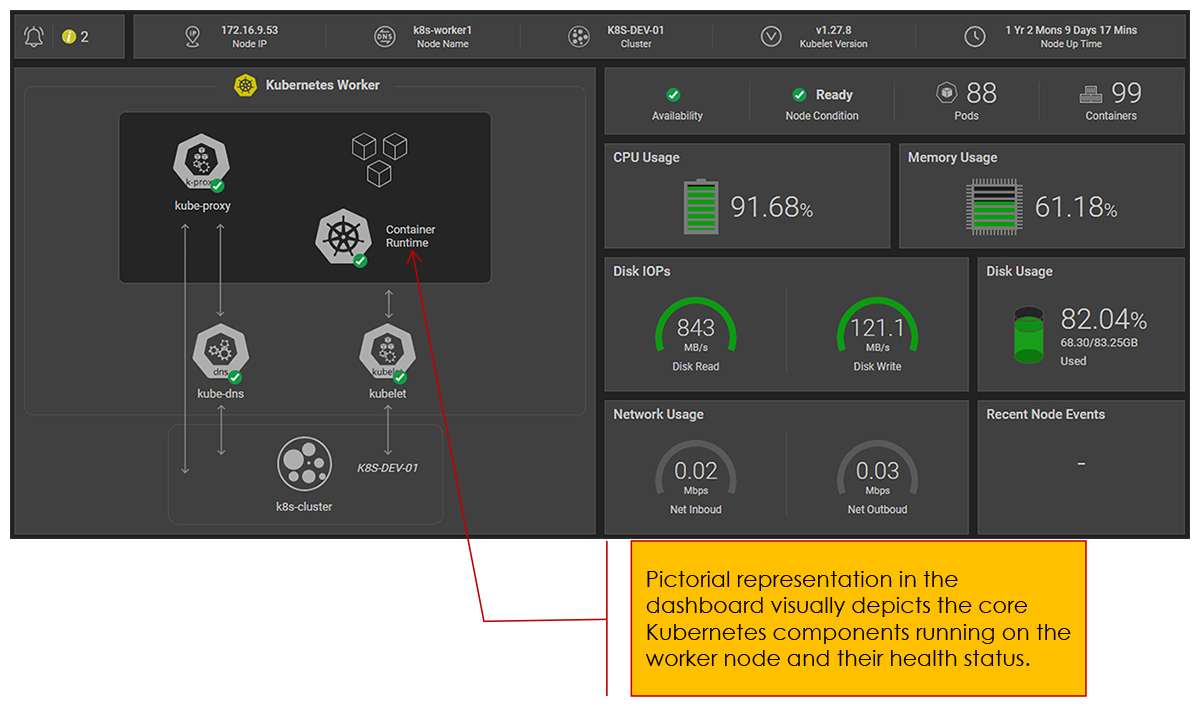
3. Kubernetes Worker Node Monitoring Dashboard
-
Worker Node Summary: A list of all worker nodes with key metrics.

-
Detailed Worker Node View: A deep dive into individual worker nodes, showing core components like Kubelet, Kube-Proxy, and the container runtime, along with system health indicators.


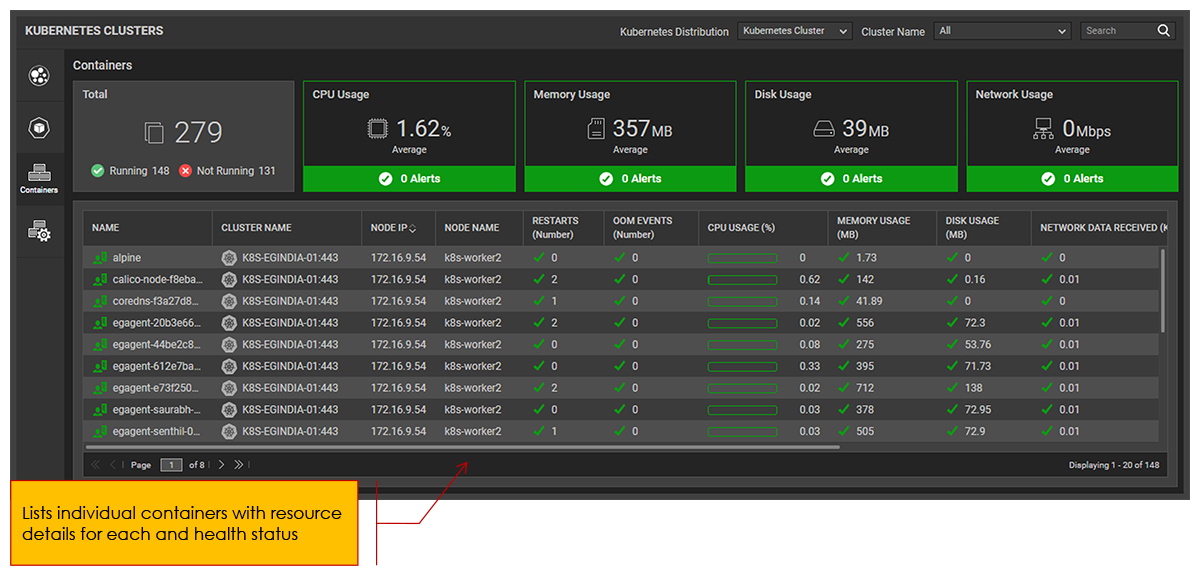
4. Containers Overview Dashboard
-
Aggregated and individual insights into all running containers, including resource utilization, health checks, and performance trends.

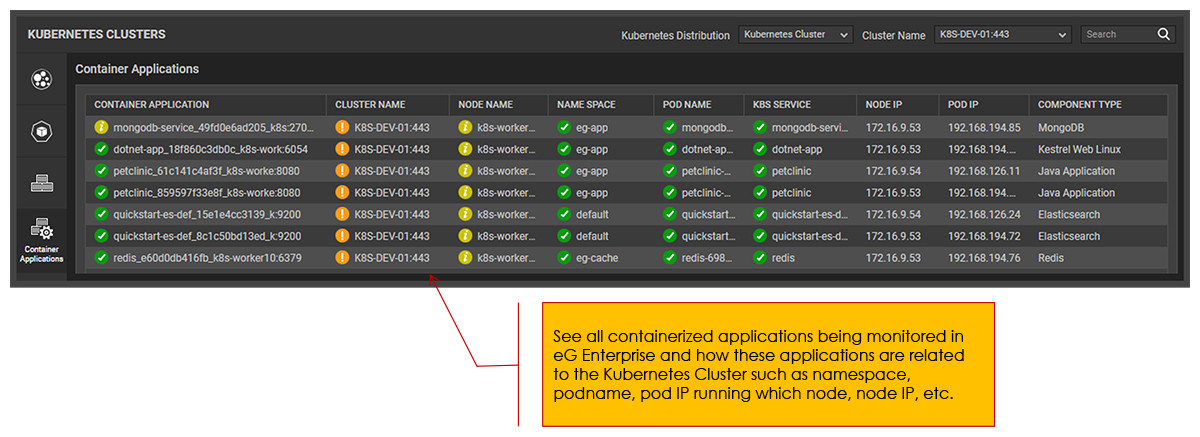
5. Containerized Applications View Dashboard
-
A structured display of applications running within Kubernetes, categorized by namespaces and workloads.

- Real-time monitoring of application performance, availability, and managed deployments.
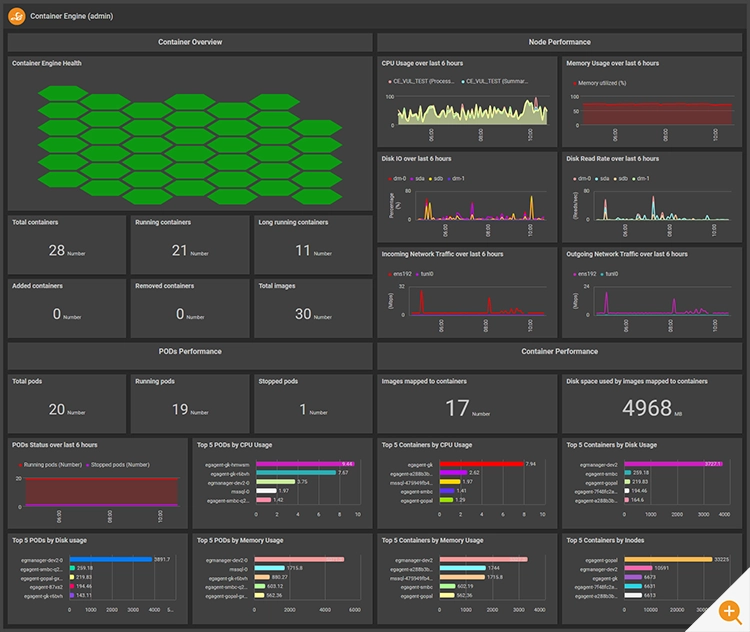
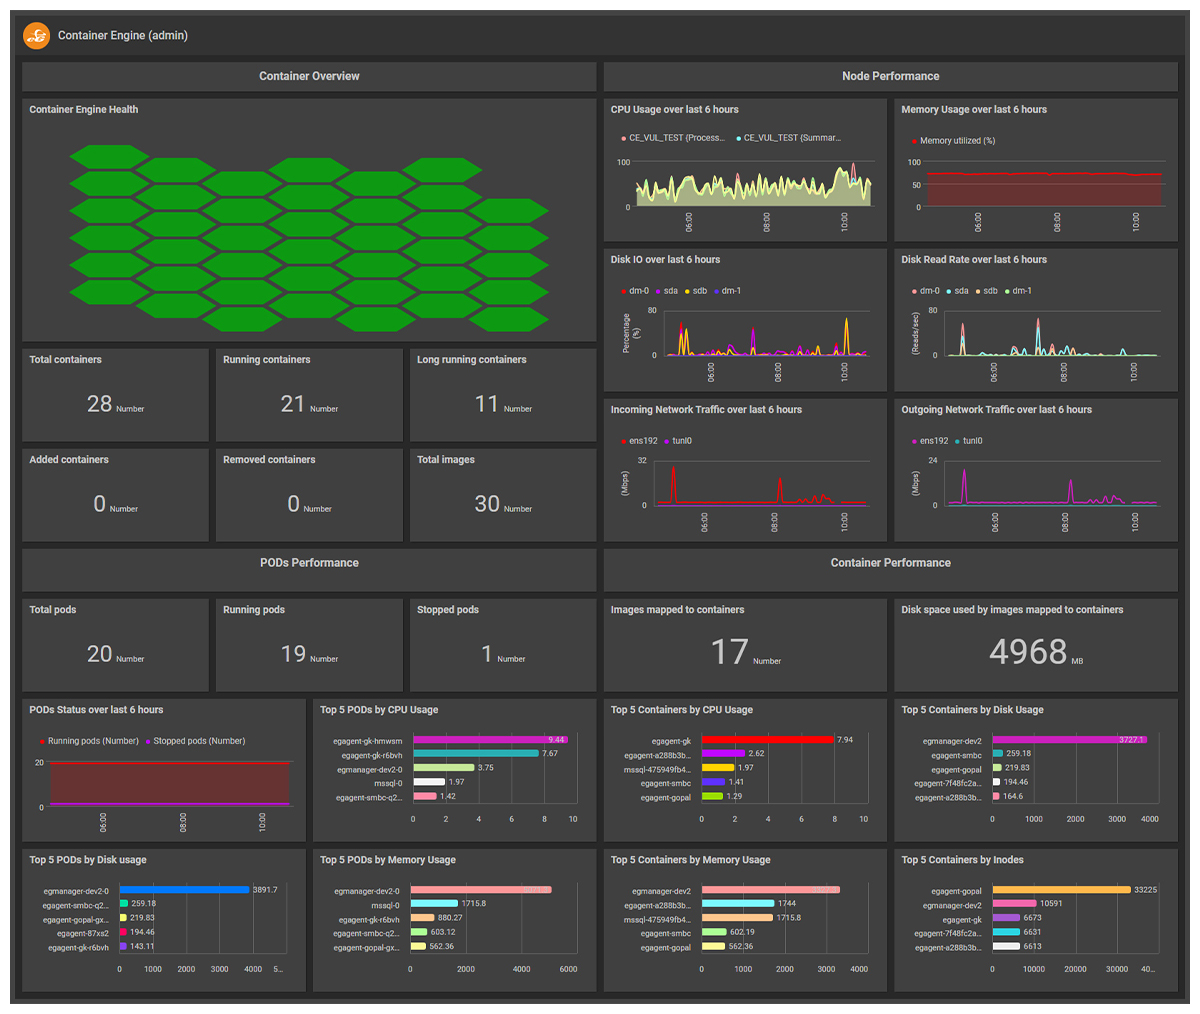
6. Container Engine Monitoring Dashboards
-
Simple out-of-the-box dashboards provide a view of Container Engine health
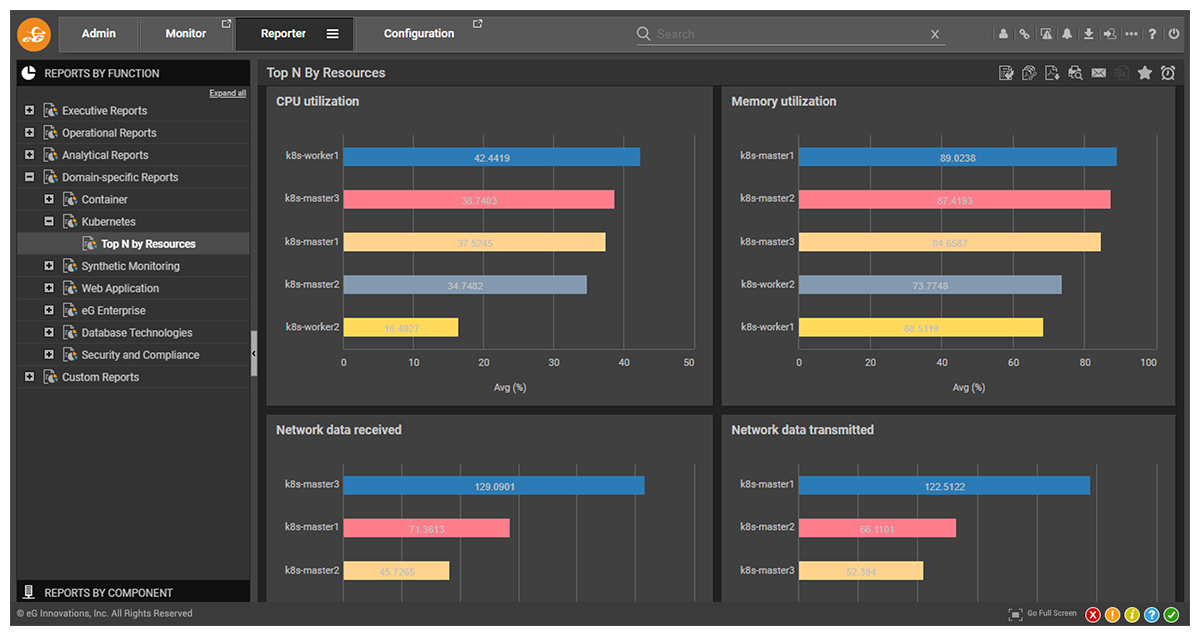
7. New Reports – Top N nodes report for a K8s cluster
Out-of-the-box reports for both live and historical data allow admins instant access to Kubernetes performance data without the need for any query languages.
eG Enterprise is an Observability solution for Modern IT. Monitor digital workspaces,
web applications, SaaS services, cloud and containers from a single pane of glass.
eG Enterprise is an Observability solution for Modern IT. Monitor digital workspaces,
web applications, SaaS services, cloud and containers from a single pane of glass.
Learn more
- To learn more about eG Innovations solutions for monitoring Kubernetes, see: Kubernetes Monitoring Tools | eG Innovations
- To learn more about the key metrics to monitor in Kubernetes environments, see: Kubernetes Monitoring & OpenShift Monitoring Metrics | eG
- Wondering how Kubernetes and Docker interact? See: Kubernetes vs. Docker: Key Differences Explained | eG Innovations
 Rachel has worked as developer, product manager and marketing manager at Cloud, EUC, application and hardware vendors such as Citrix, IBM, NVIDIA and Siemens PLM. Rachel now works on technical content and engineering and partner liaison for eG Enterprise