 English

Enterprise networks have outgrown the flat, predictable topologies they were built on. Traffic now crosses on-premises data centers, multiple public clouds, SD-WAN links, and the home connections of a distributed workforce. When any one of those segments degrades, the business feels it as slow applications, failed transactions, and frustrated users — long before anyone confirms the network is the cause. This is why network performance monitoring tools have become a core part of the IT operations stack, not an optional add-on.
Network visibility is really about business continuity. A switch buffer overrun or a saturated WAN link can stall a revenue-generating application as effectively as a code defect. The job of network monitoring software is to surface those conditions early, quantify them, and point teams to the root cause so service stays available.
What Are Network Performance Monitoring Tools?
Definition and Core Functions
Network performance monitoring tools continuously track the health, availability, and performance of the devices and links that carry traffic across an enterprise — routers, switches, firewalls, load balancers, wireless access points, and more. Their core functions are to detect faults, measure performance against expected norms, alert the right people, and provide the diagnostic detail needed to fix problems — ideally across heterogeneous environments rather than a single vendor’s hardware.
How Network Monitoring Software Works
Most tools collect data using a few established mechanisms. SNMP polling queries devices at regular intervals to gather usage and performance statistics, while SNMP traps let a device push an alert the moment an abnormal event occurs — the two are complementary. Learn more about SNMP traps and polling, see: SNMP Monitoring Made Scalable, Reliable, and Extensible.
Flow technologies such as NetFlow reveal which conversations consume bandwidth on each interface, and many modern devices expose REST APIs that return richer data than SNMP’s tabular format. The tool aggregates these inputs, compares them to thresholds or learned baselines, and raises alerts when something deviates.

Key Metrics Monitored
A few metrics do most of the diagnostic work, and tracking them over time is what separates a noisy alerting system from a useful one:
- Bandwidth utilization — how much of each link’s capacity is in use, and which sources and destinations are driving it.
- Latency — the delay a packet experiences traversing the network, ideally measured hop by hop.
- Packet loss — drops caused by congestion, errors, or failing hardware, which force retransmissions and degrade applications.
- Jitter — variation in latency, which is especially damaging to voice, video, and real-time traffic.
Device-level signals — CPU and memory usage, interface availability, CRC errors, and hardware status — add the context needed to explain why those network metrics moved.
Common Network Performance Challenges
Network Congestion and Bottlenecks
When demand on a link or device exceeds capacity, queues build, packets drop, and latency climbs. Bottlenecks are often intermittent and tied to specific traffic patterns, which makes them hard to catch without continuous monitoring.
WAN and Remote Office Performance Issues
WAN links between headquarters, branch offices, and data centers are often the slowest and most expensive part of the network. Limited bandwidth, distance-induced latency, and contention from backup or replication traffic can degrade an entire site, often with no local symptom.
Cloud Connectivity Problems
As workloads move to public cloud and SaaS, traffic increasingly leaves the corporate perimeter over paths that IT does not fully control. Latency to a cloud region, an overloaded gateway, or a peering issue can slow critical services while every internal device reports healthy.
Application Slowdowns Caused by Network Latency
Users rarely report “the network is slow” — they report that an application is slow. The network is a common culprit, but proving it requires correlating application response time with the latency, loss, and jitter on the paths that application depends on. Without that correlation, teams investigate the wrong tier.
Key Features to Look for in Network Monitoring Software
Real-Time Traffic Visibility
The tool should show what is happening on each interface right now — utilization, top talkers, and protocol-level breakdowns — so teams spot a developing problem rather than reconstruct it after the fact.
Network Topology Mapping
Automatic discovery of devices and how they connect gives operators a live map of the environment. Topology awareness lets the software distinguish a root-cause failure from its downstream effects, preventing a single outage from generating dozens of redundant alerts.
AI-Driven Anomaly Detection
Static thresholds miss problems that fall within “normal” absolute ranges but are abnormal for a given device at a given time. Software that auto-baselines each metric and flags deviations catches issues — abnormal traffic patterns, buffer overruns, queue drops — before they become business-impacting.

Root Cause Analysis Across Infrastructure
Network faults rarely stay contained to the network. The most valuable tools correlate network behavior with the servers, storage, and applications that depend on it, so a single investigation reaches the actual cause instead of stopping at the network boundary.
Historical Performance Reporting
Trend analysis and forecasting turn monitoring into planning. Historical data supports capacity decisions, proves SLA compliance, and reveals slow degradations that real-time views alone would miss.
Why Modern Enterprises Need Network Performance Monitoring Tools
Supporting Hybrid Work Environments
A distributed workforce depends on VPNs, gateways, and SaaS reachability between the user and the application. Network performance monitoring tools give IT the visibility to keep remote and in-office experiences consistent when the “network” now extends to thousands of home connections.
Ensuring SaaS and Cloud Application Performance
Business now runs on services like Microsoft 365, Salesforce, and ServiceNow. Monitoring the paths and gateways to those services helps teams tell a provider problem from a local one, and respond accordingly.
Reducing Downtime and Service Interruptions
Pre-emptive alerting on early indicators — rising packet drops, climbing latency, failing interfaces — lets teams act before an issue escalates into an outage. Catching the condition early is what protects mission-critical services.
Improving End-User Experience
Ultimately, the network exists to deliver applications to people. Monitoring tied to user-facing performance keeps the experience fast and reliable — the outcome the business actually measures.
Best Practices for Network Monitoring
Establish Baseline Network Metrics
Capture what “normal” looks like for each device and link across daily and weekly cycles. Baselines make anomaly detection meaningful and stop alert fatigue from arbitrary thresholds.
Monitor Critical Network Paths
Not every link deserves equal attention. Identify the paths that carry revenue-generating and mission-critical traffic, and instrument them most closely — including WAN and cloud connectivity.
Use Automated Alerts and Thresholds
Configure alerts that account for normal variation and route them to the right team. The goal is timely, actionable notification — not a flood of noise that trains people to ignore it. Learn more about best practices for setting alerts and configuring thresholds, see: White Paper | Make IT Service Monitoring Simple & Proactive with AIOps Powered Intelligent Thresholding & Alerting.
Correlate Network and Application Performance
Treat the network as one tier in a larger service. Correlating network metrics with application and infrastructure performance is the single biggest accelerator of root cause analysis, because it removes the guesswork about where a problem lives.
How eG Innovations Helps Monitor Network Performance
Unified Infrastructure and Network Visibility
eG Enterprise monitors network availability, faults, performance, and usage from one console, alongside the servers, storage, cloud, containers, and applications the network supports. It consolidates siloed tools into a single pane of glass, so network performance is never viewed in isolation from the services that depend on it.
AI-Powered Root Cause Detection
Built-in AIOps auto-discovers network devices and topologies, auto-baselines every metric, and alerts on abnormal usage or traffic patterns. By mapping interdependencies and differentiating cause from effect, eG Enterprise helps teams reach the root cause faster and lower MTTR.
End-to-End Performance Correlation
Because eG Enterprise spans every layer and tier and supports 650+ technologies, it automatically correlates network performance with application and infrastructure performance. When an application slows, teams can see whether the network — or another tier — is responsible, without switching tools.
Real-Time Network Analytics
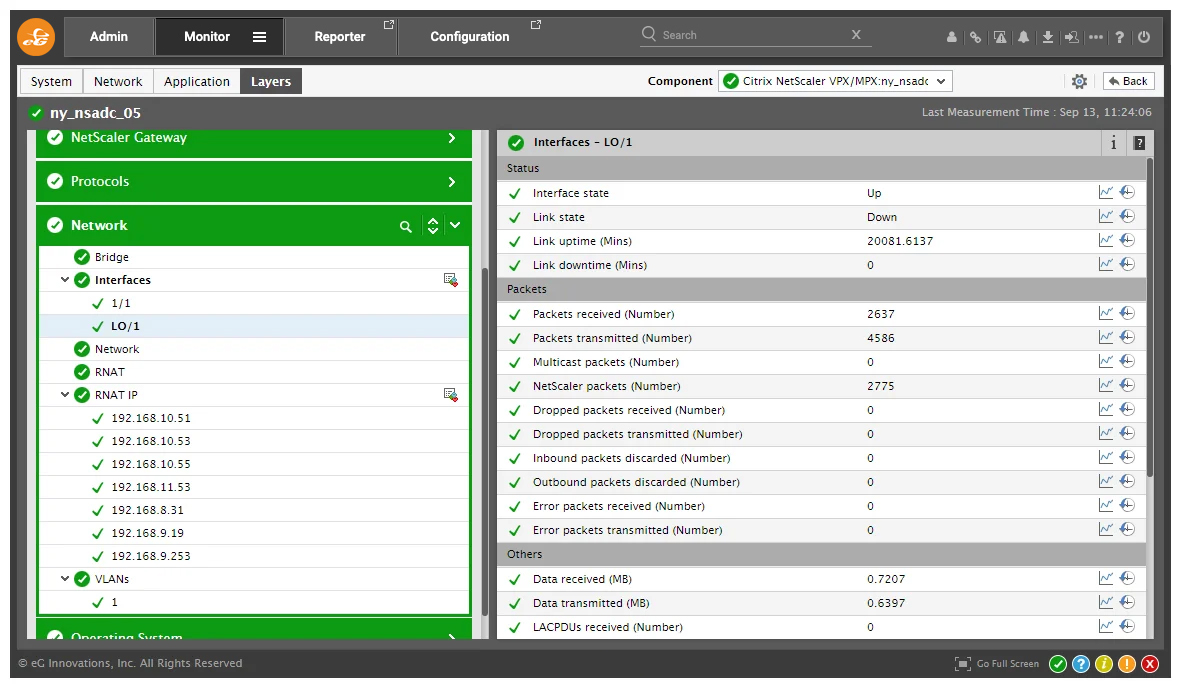
eG Enterprise polls SNMP devices (v1, v2, and v3), receives traps, and uses the built-in NetFlow collector to report top talkers, sources, and destinations per interface. Real-time metrics — interface availability, packet drops, hop-by-hop latency, bandwidth usage, and throughput — give operators the detail to act as conditions change. Learn more: Network Device Monitoring Reliability | eG Innovations.
Conclusion
Modern networks are too distributed, too hybrid, and too business-critical to monitor in isolation. The most effective network performance monitoring tools do more than watch interfaces — they connect network behavior to the applications and infrastructure that depend on it, so teams find the root cause fast and keep services running. To see how that unified view works in practice, explore how eG Enterprise brings network and application visibility into a single console — and what it could reveal about your own environment.
eG Enterprise is an Observability solution for Modern IT. Monitor digital workspaces,
web applications, SaaS services, cloud and containers from a single pane of glass.
Frequently Asked Questions
They are software solutions that continuously track the availability, health, and performance of network devices and links — routers, switches, firewalls, load balancers, and access points. They detect faults, measure performance against expected norms, alert teams, and provide the diagnostics needed to find and fix the root cause quickly.
It collects data using methods such as SNMP polling and traps, flow technologies like NetFlow, and REST APIs on modern devices. The software aggregates this data, compares it against thresholds or learned baselines, and raises alerts when metrics deviate — giving teams real-time visibility and historical context.
Network problems quickly become application and business problems. Monitoring surfaces early indicators — rising latency, packet loss, failing interfaces — so teams can act before an outage occurs. It protects business continuity, supports hybrid work and cloud services, and shortens the time spent locating the true cause of slowdowns.
The essentials are bandwidth utilization, latency, packet loss, and jitter, since these directly affect application performance. Device-level signals add context: CPU and memory usage, interface availability, CRC errors, hardware status, throughput, and top traffic sources and destinations. Together they explain both what changed and why.
Yes. By baselining normal behavior and alerting on early anomalies, monitoring lets teams intervene before issues escalate into outages. Correlating network data with application and infrastructure performance speeds root cause analysis, which lowers mean time to resolution and keeps mission-critical services available.


