How a full stack monitoring solution helped our customer with Application Performance Troubleshooting on AWS Cloud
Summary

Here’s a myth that needs to be debunked – the cloud (e.g., AWS or Azure) will take care of my performance problems!

Our experience shows that cloud architecture usually introduces new layers of complexities that did not exist in the on-premises world. You need a modern AI-powered full stack monitoring solution to find the needle in the multi-layered haystack that is the cloud.

Sometimes, it’s the cloud vendor who has to fix the issue. An example could be a noisy or defective physical host OS that you have no access or visibility into. You need the right information in the form of logs, metrics, traces and events to substantiate with evidence in conversations with the cloud provider’s support team.

In this blog post, we describe a problem analysis and anomaly detection process for a cloud performance problem (high CPU in the JVM and SSL issues) that we encountered recently when working with a large customer, who had a significant footprint on AWS cloud.
The Cloud Does Not Make Application Performance Monitoring and Troubleshooting Simpler
 Cloud migration and digital transformation of business-critical applications on the cloud are on the rise. At the same time, some IT executives have the misconception that when applications are migrated to the cloud, monitoring their performance becomes easier. The cloud service provider (e.g., Amazon) takes care of most of the key elements that support the application, and hence, they believe that there are fewer challenges when applications are on the cloud vs. being deployed on-premises.
This is often far from true.
This case study exposes the challenges that organizations deploying applications on the cloud face when performance issues happen and how difficult it can be to diagnose such problems. While migration to the cloud does simplify and automate several routine administration activities, performance monitoring is one area that is not necessarily simplified!
The scenario covered may be useful for those evaluating the level of insight and troubleshooting capabilities various cloud tools can offer.
Target Application and Infrastructure on AWS Cloud

Our customer is a mid-sized business that offers SaaS services to clients. The SaaS application was Java-based and was hosted on AWS cloud, and relied on AWS RDS for the backend database. eG Enterprise was used by the customer to monitor the SaaS application and the AWS services in use.
The application had been operational for several months and there had been no complaints about performance.
The Initial Alert
The CPU usage of the AWS EC2 VM hosting the key application had spiked all of a sudden around 5 am and remained high for several hours:
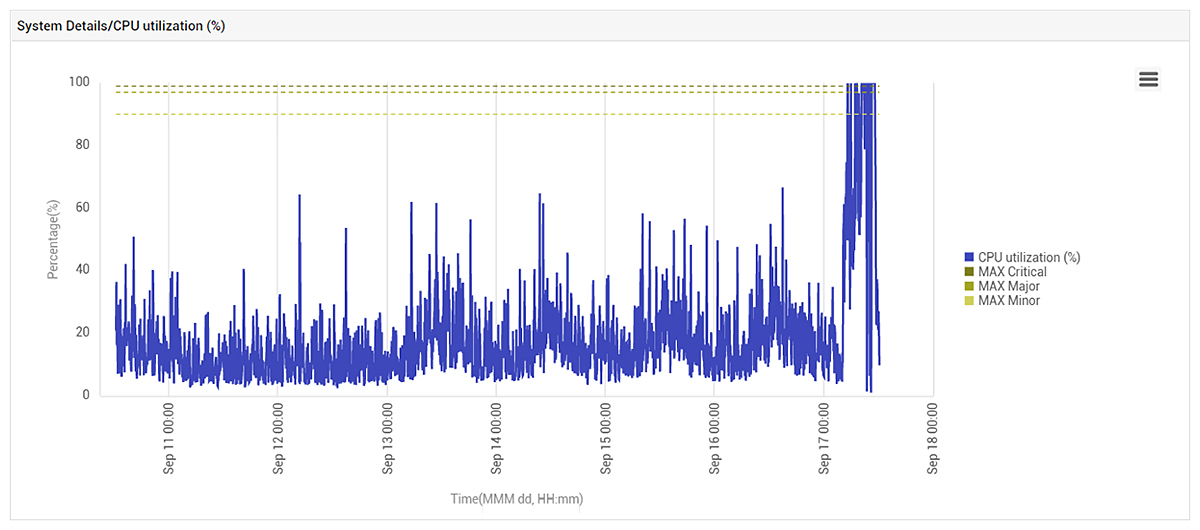
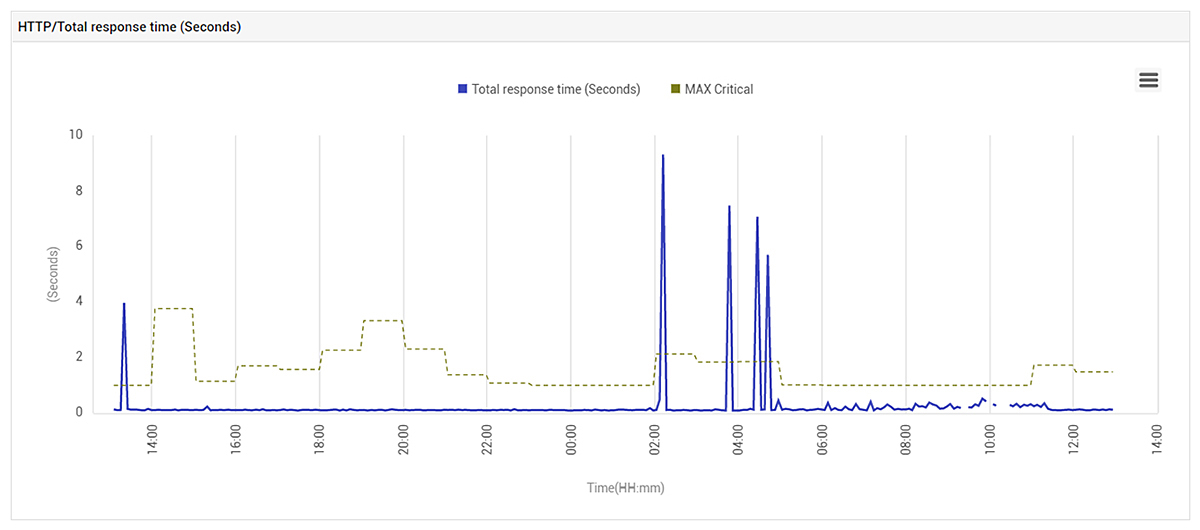
At this time, application performance also suffered. This was evident from eG Enterprise’s synthetic monitoring capability that the customer had configured to proactively detect issues before real users experience issues. Initially when the problem started, application response time was poor. Over time, you see gaps in the response time in the graph in Figure 2 because the application became unavailable.
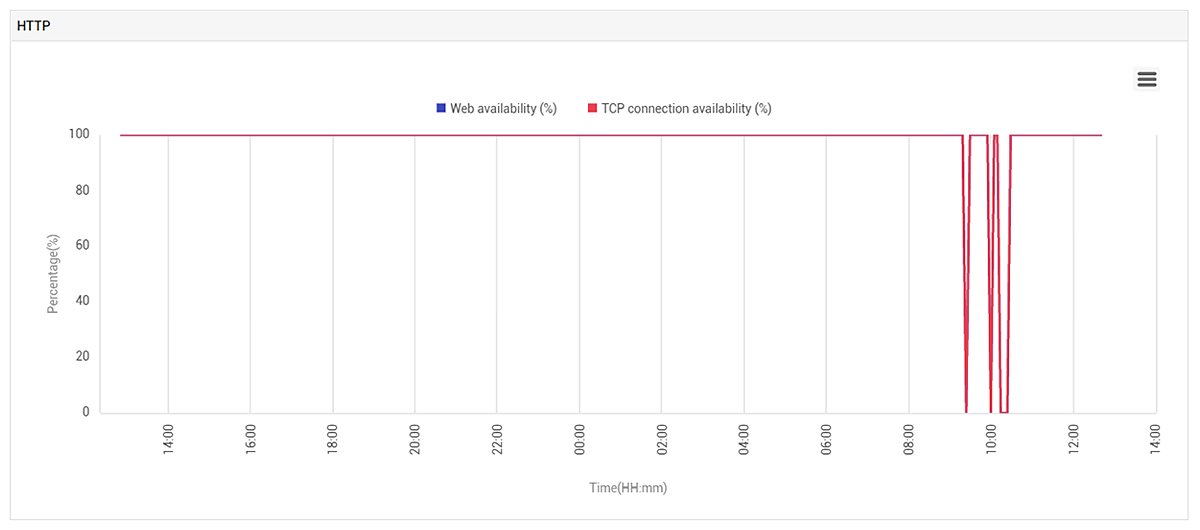
Below is the graph of application availability during the same time scale. You can clearly see TCP connection availability dropping to zero several times indicating that users were not able to connect to the application. This information was also highlighted in critical alerts sent to administrators and displayed on the overview dashboards in eG Enterprise to enable actionable notification.
Analyzing Application Performance in Detail
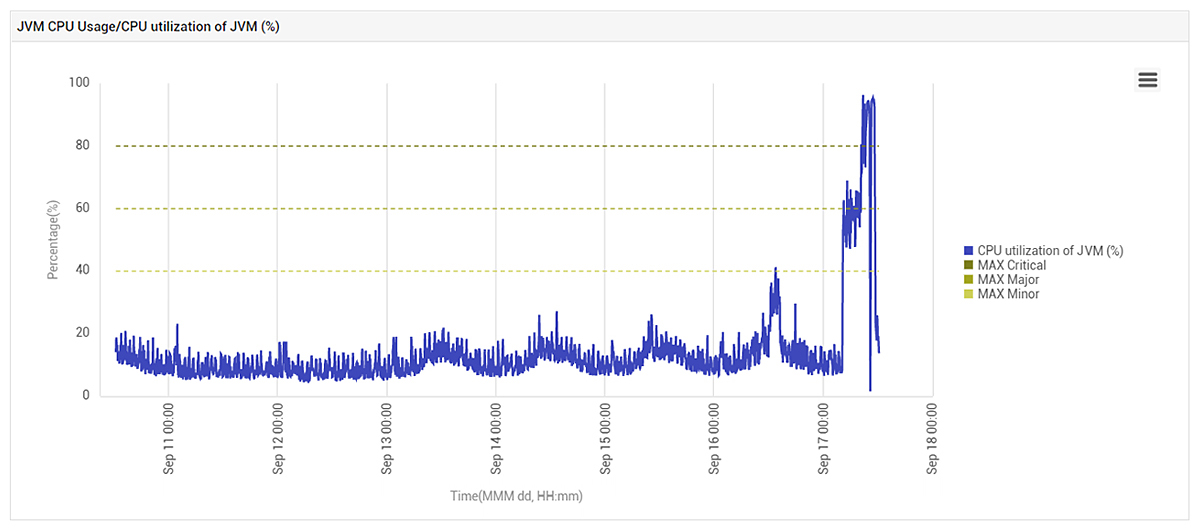
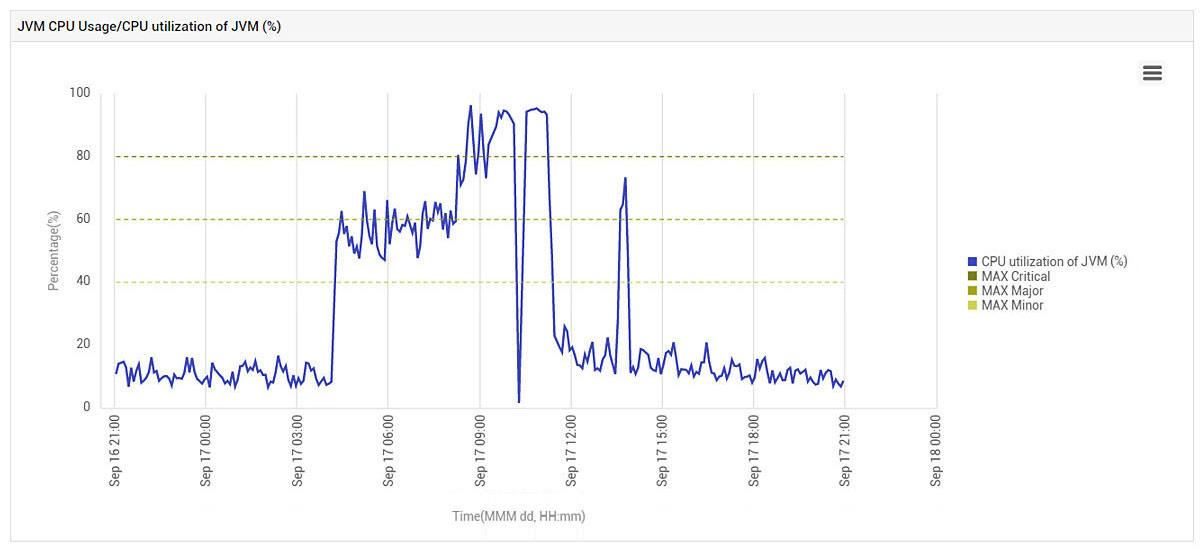
To further analyze the problem, we analyzed the application performance in detail. Figure 4 below shows the CPU usage of the JVM (Java Virtual Machine) used by the application on the problematic AWS VM. The JVM CPU usage follows the same pattern as the VM’s CPU usage, indicating that the application’s JVM had been affected.
High CPU usage within the JVM can have numerous causes and often it can be a symptom of bugs within the Java code of the application. High CPU is a symptom – not a root cause. Reasons for high CPU could range from host OS issues, poorly sized JVMs, memory leaks to code-level deadlocks. My colleague has written a blog covering some common problems, see: How to Troubleshoot Java CPU Usage Issues | JVM High CPU Threads (eginnovations.com).
The impact of Java Garbage Collection on application performance
Java Garbage Collection (GC) is intrinsically a CPU intensive operation.
 When Java GC happens, all application threads are paused. Most Java GC algorithms (including the latest G1GC) must halt all application threads, a process referred to as stopping-the-world (STW) or pausing (a GC pause).
The JVM (Java virtual machine) takes over all the computer’s cores to perform GC and reclaims memory before restarting the application threads.
Best Practice: Look for full stack monitoring tools that can help you diagnose high CPU root-cause across various layers and tiers – Operating System, JVM (threads/ heap), application code and connect the dots to the affected business transactions so you can quantify business impact. Full stack tools can correlate GC activity at the JVM level, thread activity at the code level and CPU utilization% even at a request-by-request level. This will help you triage faster and engage the right team to fix the issue.
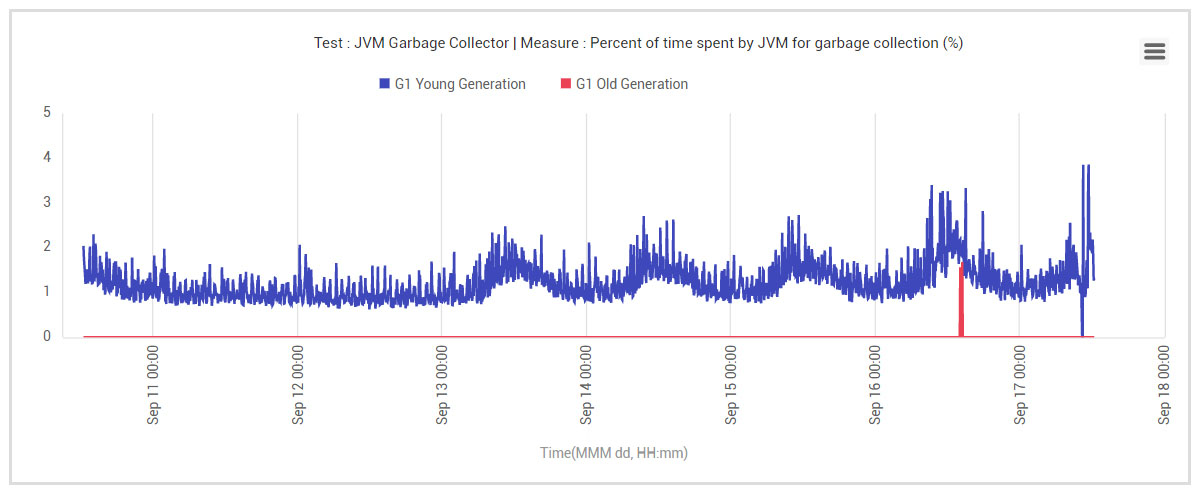
The JVM Garbage Collector (GC) can also be a source of high CPU, especially if application memory leaks are at play. The JVM knowing that it is running low on key resources, such as heap memory can get itself into a state where it keeps trying to desperately reclaim memory. A quick check eliminated the possibility of a GC issue in this case. See Figure 5, which shows the historical usage of GC in the JVM. The percentage of time spent by the JVM on GC activities had not changed significantly during the problematic period. Hence, GC activities were not the reason why the application’s CPU usage had spiked.
Java threading issues are a common problem that cause application problems. So, the next step was to check if there were common threading issues present, and if so, were these root cause issues or simply manifestations and symptoms of issues elsewhere. Unfortunately, both are common possibilities!
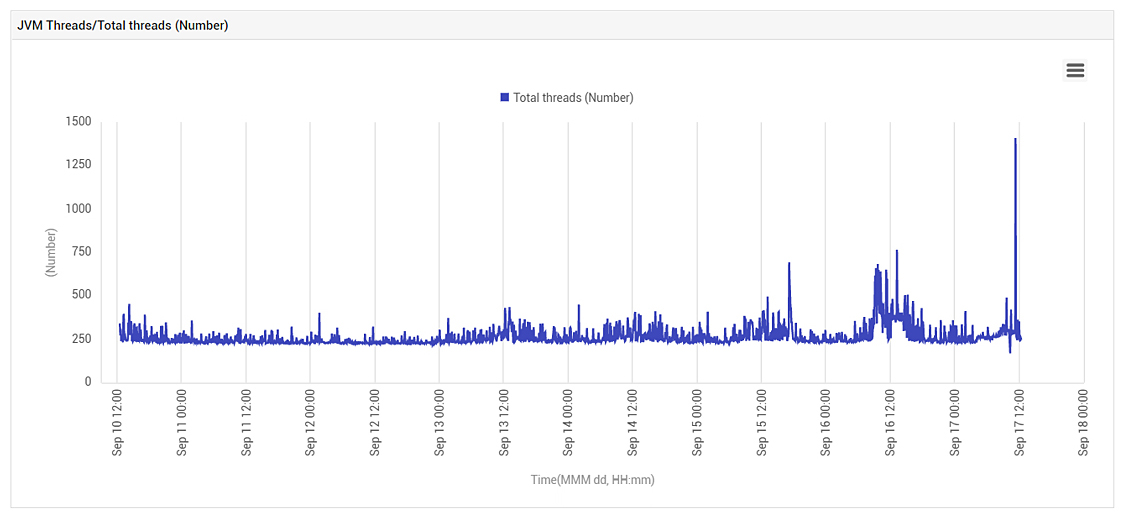
Figure 6 shows the total number of threads in the JVM over time. While there had been an increase, the increase was not too significant. This indicated that application processing in the JVM was not the issue.
3 Use Cases for which continuous thread analysis is key
 Use case #1: Identify the dreaded Achilles heel of threaded applications – locks and deadlocks that impact your scalability.
Use case #2: Automatically identify CPU-hungry threads and thread groups. On the cloud, CPU is money.
Use case #3: Pinpoint the root-cause of the thread anomalies to the specific processes and microservices so the right team can be alerted to fix the issue.
The Java Thread Analysis modules within eG Enterprise further indicated that no specific thread in the JVM was taking a lot of CPU. There were many threads, each taking a small amount of CPU – 1-2%, but a number of these threads caused the overall CPU to be high.
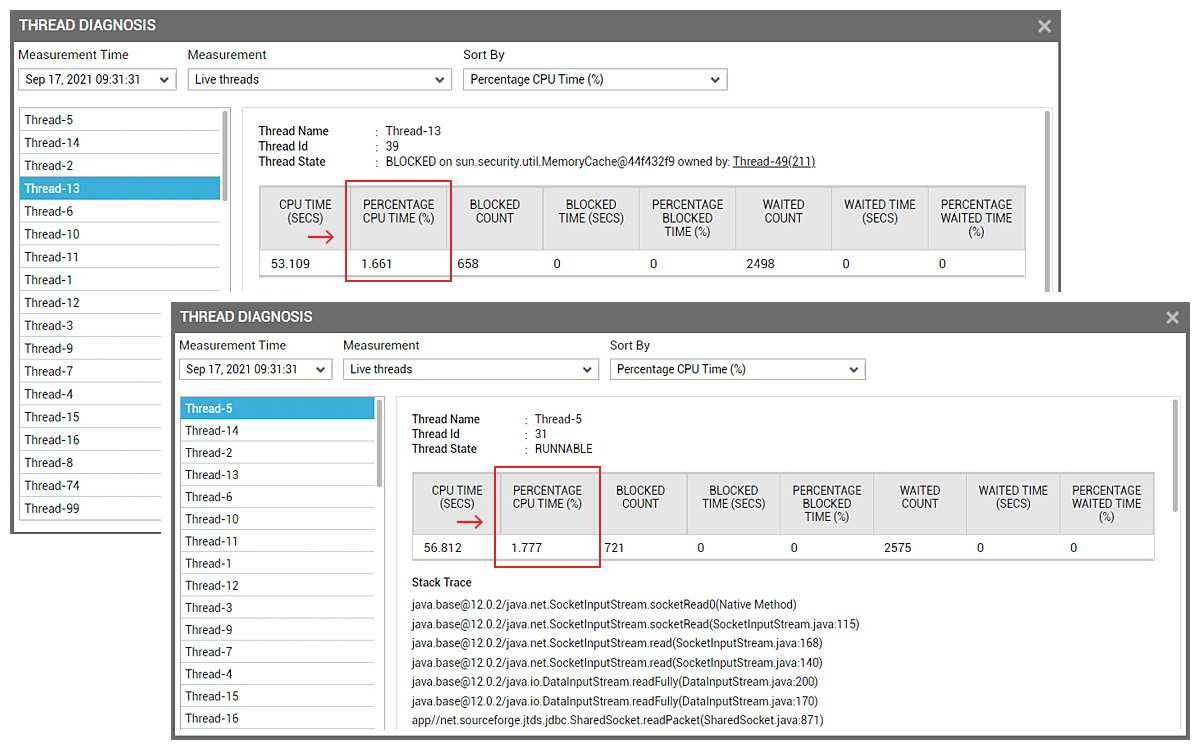
The auto-baselined thresholds for blocked threads had however triggered critical alerts when the problem happened. Reviewing the historical data, we could see that there was some significant thread blocking in the JVM, which was abnormal and anomalous. A quick check in the detailed diagnosis tool in eG Enterprise (see Figure 8) revealed there were issues in SSL processing at the JVM level – not in the application code.
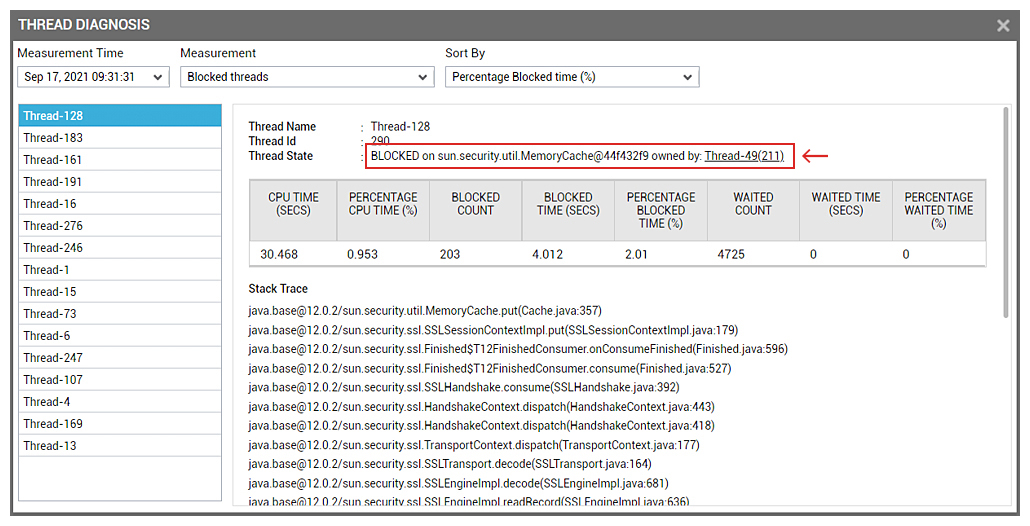
Clicking through to identify the blocking thread, showed that SSL Memory Caching in the JVM seemed to have triggered the issue (see Figure 9). Many Java threads were stuck in SSL processing – and it was this that was consuming excessive CPU.
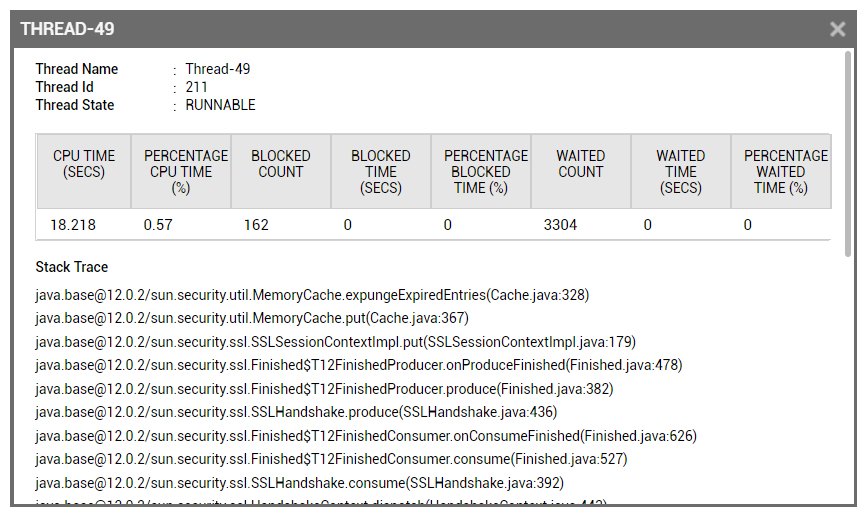
By simply googling the blocked class/method, i.e., “sun.security.util.MemoryCache.put”, one can find a number of links that point to known Java issues:
- https://bugs.java.com/bugdatabase/view_bug?bug_id=8259886
- https://access.redhat.com/solutions/4056181
- https://bugs.java.com/bugdatabase/view_bug?bug_id=8218415
Vendor-recommended changes, such as setting different cache sizes and timeouts were attempted but the problem was not getting resolved.
Perplexed! Where is the Root-Cause?
At this point, the customer asked for our advice as they were stumped. We performed some really obvious sanity checks. Often, a customer says they “haven’t changed anything” but when you check the eG Enterprise configuration database and historical data, it tells a very different story! In this case though absolutely nothing had changed in the application for several weeks. The application code had been working fine for months. No patches had been deployed at the application level or the OS level. It was all rather mysterious!
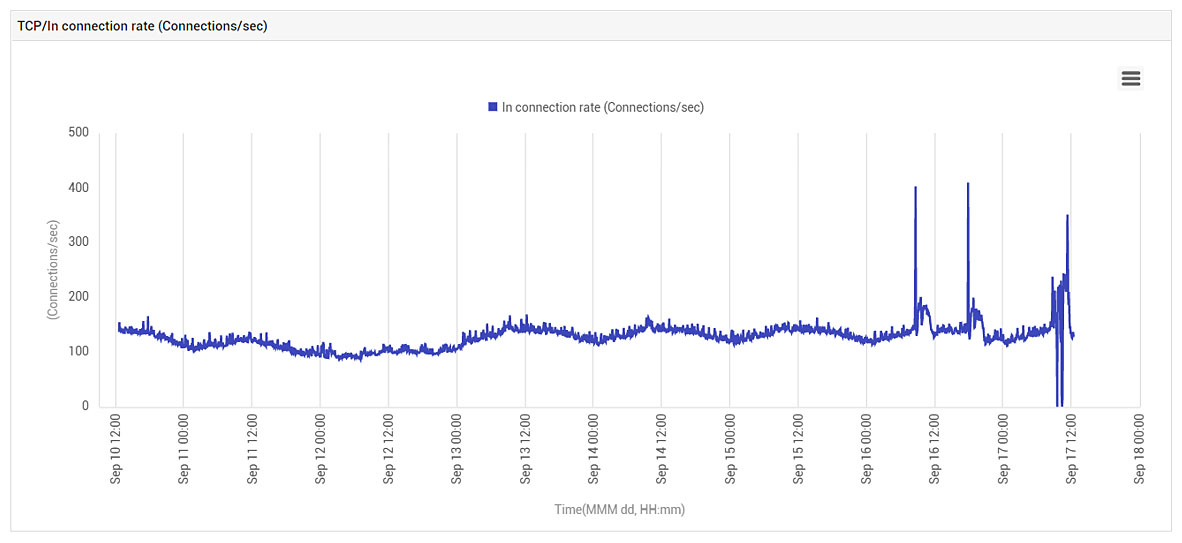
Could there have been an SSL attack? No – TCP connections’ activity didn’t change by much (see Figure 10):
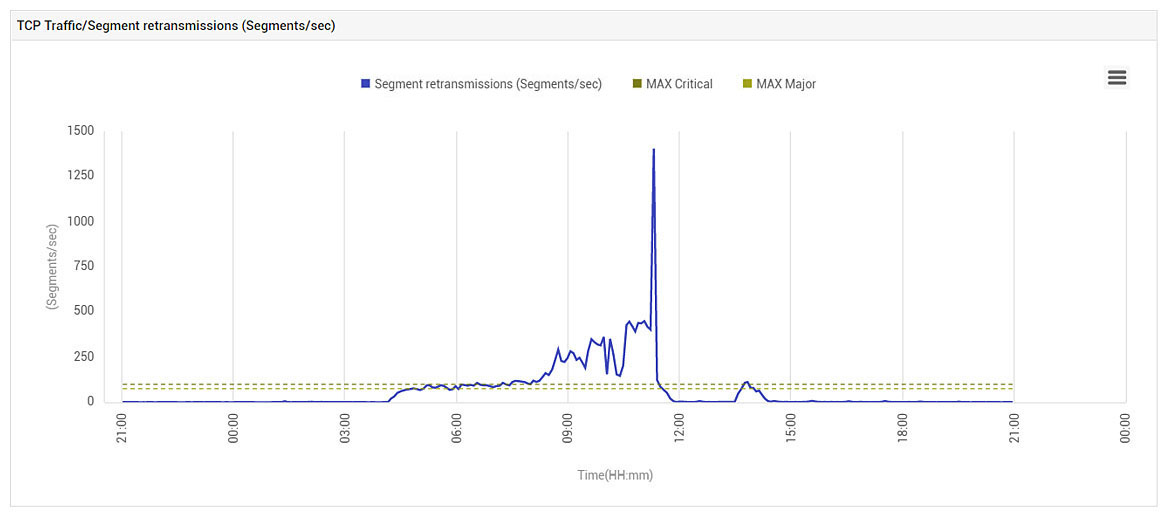
We checked what other alerts had been triggered around the time of the incident. BINGO! We got our clue – TCP retransmissions had increased significantly around the same time (see Figure 11).
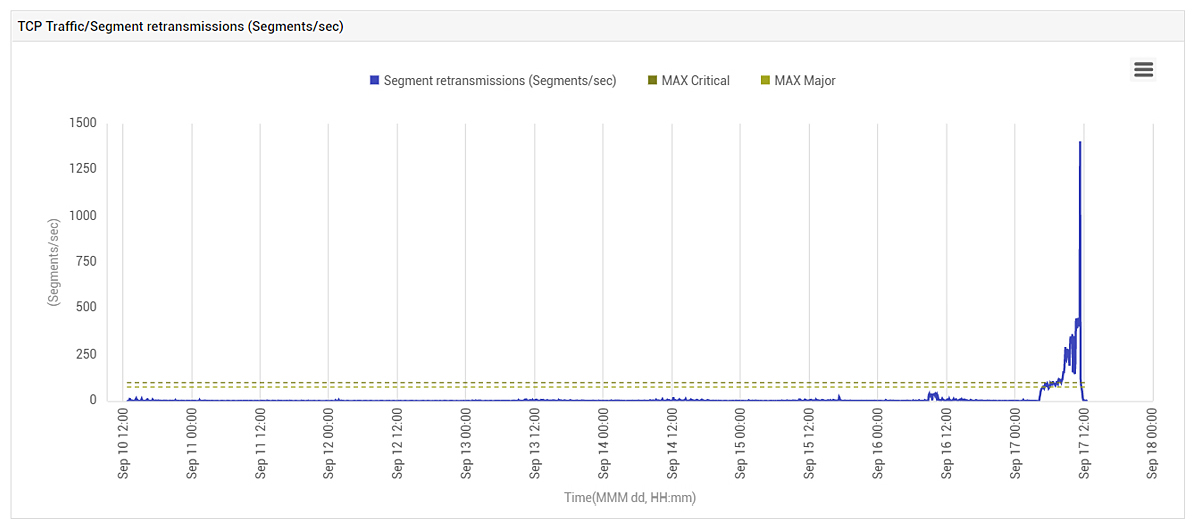
1 to 5 segments retransmitted per second used to be normal for this application. Observe that the value had risen to over 200 segments/sec when the problem happened (see Figure 11). That’s a 40-fold increase! There was also a clear correlation between TCP Retransmissions increased right around the time system CPU shot up. eG Enterprise uses historical data within an AIOps engine to set meaningful thresholds to enable anomaly detection. By learning what is normal for an application or infrastructure, anomalies within dynamic environments can often be detected early (read more).
A primer on TCP packet retransmissions and how they impact system performance
What are TCP Retransmissions?

The TCP enables two hosts to establish a connection and exchange streams of data. TCP guarantees delivery of data and also guarantees that packets will be delivered in the same order in which they were sent.
TCP retransmission refers to the process of resending packets over the network that have been either lost or damaged. Retransmission is a mechanism used by TCP to provide reliable communication.
When does retransmission happen?
 Retransmission happens when the TCP receiver determines that an error has occurred during communication and subsequently does not transmit an “ACK” (acknowledgment) to the sender.
The sender will then retransmit the lost or damaged packet. Once the receiver determines that it has received a packet successfully, an “ACK” will be sent to the sender.
Why do TCP retransmission happen?

TCP retransmissions can be caused by a number of networking issues:
- Poor or lossy network connection is a common cause.
- Faulty NIC card or driver on the sender or recipient OS can result in packet losses.
- Issues with firewalls and proxies that lie on the path between the sender and the receiver can cause retransmissions.
- When a router on the intervening network path is heavily loaded, it might have buffer overruns leading to lost packets.
- Network congestion in a LAN can also cause network packet loss.
- Different TCP segments from the sender can take different routes to reach the receiver and the delays between the routes could be so significant that the receiver believes it cannot handle a large number of out of order packets.
- In a virtual environment, hypervisor issues can also lead to packet loss during VM-to-VM communication.
How do they impact system performance?
When packet loss over the network is significant, it can result in several abnormalities:
 Existing SSL connections could be dropped, and new connections must be established. This adds to latency and also processing overhead on the endpoints. SSL/ TLS handshakes which have to happen for each new connection involve certificate exchanges between the endpoints and they take up CPU resources.
Applications on the end points may have a cache of SSL connections currently established. When network issues happen, they cause connections to linger for longer. Connections could also stay in the negotiation phase for longer. This could result in the memory cache of SSL connections on the endpoints being larger than usual. This could result in increased memory requirements on the end points. As the memory requirement increases, it could trigger garbage collection which could trigger CPU usage. Also, larger the memory cache, more time it takes for concurrent accesses to the cache and to reorganize the cache when a connection starts or ends. This also adds to the CPU usage on the endpoints.
 Best practice: Track logs, metrics, traces and events in a unified manner, so you get the complete picture of performance anomalies in a system.
The customer had a premier support contract with the cloud service provider. When they contacted the service provider’s support desk, they were told that there were no issues at their end. When the customer provided the data collected to show the excessive TCP retransmissions, the support desk suggested a system reboot to force the VM to move from one physical host to another.
And just like that, the problem went away! Immediately, TCP retransmissions dropped and CPU usage went down (see Figure 12).
Just to check, when the VM was moved back to the original host, the problem returned again (see Figure 13). Based on this behavior, we suspect that it may have been a malfunctioning NIC card on the physical server, or a driver issue on that server rather than a wider networking issue in the cloud provider’s data center.
- Most on-prem admins will have experience with weird/challenging VMware ESXi, Citrix Hypervisor, or Microsoft Hyper-V bugs with intermittent or perplexing symptoms that impact application performance. Imagine trying to debug such an issue with no access to the hypervisor – that’s what you may have to do on public cloud!
Based on the analysis of this problem, the customer submitted a helpdesk report to the cloud provider with evidence from eG Enterprise to get a credit for the hours when the application performance issue had occurred.
Incident postmortem of the application performance anomaly
 There was a network issue on the physical host used by the cloud service provider. This possibly affected TCP connection handling on the VMs hosted on the host.
- The network issue caused retransmissions at the TCP level.
- Retransmission during SSL handshakes meant there were more SSL connections waiting to be processed in the application stack.
- When the SSL connection cache in the JVM became too high, it caused synchronization issues in the JVM. This caused CPU usage to spike up and the application became slow and unavailable at times.
- When the network issue was circumvented by moving to another host, application performance was back to normal.
Application Performance Troubleshooting: Key Takeaways
The real-life story we have described here highlights the challenges that organizations that are migrating applications to the cloud face. Here are my five key takeaways regarding application performance on the cloud:
- Operating applications in cloud environment is challenging – you no longer have complete visibility. When there is an issue, you often hear “it’s not us” from your cloud service provider. If you are thinking “I will go to the cloud and won’t have any performance issues anymore”, think again.
- You must have full stack visibility. You can’t just monitor the application alone. In a cloud environment, you need as much proof as possible when you speak to your cloud service provider.
- Monitor as many parameters as possible. You never know where you will get a clue to help diagnose a problem. We knew TCP retransmissions tend to affect application performance, however we didn’t necessarily anticipate such a huge CPU impact because of them. Tools that selectively pick a handful of KPIs and report on them will catch the obvious issues or more common root causes that you yourself might find out in a few minutes. You need as much visibility as possible, so that you can provide proof when you contact your cloud service provider.
- Historical insights are extremely important. You are often asked “what changed” – it is important to track config changes and to know what was updated. Your application needs to have audit logging so that you know what changed within the application. You need to monitor the application config and OS config so that you know what patches, hot fixes, or config changes were made, so you can correlate any performance issues with config changes. At the same time, you need to also have usage and performance baselines for your infrastructure to know what normal usage and performance looks like. At several times during our analysis, we checked on these statistics and used them for anomaly detection.
- And YES sometimes – It’s not you, it’s the cloud!

eG Enterprise is an Observability solution for Modern IT. Monitor digital workspaces,
web applications, SaaS services, cloud and containers from a single pane of glass.
Further reading
- If you enjoyed this Postmortem blog post – you may enjoy this similar one, Troubleshooting Web Application Performance & SSL Issues
- An overview of Java Performance Monitoring Tools, which enable you to prioritize problems automatically and provide actionable notifications
- Top 10 Java Performance Problems – An in-depth guide to the most common Java issues and identifying them
- Monitoring SSL Certificates in Business-Critical Applications (eginnovations.com)
- Section 9 “Monitoring TCP Activity” in our troubleshooting guide details debugging and understanding TCP retransmission issues and their causes, see: Server Performance Monitoring – KPIs & Metrics
- My previous deep-dive post-mortem blog post – debugging slow performance on AWS public cloud burstable instances on EC2, see: AWS EC2 Monitoring Tools | eG Innovations
- More on how eG Enterprise leverages AIOps technologies for anomaly detection: AIOps Tools – 8 Proactive Monitoring Tips | eG Innovations
 Arun is Head of Products, Container & Cloud Performance Monitoring at eG Innovations. Over a 20+ year career, Arun has worked in roles including development, architecture and ops across multiple verticals such as banking, e-commerce and telco. An early adopter of APM products since the mid 2000s, his focus has predominantly been on performance tuning and monitoring of large-scale distributed applications.