English


Azure Virtual Desktop Monitoring: How to Track AVD Performance Effectively
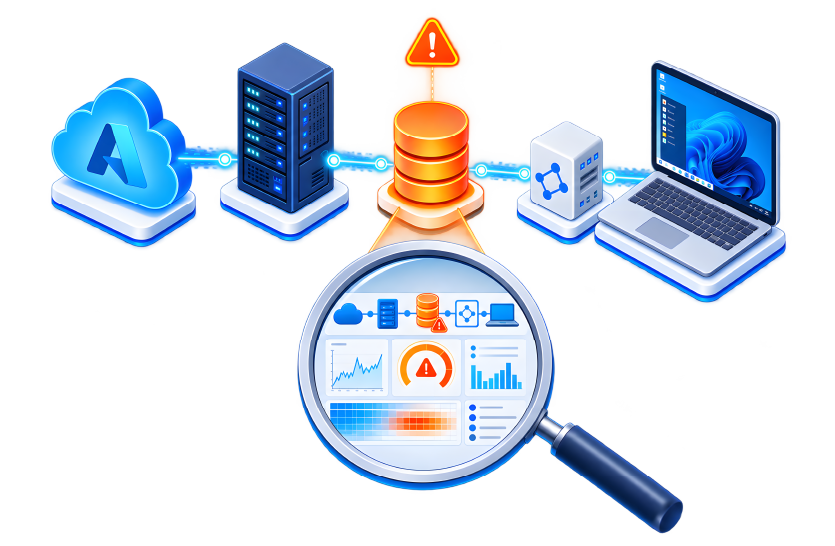
Azure Virtual Desktop (AVD) puts the user’s desktop at the end of a long delivery chain: the Azure control plane, host pools, session hosts, profile storage, the network, and the endpoint on the user’s desk. Any one of them can make a session feel slow, and none of them looks broken from inside the others. That is why performance work on AVD starts with continuous monitoring across the whole chain rather than at either end of it.
Azure Virtual Desktop Monitoring is what closes that gap. Done properly it tells you which link in the chain is responsible, before the helpdesk queue fills up.
What Is Azure Virtual Desktop Monitoring?
Azure Virtual Desktop Monitoring is the process of continuously tracking the health, availability, and performance of Azure Virtual Desktop environments. It provides visibility into session hosts, user sessions, login performance, applications, Azure resources, storage, networking, and endpoints.
A comprehensive monitoring solution correlates metrics across every layer of the AVD environment, helping administrators quickly identify the root cause of user experience issues instead of investigating individual components separately.
Why Azure Virtual Desktop Monitoring Is Critical
Azure Virtual Desktop environments consist of multiple interconnected services. A user’s experience can be affected by Azure infrastructure, virtual machines, Active Directory (via Entra ID Connect) or Microsoft Entra ID authentication, FSLogix profile containers, application performance, storage latency, network connectivity, or endpoint health.
Without end-to-end visibility, IT teams often spend significant time manually collecting logs from different tools before identifying the actual problem.
Comprehensive Azure AVD Monitoring helps organizations:
- Detect performance issues before users report them
- Improve digital employee experience
- Reduce Mean Time to Resolution (MTTR)
- Optimize Azure resource utilization and minimize costs
- Maintain service availability and SLA compliance
- Simplify troubleshooting across hybrid environments
Common Azure Virtual Desktop Performance Issues
Several factors can impact user experience within Azure Virtual Desktop deployments, including:
- Slow user logins caused by authentication or FSLogix profile issues
- High CPU or memory utilization on session hosts
- Storage latency affecting profile loading
- Network congestion or high latency
- Poor application responsiveness
- Session disconnects and reconnections
- Resource bottlenecks caused by inappropriate choice of Azure instance type for session hosts
- Endpoint performance issues affecting remote sessions
Because these issues often originate across different technology layers, unified monitoring is essential for rapid diagnosis.
Key Azure AVD Metrics to Monitor
Monitoring Azure Virtual Desktop is not about tracking dozens of disconnected metrics. The goal is to quickly identify the source of user issues and eliminate possible causes. The following troubleshooting sequences show how experienced administrators use AVD metrics together to pinpoint performance bottlenecks.
Scenario 1: Users Report Slow Logins
When users complain that logging into their virtual desktops takes longer than usual, start with login duration metrics rather than infrastructure metrics.
First, review overall login duration and break it down by individual login stages. If delays occur during profile loading, check FSLogix profile load times and storage latency. Slow profile mounts often point to storage performance constraints rather than issues with the session host itself.
If profile loading appears normal, evaluate network latency between users and the AVD environment. High latency can increase authentication and connection times even when backend resources are healthy.
This sequence helps answer a critical question: Is the delay caused by user profiles, storage performance, or network connectivity?
Learn more, see: Troubleshoot Slow Azure Virtual Desktop Logons.
Scenario 2: Applications Feel Slow After Login
If users successfully connect but experience sluggish applications, begin by examining session host CPU utilization and memory consumption.
Sustained CPU utilization above normal operating levels may indicate overloaded session hosts.
High memory usage can result in paging and reduced application responsiveness.
If CPU and memory appear healthy, review disk I/O performance and storage latency.
If infrastructure metrics are normal, investigate application response times to determine whether a specific application is causing the issue.
Following this sequence helps distinguish between a host capacity problem, a storage bottleneck, and an application-specific issue.
Scenario 3: Random User Experience Complaints
Sometimes users report poor performance without a clear symptom. In these situations, start with overall user session quality metrics.
User session quality combines indicators such as latency, responsiveness, and connection stability. If session quality drops:
- Check network latency and bandwidth utilization.
- Review endpoint health and resource usage on user devices. Verify session host availability and host pool health.
- Examine active user session counts to determine whether hosts are becoming overloaded during peak periods.
This approach helps rule out client-side issues before administrators spend time investigating Azure infrastructure.
Learn more: Troubleshooting Azure Virtual Desktop (AVD) Sessions – Key User Experience and Graphics Metrics to Monitor.
Scenario 4: Capacity and Resource Planning
Effective monitoring is not only about troubleshooting. It is also about preventing future issues.
Track:
- Active user sessions
- Azure resource utilization
- CPU and memory trends
- Session host availability
These metrics reveal when host pools are approaching capacity limits and help determine whether additional session hosts or Azure resources are required. Monitoring long-term trends allows teams to scale proactively rather than reacting to performance complaints.
Bringing the Metrics Together
No single metric provides a complete picture of AVD health. Login delays may originate from FSLogix profiles or storage latency, slow applications may result from CPU or memory pressure, and poor user experience may stem from network conditions rather than Azure resources. By following structured troubleshooting workflows instead of reviewing metrics in isolation, administrators can identify root causes faster and maintain a consistently high-quality user experience.
Native Azure Monitoring Tools
Microsoft provides native tooling for Azure Virtual Desktop through Azure Monitor. The main pieces are Azure Virtual Desktop Insights, a set of prebuilt Azure Monitor workbooks for AVD, the Log Analytics workspace that holds the data, and the diagnostic settings that feed it.
These tools offer valuable insights into Azure resources, virtual machines, performance counters, and platform events. They help administrators understand resource utilization and investigate operational issues within the Azure ecosystem.
However, monitoring modern digital workspaces typically requires visibility beyond Azure services alone.
Limitations of Native Monitoring
Native Azure monitoring tools primarily focus on Azure infrastructure and platform services. They often require significant manual correlation between multiple dashboards, logs, and analytics workspaces.
Organizations may find it challenging to:
- Correlate infrastructure metrics with actual user experience
- Monitor endpoint performance
- Track complete login workflows
- Perform synthetic testing of business-critical applications
- Automatically identify root causes across multiple technology layers
- Monitor multi-platform environments that include Citrix, Omnissa Horizon, Microsoft 365, and SaaS applications
These limitations can increase troubleshooting time and make proactive performance management difficult.
Best Practices for Azure Virtual Desktop Monitoring
To maximize Azure Virtual Desktop performance, organizations should adopt several monitoring best practices:
- Monitor the complete user journey from login to logout
- Track both infrastructure and Digital Employee Experience (DEX) metrics
- Monitor endpoint performance alongside Azure resources
- Use synthetic monitoring to validate application availability proactively
- Continuously monitor login performance and authentication delays
- Correlate metrics across Azure infrastructure, networking, storage, and applications
- Implement intelligent alerting to reduce unnecessary notifications
- Use historical reporting to identify recurring performance trends and capacity requirements
Why Choose eG Enterprise for Azure AVD Monitoring
eG Enterprise covers every component involved in delivering an AVD session, from the Azure control plane to the endpoint.
Unlike native tools, eG Enterprise correlates performance data across Azure infrastructure, session hosts, applications, storage, networks, identity services, and endpoints, then presents them in one console.
Key capabilities include:
- Complete visibility into Azure Virtual Desktop infrastructure
- Detailed login performance analysis with stage-by-stage breakdown
- Built-in Digital Employee Experience monitoring
- Real User Monitoring for active user sessions
- Synthetic Monitoring for proactive issue detection
- Automatic root cause diagnosis driven by AIOps: self-learning baselines, built-in event correlation, and dependency-aware alerting• Out-of-the-box dashboards designed specifically for Azure Virtual Desktop
- Monitoring support for hybrid and multi-cloud environments alongside Citrix and Omnissa Horizon
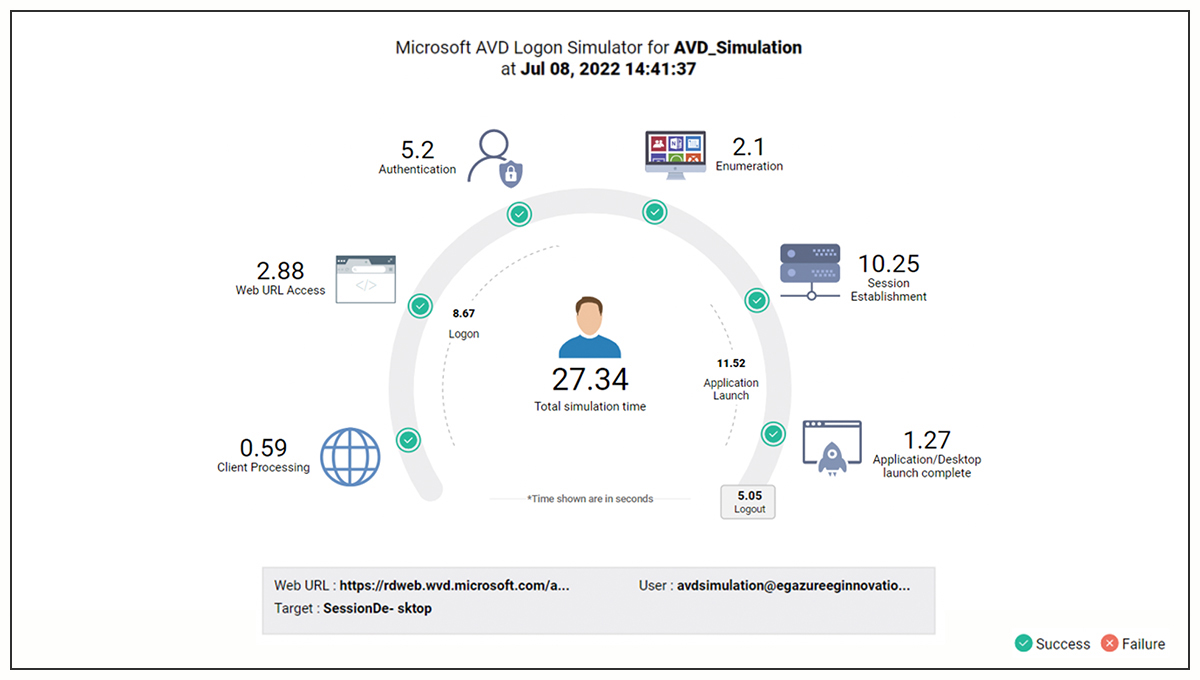
Two of those capabilities are worth spelling out, because they are what separates watching AVD from diagnosing it. The AVD logon simulator runs a robot logon against the environment on a schedule and reports the time spent in each stage, browser access, authentication, enumeration, session establishment, and desktop launch so problems causing slow logons can be resolved before real users encounter and report them. Real user monitoring runs alongside it, recording logon time, application launch time, screen latency, and input delay for every live session. When a ticket does arrive, the stage that ran long is already on record.
By removing the monitoring silos, eG Enterprise cuts the time IT teams spend deciding which team owns the problem.

Conclusion
As Azure Virtual Desktop deployments continue to grow, effective monitoring has become essential for maintaining a productive digital workplace. While native Azure tools provide useful infrastructure insights, enterprises require deeper visibility across user experience, applications, endpoints, storage, and networking.
A comprehensive Azure Virtual Desktop Monitoring solution such as eG Enterprise combines infrastructure monitoring, Digital Employee Experience monitoring, AI-powered root cause analysis, and proactive synthetic testing into a unified platform. The result is that AVD problems get attributed correctly the first time. To see it against your own host pools, eG Innovations offers a free trial and a live demo with an engineer.
eG Enterprise is an Observability solution for Modern IT. Monitor digital workspaces,
web applications, SaaS services, cloud and containers from a single pane of glass.
Frequently Asked Questions
Azure Virtual Desktop is monitored by tracking session hosts, user sessions, login performance, applications, storage, networking, Azure resources, and endpoints. A comprehensive monitoring platform correlates these metrics to provide end-to-end visibility, enabling IT teams to proactively identify issues, accelerate troubleshooting, and maintain a consistent digital employee experience.
Key metrics include CPU utilization, memory usage, disk latency, session host availability, active sessions, login duration, FSLogix profile load times, application response times, network latency, Azure resource utilization, endpoint health, and overall user experience. Monitoring these together helps identify infrastructure and application bottlenecks before they affect users.
Yes. Azure Monitor provides visibility into Azure Virtual Desktop infrastructure, virtual machines, diagnostic logs, and Azure resource performance. Most organizations need more than that for full coverage: Digital Employee Experience monitoring, endpoint visibility, synthetic monitoring, and automated root cause analysis across every tier.
Reducing Azure Virtual Desktop login time involves monitoring each stage of the login process, optimizing FSLogix profile containers, ensuring adequate session host resources, improving authentication performance, and identifying storage or network bottlenecks. Continuous monitoring helps IT teams pinpoint the exact cause of login delays for faster remediation.
Azure Virtual Desktop slowness can result from overloaded session hosts, insufficient Azure resources, storage latency, slow FSLogix profile loading, network congestion, authentication delays, application bottlenecks, or endpoint performance issues. End-to-end monitoring helps correlate these dependencies and accurately identify the root cause of degraded user experience.