 “Change is the only constant in life.” This is a quote often attributed to the Greek philosopher, Heraclitus. In the world of application performance management, you know this to be true. Things are always changing. New technologies force you to come up with new ways and processes for doing things. And new challenges force you to develop new methods of solving old problems.
Performance monitoring and management is an old problem.
There’s always been the need to monitor application performance, but not always the ability to do it well. As technology has advanced, we’ve had to evolve how we monitor applications. Initially, performance monitoring largely involved sending ICMP messages to start troubleshooting a down or slow application.
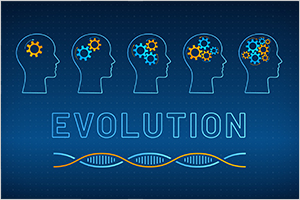
Applications have gotten much more complex, so this is no longer enough. Now we need to know not just whether an application is broken, but why it broke. So APM has had to evolve over the years for us to get there.
But how did this evolution take place, and what happens next? Let’s find out.
Phase 1: The Early APM Days
The concept of application performance management (APM) has existed since the early days of the ARPANET. Ever since the 1970s when the first email was sent, there has been a need to know what’s happening with applications. But unfortunately, the capability didn’t exist. It had to be created.
Much of that work was accomplished in the 1980s. During that time, there were diagnostic protocols and tools developed to help troubleshoot problems on the network. In the toolbox were things like ICMP, SNMP, and tcpdump. Using monitoring tools that implemented these, you could see how systems were performing. But you really couldn’t dig too much into what the applications were doing. It was like a black box.
Since applications were simpler then, the need wasn’t as bad.
Then came Java in 1996.
The ability to write code using the Java programming language, and run it on any operating system, changed everything.
 The Java Virtual Machine (JVM) introduced another layer of abstraction, reducing application visibility even more. In cases when a whole application, with all of its components, runs inside the JVM, SNMP-based or sniffer monitoring tools could not help much. At this point, these tools are doing infrastructure performance monitoring (IPM).
So APM needed to evolve again.
New agent-based tools were introduced in the late 1990s and early 2000s that would provide visibility inside the JVM. Monitoring the monolithic Java applications of that day became possible.
During this time, the infrastructure wasn’t changing that much. The software development process, using the Waterfall model, was pretty slow by today’s standards. Because of that, many business applications were installed and running on only a handful of servers.
But that began to change.
Phase 2: Web 2.0 days of Application Performance Management
The mid to late 2000s brought about changes in software development that lead to things such as service-oriented architectures (SOA). It also marks the start of the Web 2.0 era of the Internet.
During this time, many businesses were moving away from Waterfall to Agile software development process. To do this, many single-tiered and siloed applications were broken up. SOA helped accomplish this because various application components broken up into services could now run on separate systems.
With SOA also came the increased use of XML-based Simple Object Access Protocol (SOAP). While this helped with breaking up applications, XML’s chattiness proved to be a performance problem. This meant that you had to be mindful of the distance between your XML clients and servers.
Having these application services run on different systems increased application complexity. The monitoring offered by Phase 1 APM tools was no longer enough. Instead of having one agent that could report metrics data, we now needed multiple agents. Data sent back to the tool needed merging to create a single view of application performance.
 Also, visibility all of the communication between services that are on the same servers was a must-have. APM tools were needed that could collect not only Java and .NET transaction data, but also from other languages. APM vendors had to start supporting languages such as PHP, Rails, and Python being used more for software development.
APM tools needed the ability to follow a user transaction from one service to another. They also needed to provide a single view on overall application performance for that transaction. So, Phase 2 APM tools had to give us more.
But ever the constant, more change came.
Phase 3: Nowadays of Application Performance Management
By the 2010s, there was a need to be even more agile and productive. Software releases were becoming more frequent. Virtualized IT systems were becoming more common.
Instead of installing and running application services on physical servers, they were running on virtual machines (VM). These VMs were not just running in company-owned or collocated data centers, but also in the data centers owned by cloud providers like AWS, Azure and GCP.
 So, this phase has seen the rise of microservices, which breaks down SOA into even smaller pieces. You now have individual or groups of services running as microservices in Linux containers.
A physical machine sitting inside a cloud provider’s data center can have numerous VMs, running many containers, and running various microservices. All of these microservices can make up hundreds of components of what used to be a monolithic application. And the microservices can be spun up and down pretty quickly, only when needed.
The requirements of an APM tool are now much more complex than they’ve ever been. Not only do they need to trace a user transaction across numerous microservices on the same system, but they also need to happen pretty fast.
When you miss data, you miss root causes.
Future days of Application Performance Management
Many APM providers are just catching up to Phase 3 APM. But as they’re doing that, the next phase is currently taking place. According to industry analyst, Gartner, enterprise organizations will have increased the percentage of applications they monitor with APM tools from 5 percent in 2018 to 20 percent in 2021. So, over the next couple of years, your company may quadruple its monitoring.
With the increased use of serverless technologies, APM tools don’t have the time to have you install an agent. Applications are further broken down into individual functions of their code and run on function-as-a-service systems. The agent used to collect data on these systems must already exist and start collecting data when the function runs.
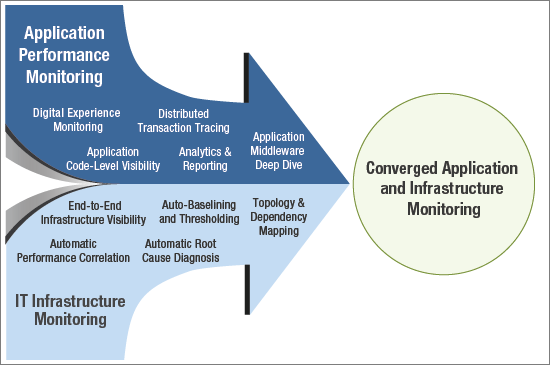
With so many microservices running across numerous VMs for one application, you will need a converged view of total performance. You need to know how your infrastructure is performing, whether in the cloud or not. And you need to know how the application is performing. What is also needed is contextual visibility to understand what affects application performance. A correlative view of the application and all the supporting IT infrastructure tiers will help determine the root cause: is it an application code issue, a bottleneck in the cloud, network connectivity, container performance, and so on?
Some APM vendors (such as New Relic) have implemented infrastructure performance monitoring (IPM) capabilities. Some IPM vendors (such as Datadog, SolarWinds, etc.) are adding APM tooling. Your monitoring tools will need to collect all of this application and infrastructure data and provide you with a single view. You need complete observability. Short of that, you won’t know what’s happening. It’ll feel like you’re back at Phase 1, where the application or the infrastructure looks like a black box. In the future, we will see more of the converged application and infrastructure monitoring trend being adopted by vendors as well as organizations using monitoring tools.
Adapt or Bye
There are constant changes in IT. As you’ve seen, how APM has evolved over the years is evidence of that. APM has involved three phases, and more are coming in the future.
If you are used to buying or recommending monitoring tools based on the pitch of the APM vendor, you need to adapt. You must look at how the APM tools you’re considering or already use have responded to the changes within your infrastructure.
If you’re changing how you keep your users happy, you need a monitoring partner that’s doing the same. And you need one doing it as quickly as your environment is changing. As developers create serverless apps or as AI and machine learning become more a part of how applications work, you need a partner that will help you monitor everything. Not just the infrastructure, not just the application, but down to the individual request for a single function. This is a must-have.
So, you must adapt to the only constant in your IT life, and that’s change. If your APM vendor cannot adapt as well, it may be time to tell them “bye”.
eG Enterprise is an Observability solution for Modern IT. Monitor digital workspaces,
web applications, SaaS services, cloud and containers from a single pane of glass.
 Jean Tunis is Principal Consultant and Founder of