Many server-side applications are written in Java and often process tens of millions of requests per day. Key applications in various domains like finance, healthcare, insurance and education are often Java-based. When these applications slow down or fail, they affect the user experience and in turn, reduce business revenue.
Behind many web forms or form-like GUIs there will often be a Java application. Deployed at scale on application servers such as Apache Tomcat, IBM WebSphere, Oracle WebLogic or Red Hat JBoss, administrators face challenges to identify rogue applications and whether the classes and objects within them are leaking memory.
Ideally bugs and faults in applications should be identified in development or in subsequent QA, but in practice administrators are often presented with applications from third-parties or different internal teams that they need to test in pre-production and if problems are found, gather sufficient detail for the app development team to reproduce and understand.
In this blog, I’ll cover:
- What the challenges are debugging Java memory leaks at scale
- How an administrator can use eG Enterprise to identify Java web applications that are leaking heap memory on an application server such as Apache Tomcat, IBM WebSphere, Oracle WebLogic or JBoss.
- Walk through a simple example of a heap memory leak to show how eG Enterprise’s Java application monitoring can be used to undertake pre-production testing by an administrator to identify applications with heap memory leaks and subsequently the specific area of code within a specific application with sufficient information regarding the leak at scale to raise a ticket with the app development team in the event the issue may very well not reproduce in the development test or QA environment
- Include details of how we modify code to deliberately introduce memory leaks within test environments to create controlled memory leaks to test our root cause analysis capabilities
The problem for IT Operations – JVMs at scale
Java memory leaks often go unnoticed during development, particularly when they occur gradually over an extended period. In a controlled development environment, small and slow memory leaks can easily be overshadowed by the overall memory usage of the application. However, when deploying applications at scale, especially within frameworks like Kubernetes or containers that run continuously across multiple worker nodes, these leaks can accumulate rapidly and ultimately affect the application performance.
IT Operations teams must navigate through the complexities of large-scale deployments, where even minor memory leaks can have a significant impact on system performance and reliability. You need proactive monitoring and precise root-cause analysis to ensure smooth operations and meet service level agreements (SLAs).

The dreaded OutOfMemoryError
When the heap memory is exhausted, new requests for memory start to fail (OutOfMemoryError errors may be seen) and these can be very hard to identify as the symptoms and the symptoms manifested are often similar to many other IT issues. When an application can no longer acquire memory, it could lead to a form not responding and the user seeing a spinning icon or a total crash of applications. The applications exhibiting problems may not be the actual application that is leaking memory but may also share many services and frameworks with the problem application. The garbage collector within the Java Virtual Machine (JVM) will become aware of a critical memory shortage and will try to reclaim memory in turn leading to an increase in CPU usage which in turn may cause other symptoms and secondary issues. These symptoms though are generic to a wide range of root cause issues such as networking or storage failures or an unavailable database.
The infrastructure and IT teams responsible for deploying the application will rarely be the development team for the app and with so many third-party applications in use, may not even work for the same company. Typically, the system administrator will have sufficient information to know that the system is out of memory and maybe a user has reported “The application MyFinanceApp keeps crashing”. At this point organizations often get involved in lengthy support ticket conversations with the supplier of MyFinance App, whose development team can find no evidence of the reported issue “This app keeps crashing”.
In this scenario it could be the case that there is in fact a memory leak in a different Java app “MyHRApp” depriving the other app of memory, the admin needs to identify this is the case but also provide enough evidence to raise a support case. Remembering that this is an issue that has evaded the development testing, even when the correct problematic application has been identified, it is possible the development team do not have access to comparable infrastructure and the support case degenerates into cycles of “Cannot reproduce” to-and-fro between the infrastructure and development teams, for organizations supporting in-house apps this means two internal teams wasting time and goodwill. Development teams are likely to be frustrated by the lack of expertise or debug tools in the infrastructure team to pinpoint where an issue is likely to be, whilst they are faced with potentially hundreds of thousands of lines of code involving calls to external libraries and frameworks and no evidence there is actually any issue in any of these.
IT operations, application operations and DevOps teams often spend days troubleshooting Java application performance issues. Since Java applications are multi-threaded and involve multi-tier architectures, it is a challenge to identify whether the problem is due to the client, the network, in the JVM, in the application code, with the SQL query, or in the underlying infrastructure. Monitoring of the Java application stack end-to-end in the production environment is necessary to identify issues, moreover the monitoring platform needs to root cause issues to the infrastructure administrator with minimal or knowledge of Java and provide them with enough information to identify the code owner and give them details of where in the application the memory leak is. It is very common to see questions such as:
“We have a tomcat server serving several web applications. With jconsole I can see that the heap memory grows over time. We had some crashes with an OutOfMemoryError for the heap memory after about one day. Platform: SLES 12 SP3, Tomcat 8
Is it possible to determine which of our web applications is causing a memory leak with a tool?” on StackExchange and other community forums.
We have provided functionality within eG Enterprise that will allow system administrators to run overnight or soak tests in their pre-production and staging environments to test apps they are introducing into production for numerous common Java faults. This article covers just a specific example of how a heap memory leak can be simulated and subsequently identified using eG Enterprise prior to release.
Root Causing a Java application memory leak by the system administrator
As with all of the 500+ technologies we monitor, a specialized component for Java applications is used within our layer model, under-the-hood a powerful AIOps platform correlates and filters events and performs Root Cause Analysis (RCA) and automated diagnostic to identify to the system administrator operating the console where the issue lies.
A slow Java memory leak was caused within an application that caused it to allocate memory from the heap memory when run within the JVM but never release it. As this shared heap memory resource is utilized by numerous applications, we need to identify the application and Java class that contains the leak.
Without dedicated APM tools, a system administrator would need to identify excessive memory usage is occurring, take a heap dump from the JVM, analyze the dump using a tool like the Eclipse Memory Analyzer and identify objects that are taking up an unusual amount of memory to identify the coding issue. These are all developer domain tools and workflows for an administrator whose core role is deployment and ensuring availability. Below we’ll show you how we present the system administrator with a simple layered view requiring minimal knowledge of the JVM or other layers to identify the leaking code objects.
The test stack we used is a typical enterprise scale web application architecture. Apache Tomcat containers are used to deploy web applications, the containers themselves run on the JVM (Java Virtual Machine).
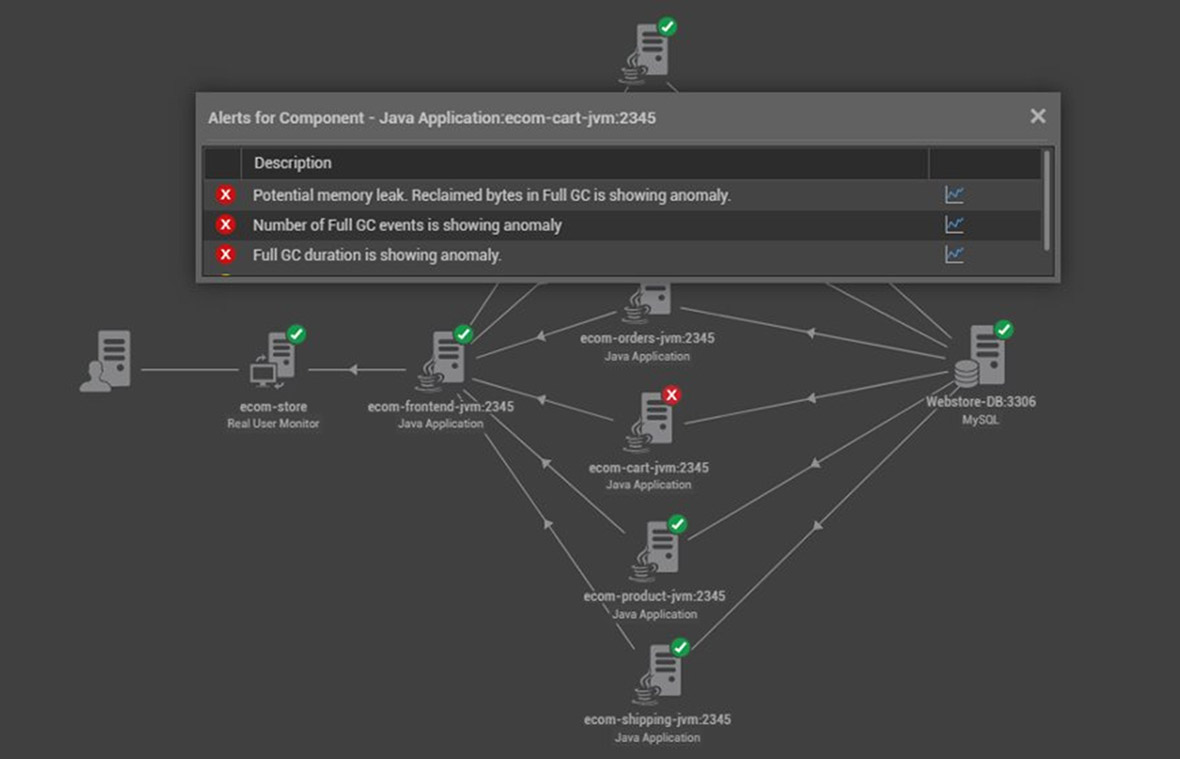
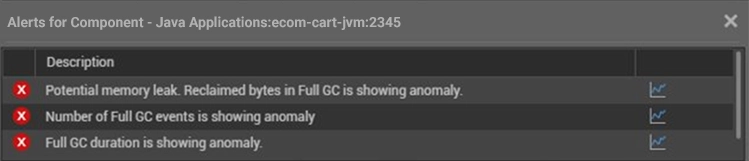
Out-of-the-box thresholds are built-in to trigger when issues like a memory leak cause key metrics to cross thresholds, in this case the low heap memory from running our leaky code. The AIOps platform will filter and prioritize alerts having identified other issues as secondary issues or symptoms. This means the operator does not get distracted or waste time by an alert storm from the non-responsiveness or failure of other applications impacted by a lack of available heap memory.
eG Enterprise has out-of-the-box thresholds that are built-in to trigger issues like a memory leak that can cause key metrics to cross thresholds, in this case the low heap memory from running our leaky code. The AIOps platform will filter and prioritize alerts having identified other issues as secondary issues or symptoms. This means the operator does not get distracted or waste time by an alert storm from the non-responsiveness or failure of other applications impacted by a lack of available heap memory.
In eG Enterprise you can specify three maximum and/or three minimum threshold values on metrics and signals, in the format: Critical/Major/Minor which allows escalation and proactive detection before applications / users are impacted. Root Cause Analysis (RCA) means the operator will be presented with an alert window upfront thus:
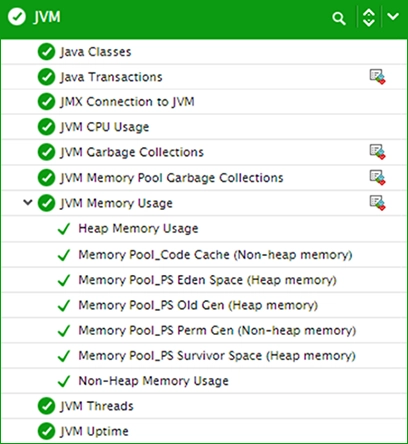
Routine medical screening checks are normal in healthcare. If a patient’s vital signs are normal, no further investigation is needed. However, if any abnormality is detected, additional tests and investigations will be made. The same analogy also holds for IT monitoring also. Routine tests check key parameters regarding the applications and the infrastructure supporting them. These tests are designed to impose minimal overhead on the target environment. If anomalies or problems arise, additional diagnosis is performed to collect more details about a problem. eG routinely monitors key metrics of the JVM including the heap memory. If there is a suspected JVM memory leak further diagnosis tests can be performed to identify which specific classes and objects may be leaking memory using the “JVM Leak Suspects Test”. This is a heavyweight test and designed for use in pre-production once a potential leak is suspected and essentially automates the process of examining the heap memory dump of the JVM. Since eG Enterprise supports multiple flavors of the JVM, this eliminates the need for JVM specific domain knowledge to process and understand proprietary log formats.
How to make Java application memory leaks to test leak detection monitoring
To test memory leak detection, we have collected in-house a number of real-world applications with known issues, but we also build some test applications.
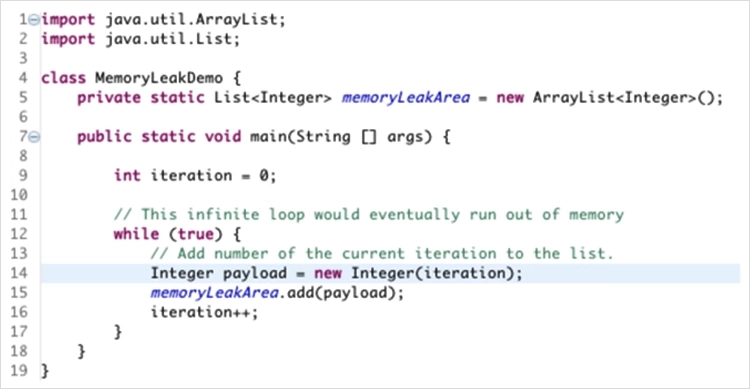
If you want to do this yourself you could simply include code to allocate an integer, this actually works quite well as it gradually causes a heap memory issue at a sensible pace so you can investigate how a monitoring system performs, how early it detects the issue etc. Once you’ve done this you could of course tweak the code so control the pace using wait() calls or using a larger variable type e.g., a Double or String vs. an Integer.
eG Enterprise is an Observability solution for Modern IT. Monitor digital workspaces,
web applications, SaaS services, cloud and containers from a single pane of glass.
More information
If you found this article useful, you might like to check out:
eG Enterprise is an Observability solution for Modern IT. Monitor digital workspaces,
web applications, SaaS services, cloud and containers from a single pane of glass.
- Vinod Mohan’s blog – Top 10 Java Performance Problems
- Abhilash Warrier’s article that details Free Java Monitoring Tools – Pros and Cons and contains links to free heap analysis tools
- What is Garbage Collection in Java: Detailed Guide
- There’s a fantastic article on Baeldung – “Understanding Memory Leaks in Java”, which covers the anatomy of Java memory leaks and debugging them, frequent coding mistakes that cause them and coding practices that can help avoid them
- Common misunderstanding around Java memory leaks are covered in: Java Memory Leak: 7 Myths that SREs Need to Know
- Other blogs from Vinod on Java thread monitoring, How to Troubleshoot Java CPU Usage Issues and Why and How to Troubleshoot Java Synchronization Issues?
- Arun’s article on Troubleshooting Java Application Deadlocks – Diagnosing ‘Application Hang’ Situations