JVM Leak Suspects Test
Note:
This test is CPU & Memory intensive and can cause slowness to the underlying application. It is hence NOT advisable to enable this test on production environments. It is ideally suited for Development and Staging environments.
Java implements automatic garbage collection (GC); once you stop using an object, you can depend on the garbage collector to collect it. To stop using an object, you need to eliminate all references to it. However, when a program never stops using an object by keeping a permanent reference to it, memory leaks occur. For example, let’s consider the piece of code below:
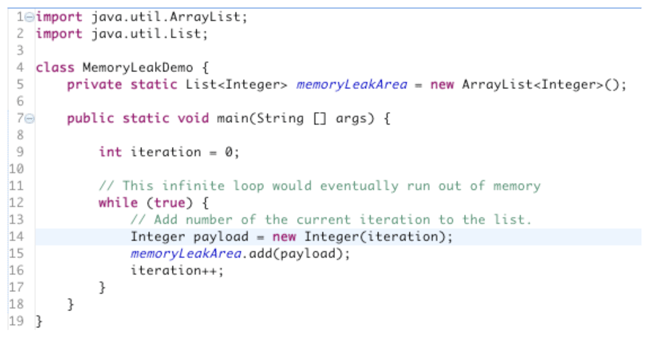
Figure 1 : A sample code
In the example above, we continue adding new elements to the list memoryLeakArea without ever removing them. In addition, we keep references to the memoryLeakArea, thereby preventing GC from collecting the list itself. So although there is GC available, it cannot help because we are still using memory. The more time passes the more memory we use, which in effect requires an infinite amount memory for this program to continue running. When no more memory is remaining, an OutOfMemoryError alert will be thrown and generate an exception like this: Exception in thread "main" java.lang.OutOfMemoryError: Java heap space at MemoryLeakDemo.main(MemoryLeakDemo.java:14)
Typically, such alerts signal a potential memory leak!
A memory leak can diminish the performance of your mission-critical Java applications by reducing the amount of available memory. Eventually, in the worst case, it may cause the application to crash due to thrashing. To avert such unwarranted application failures, it is imperative that memory leaks are detected at the earliest and the objects responsible for them accurately isolated. This is where, the JVM Leak Suspects test helps! This test continuously monitors the JVM heap usage and promptly alerts administrators when memory usage crosses a configured limit. The detailed diagnostics of the test will then lead you to the classes that are consuming memory excessively, thereby pointing you to those classes that may have caused the leak.
Note:
This test will work only if the following pre-requisites are fulfilled:
- The test should be executed in an agent-based manner only.
- The target Java application should use the JDK/JRE offered by one of the following vendors only: Oracle, Sun, OpenJDK. IBM JDK/JRE is not supported.
- The monitored Java application should use JDK/JRE 1.6 or higher.
- For this test to run and report metrics, the eG agent install user should be the same as the Java application (or) Java web/application server install user.
- By default , this test programmatically dumps a heap dump (.hprof files) in the folder <EG_AGENT_INSTALL_DIR>\agent\logs folder. To enable the eG agent to read/analyse such files, you need to add the eG agent install user to the Java application (or) Java web/application server install user group. If this is not done, then the dump files will be created, but will not be processed by the eG agent, thus ending up unnecessarily occupying disk space (note that .hprof files are normally 1-5 GB in size).
This test is disabled by default. To enable the test, go to the enable / disable tests page using the menu sequence : Agents -> Tests -> Enable/Disable, pick the desired Component type, set Performance as the Test type, choose the test from the disabled tests list, and click on the < button to move the test to the ENABLED TESTS list. Finally, click the Update button.
Target of the test : A Java application
Agent deploying the test : An internal/remote agent
Outputs of the test : One set of results for every Java application monitored
| Parameter | Description |
|
Test period |
How often should the test be executed |
|
Host |
The host for which the test is to be configured. |
|
Port |
The port number at which the specified host listens to |
|
JMX Remote Port |
This parameter appears only if the mode is set to JMX. Here, specify the port at which the JMX listens for requests from remote hosts. Ensure that you specify the same port that you configured in the management.properties file in the <JAVA_HOME>\jre\lib\management folder used by the target application. To know more, refer to Enabling JMX Support for JRE |
|
JNDI Name |
This parameter appears only if the mode is set to JMX. The JNDIname is a lookup name for connecting to the JMX connector. By default, this is jmxrmi. If you have resgistered the JMX connector in the RMI registery using a different lookup name, then you can change this default value to reflect the same. |
|
JMX User, JMX Password, and Confirm password |
These parameters appear only if the Mode is set to JMX. If JMX requires authentication only (but no security), then ensure that the user and password parameters are configured with the credentials of a user with read-write access to JMX. To know how to create this user, refer to Configuring the eG Agent to Support JMX Authentication. Confirm the password by retyping it in the confirm password text box. |
|
Provider |
This parameter appears only if the Mode is set to JMX. This test uses a JMX Provider to access the MBean attributes of the target Java application and collect metrics. Specify the package name of this JMX Provider here. By default, this is set to com.sun.jmx.remote.protocol. |
|
Timeout |
Specify the duration (in seconds) for which this test should wait for a response from the target Java application. If there is no response from the target beyond the configured duration, the test will timeout. By default, this is set to 240 seconds if the Mode is JMX, and 10 seconds if the Mode is SNMP. |
|
JMX Registry SSL |
This parameter appears only if the Mode is set to JMX. If you have registered the JMX connector in an SSL-enabled RMI registry , set this flag to Yes. By default, this is set to No. |
|
DD Frequency |
Refers to the frequency with which detailed diagnosis measures are to be generated for this test. The default is 1:1. This indicates that, by default, detailed measures will be generated every time this test runs, and also every time the test detects a problem. You can modify this frequency, if you so desire. Also, if you intend to disable the detailed diagnosis capability for this test, you can do so by specifying none against this parameter. |
|
Detailed Diagnosis |
To make diagnosis more efficient and accurate, the eG Enterprise embeds an optional detailed diagnostic capability. With this capability, the eG agents can be configured to run detailed, more elaborate tests as and when specific problems are detected. To enable the detailed diagnosis capability of this test for a particular server, choose the On option. To disable the capability, click on the Off option. The option to selectively enable/disable the detailed diagnosis capability will be available only if the following conditions are fulfilled:
|
| Measurement | Description | Measurement Unit | Interpretation | ||||||||||||||||||||||||||
|---|---|---|---|---|---|---|---|---|---|---|---|---|---|---|---|---|---|---|---|---|---|---|---|---|---|---|---|---|---|
|
Allocated Heap Memory |
Indicates the total amount of memory space occupied by the objects that are currently loaded on to the JVM. |
MB |
|
||||||||||||||||||||||||||
|
Leak suspected classes |
Indicates the number of classes that are memory leak suspects. |
Number |
Use the detailed diagnosis of this measure to know which classes are using more memory than the configured pct heap limit. Remember that all applications/classes that throw OutofMemory exceptions need not be guilty of leaking memory. Such an exception can occur even if a class requires more memory for normal functioning. To distinguish between a memory leak and an application that simply needs more memory, we need to look at the "peak load" concept. When program has just started no users have yet used it, and as a result it typically needs much less memory then when thousands of users are interacting with it. Thus, measuring memory usage immediately after a program starts is not the best way to gauge how much memory it needs! To measure how much memory an application needs, memory size measurements should be taken at the time of peak load—when it is most heavily used. Therefore, it is good practice to check the memory usage of the ‘suspected classes’ at the time of peak load to determine whether they are indeed leaking memory or not. |
||||||||||||||||||||||||||
|
Number of objects |
Indicates the number of objects present in the JVM. |
Number |
Use the detailed diagnosis of this measure to view the top-20 classes in the JVM in terms of memory usage. |
||||||||||||||||||||||||||
|
Number of classes |
Indicates the number of classes currently present in the JVM. |
Number |
|
||||||||||||||||||||||||||
|
Number of class loaders |
Indicates the number of class loaders currently present in the JVM. |
Number |
|
||||||||||||||||||||||||||
|
Number of GC roots |
Indicate the number of GC roots currently present in the JVM. |
Number |
A garbage collection root is an object that is accessible from outside the heap. The following reasons make an object a GC root:
|
||||||||||||||||||||||||||
|
Objects pending for finalization |
Indicates the number of objects that are pending for finalization. |
Number |
Sometimes an object will need to perform some action when it is destroyed. For example, if an object is holding some non-java resource such as a file handle or window character font, then you might want to make sure these resources are freed before an object is destroyed. To handle such situations, Java provides a mechanism called finalization. By using finalization, you can define specific actions that will occur when an object is just about to be reclaimed by the garbage collector. A high value for this measure indicates the existence of many objects that are still occupying the JVM memory space and are unable to be reclaimed by GC. A consistent rise in this value is also a sign of a memory leak. |
The detailed diagnosis of the Leak suspected classes measure lists the names of all classes for which the memory usage is over the configured pct heap limit. In addition, the detailed diagnosis also reveals the percentage retained heap of each class - this is the percentage of the total Allocated heap size that is used by every class. From this, you can easily infer which class is consuming the maximum memory, and is hence, the key memory leak suspect. By observing the memory usage of this class during times of peak load, you can corroborate eG’s findings - i.e., you can know for sure whether that class is indeed leaking memory or not!
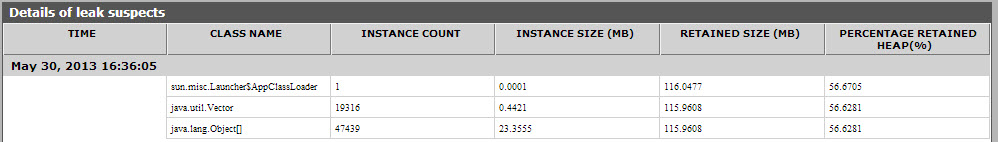
Figure 2 : The detailed diagnosis of the Leak suspect classes measure
The detailed diagnosis of the Number of objects measure lists the names of the top-20 classes in the JVM, in terms of memory usage. In addition, the detailed diagnosis also reveals the percentage retained heap of each class - this is the percentage of the total Allocated heap size that is used by every class. From this, you can easily infer which class is consuming the maximum memory, and is hence, the key memory leak suspect. By observing the memory usage of this class during times of peak load, you can corroborate eG’s findings - i.e., you can know for sure whether that class is indeed leaking memory or not!
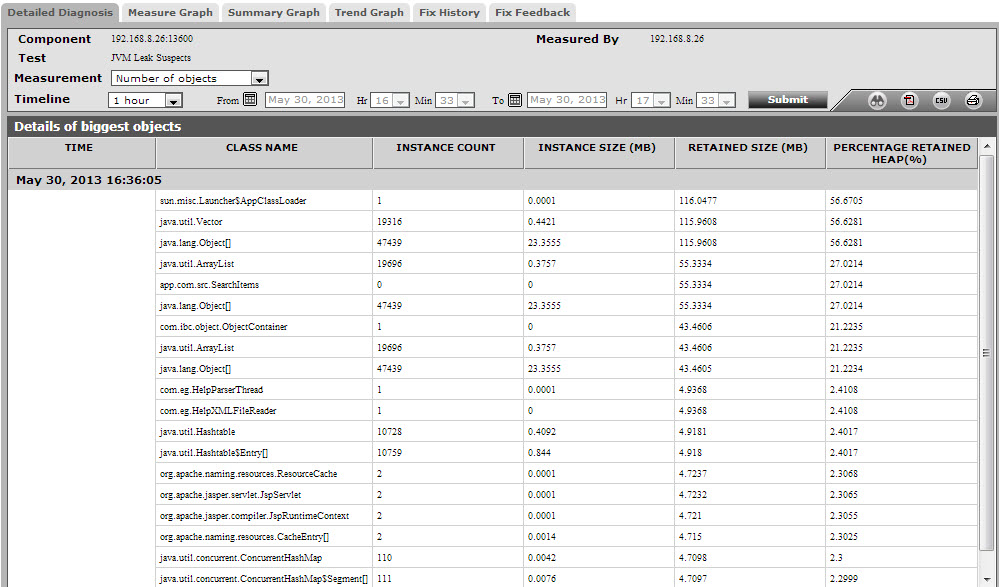
Figure 3 : The detailed diagnosis of the Number of objects measure