The Key Role of Alerting for Monitoring and Observability
Alerting is a critical feature in monitoring and observability products. The monitoring platform continually tests systems and applications for metrics crossing thresholds, key events in logs and the other warning signs of issues. Alerting ensures that help desks, administrators and IT Ops teams know about issues, or impeding issues and handle communications and remediation rapidly. Often synthetic monitoring is put in place, whereby robot users continually access and use systems to test systems even at times of the day when real users may not be using those systems.
Most enterprise grade monitoring products provide AIOps enabled features such as metric thresholding, dynamic self-learning thresholding and alerting out-the-box. With freeware and cloud native tooling though a great deal of manual effort is put into determining, setting and tuning metric thresholds and configuring alerts manually or via scripts.
Regardless of how you have set up your alerting, it is essential that you also put in place mechanisms to suppress, suspend or mute alerting on components undergoing maintenance. And increasingly there is a requirement to be able to do this within DevOps type CI/CD workflows.
Maintenance Mode is a long-standing feature set of eG Enterprise and today I will cover:
- Who uses maintenance policies and with what benefits – in particular, I will cover some considerations for organizations with multiple IT teams and MSPs
- How to evaluate monitoring products for maintenance features
- Scheduled Maintenance Policies in eG Enterprise
- Ad Hoc Maintenance – Quick Maintenance Policy Application
- Using the eG Enterprise REST API to automate maintenance e.g., within CD / CI automated pipelines
- Managing maintenance via the eG Enterprise Mobile App for iOS or Android
- Why use eG Enterprise – what are cloud native alternatives such as Azure Monitor like?
Who Uses Maintenance Policies and with What Benefits
All administrators with maintenance responsibilities find this feature of use. With alerting often integrated into messaging and ITSM tools including emails, SMS, ServiceNow, Slack, JIRA and other systems. False positives arising from deliberate actions are undesirable. The more sophisticated features and granular controls though are of particular use to organizations where IT support, Infrastructure provision and end user support are distributed between different teams or even companies. For example:
- Hybrid, Multi-Cloud and hyper-converged infrastructures are now common. Offering such as Nutanix cloud platform allow organizations to deploy DaaS and virtual desktops all over the place and teams supporting users, services and applications or desktops are often siloed from those supporting and deploying the infrastructure.
- Many MSPs also offer a range of tenant self-service options. Many organizations prefer to keep L1/L2 frontline support for users in house so that only their own staff have access to proprietary company data, whilst leaving the maintenance of hardware and infrastructure to the MSP (Managed Service Provider).
How to Evaluate Monitoring Products for Maintenance Features
Infrastructure not Monitoring should be Tagged as in Maintenance
For SMB and freeware products often the only option given is to schedule the suspension of end-to-end testing. This is contrary to best practice in enterprise and cloud, whereby monitoring should continue, metrics be collected but it is the alerting and alarm storm that is suppressed or muted. Azure Monitor (although fiddly to configure) applies alert suppression via Alert processing rules for Azure Monitor alerts – Azure Monitor, this article also covers the reasons why turning off testing and alerting itself is actively discouraged.
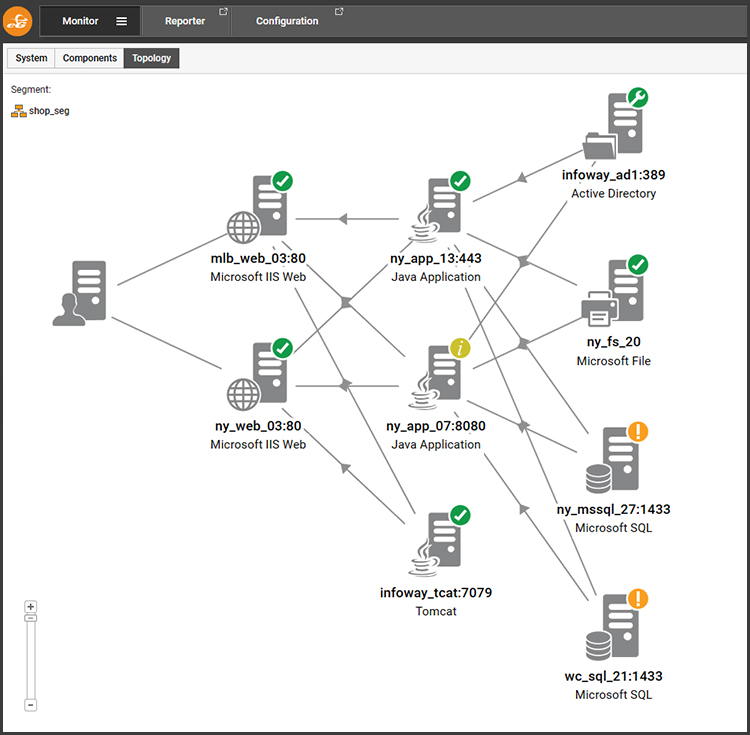
Many monitoring and synthetic tests are designed to test a large number of end-to-end components, within architectures designed for failover, so turning off testing or monitoring for all components is simply inappropriate. Scoped alert muting allows teams to eliminate unnecessary alerting during scheduled maintenance, testing, auto scaling events, and instance reboots.
If you use synthetic monitoring tools such as logon simulators for Citrix / Microsoft AVD / VMware / Amazon WorkSpaces you should not usually need to suspend testing when taking servers out of service for maintenance or when resizing cloud instances. Indeed, the team responsible for supporting overall end-to-end testing of user experience and user help desk support is often not responsible for the maintenance of the servers, gateways and databases the end user services rely on. Synthetic testing via its very nature is likely to be used 24×7 including throughout traditional maintenance windows such as at the weekend and in the early hours of the morning.
Enterprise monitoring products should provide maintenance features that allow alerting to be suspended on components undergoing deliberate maintenance and those undertaking the maintenance should have access to features that allow them to flag components as undergoing maintenance so the wider support and IT teams in the organization have transparent access to who is working on what and when.
Fine Granularity
The granularity at which components can be excluded should be closely examined. You will probably need to be able to suppress alerts from individual tests or metrics quickly and in some scenarios, you may need to rapidly exclude a whole end-to-end service, zone, region or segment. If you know a system has issues and are testing possible fixes you may not want to generate further alerts particularly if you have automated alerting into ITSM systems, such as ServiceNow or notifications via Slack, WhatApps and Teams.
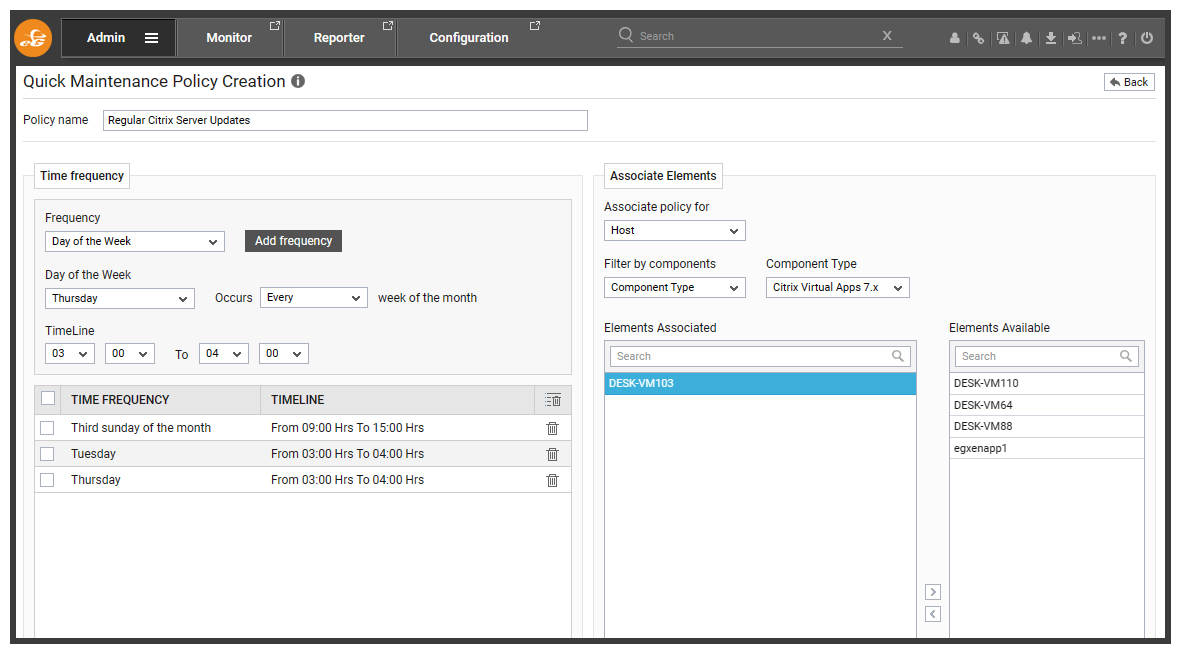
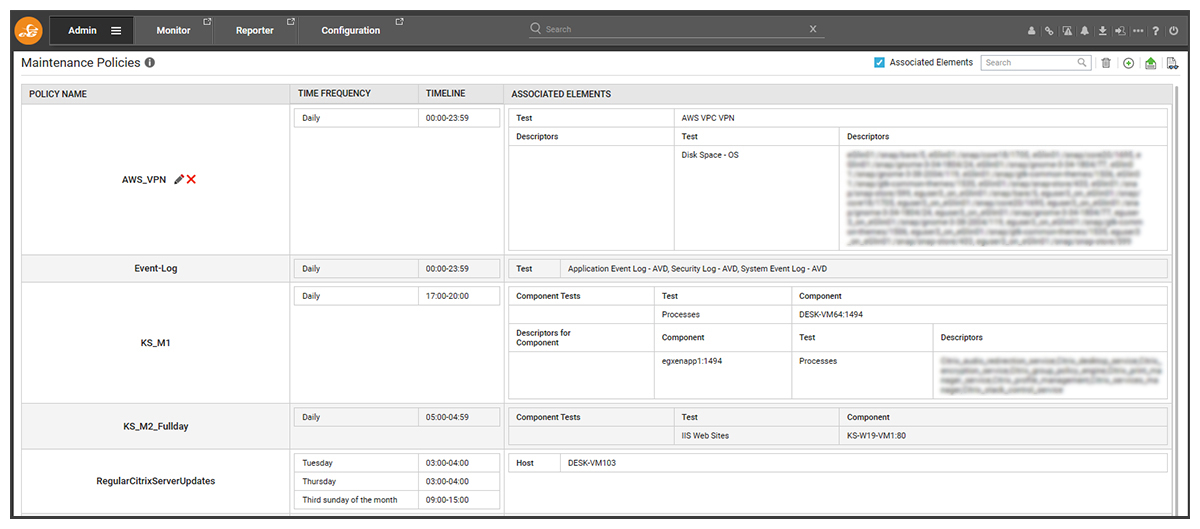
You may want to check how much flexibility you will have to define recurrent maintenance events e.g., can you set up a regular maintenance schedule for a server that consists of an hour every Tuesday and Thursday at 3am plus 6 hours on the third Sunday of every month.
Restricted Access to Information on Maintenance Activities
While transparency in an organization is generally a good thing, information on maintenance cycles, security patching, services out-of-action can be leveraged by malicious actors and provide opportunities to undertake activities to circumvent security resulting in breaches. A college intern working a vacation job on an L1 help desk simply does not need to know any details of the security team’s IT maintenance schedule or operation. In fact, that college intern doesn’t even need to know the names of those on the security team.
A secure monitoring tool will allow you to only communicate a minimal subset of information to staff with low security privileges.
Traceability
Maintenance modes and policies give administrators and IT teams visibility on who has done what, when and for what reason. They are usually used in conjunction with other features to ensure change is by design and traceable. Many organizations use these features to adhere to regulatory and compliance requirements of their local geography or specific industry. Users interested in traceability for maintenance and monitoring, may like to explore these other articles on:
- Configuration change tracking: Configuration and Change Tracking for IT Observability (eginnovations.com) and Change Tracking and Configuration Monitoring | eG Innovations
- Audit capabilities of monitoring tools: Auditing Capabilities in IT Monitoring Tools | eG Innovations
Business Insights, Planning and Analysis
Maintenance, upgrades and security patching are essential and are a regular commitment for IT teams. Time spent on unscheduled troubleshooting and other “urgent” tasks can eat into the time allocated for mundane yet essential maintenance. Good reporting on maintenance operations and formal maintenance schedules and planning helps IT teams protect and ring-fence maintenance and moreover helps demonstrate this often unseen yet essential work, is necessary and is planned or has occurred.
Ensuring maintenance downtime is tracked and differentiated from unplanned outages when evaluating SLAs (Service Level Agreements) is essential.
Scheduled Maintenance Policies in eG Enterprise
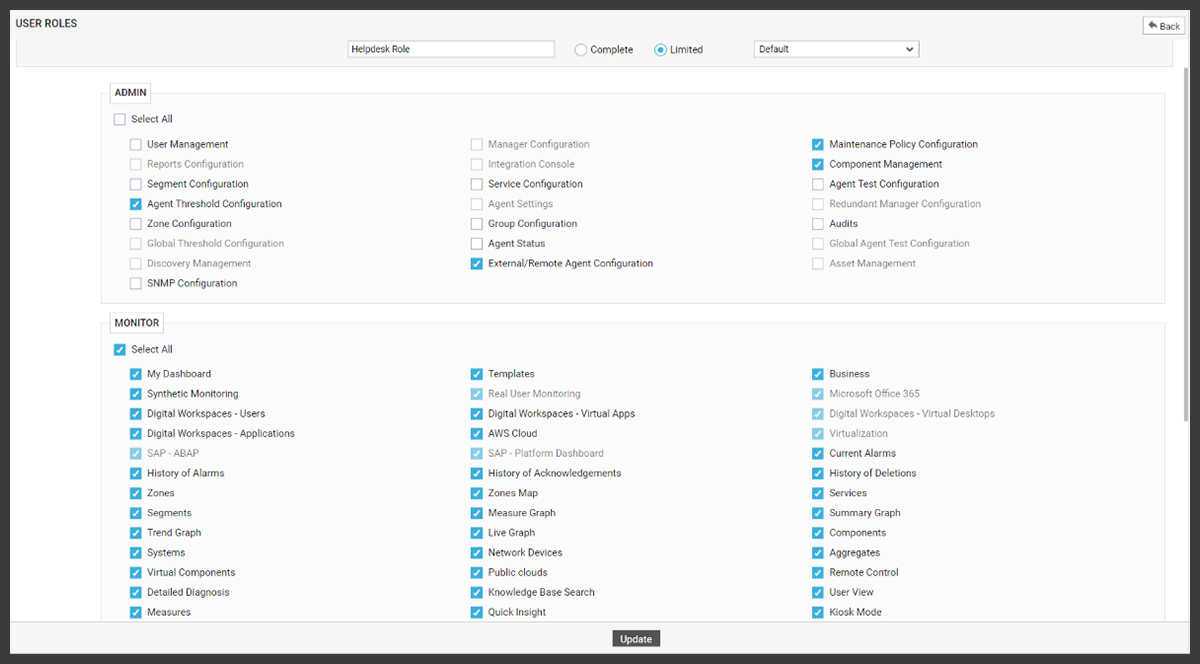
This functionality is only available to appropriately privileged administrators within eG Enterprise. Restricting access to define and apply maintenance policies with eG Enterprise is easy via the RBAC (Role Based Access Control) features.

When setting a maintenance policy users have fine granular control over the time frequency.


Wendy Holden has put together a quick video (it’s only 3 minutes!) that covers setting maintenance policies including details on applying maintenance policies to entire services, zones beyond components such as servers and individual tests. Watch it here: How To Set Maintenance Policies in eG Enterprise – YouTube.
Ad Hoc Maintenance – Quick Maintenance Policy Application
Occasionally you may wish to put a component under maintenance ad hoc, and this can be done using the quick-maintenance icons on each component or test.


Within a minute or so, the system will be defined as under maintenance and alerts suppressed.

Clicking on the maintenance icon will reveal details of the maintenance policy applied. All policies applied this way can also be accessed via the main menu features.

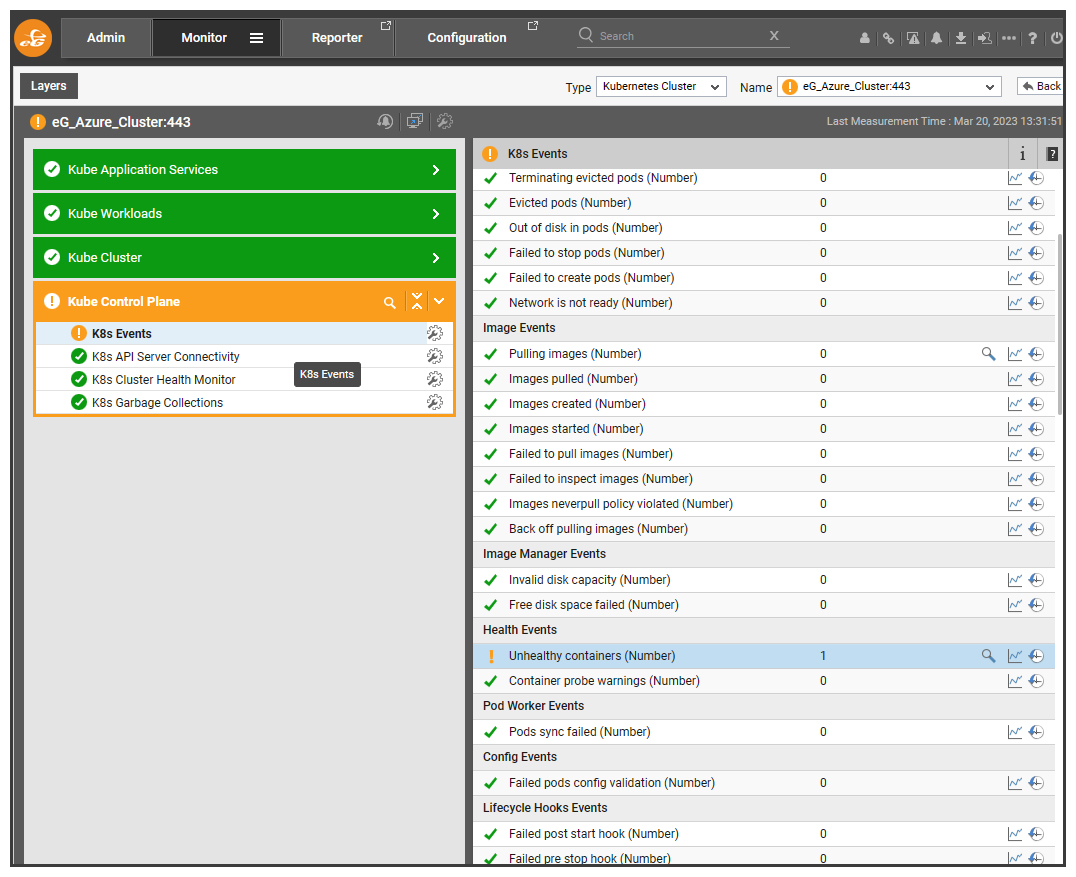
Sometimes there may be a particular test set to raise alerts, that you may wish to temporarily suppress alerts for whilst you attempt to repair the systems.
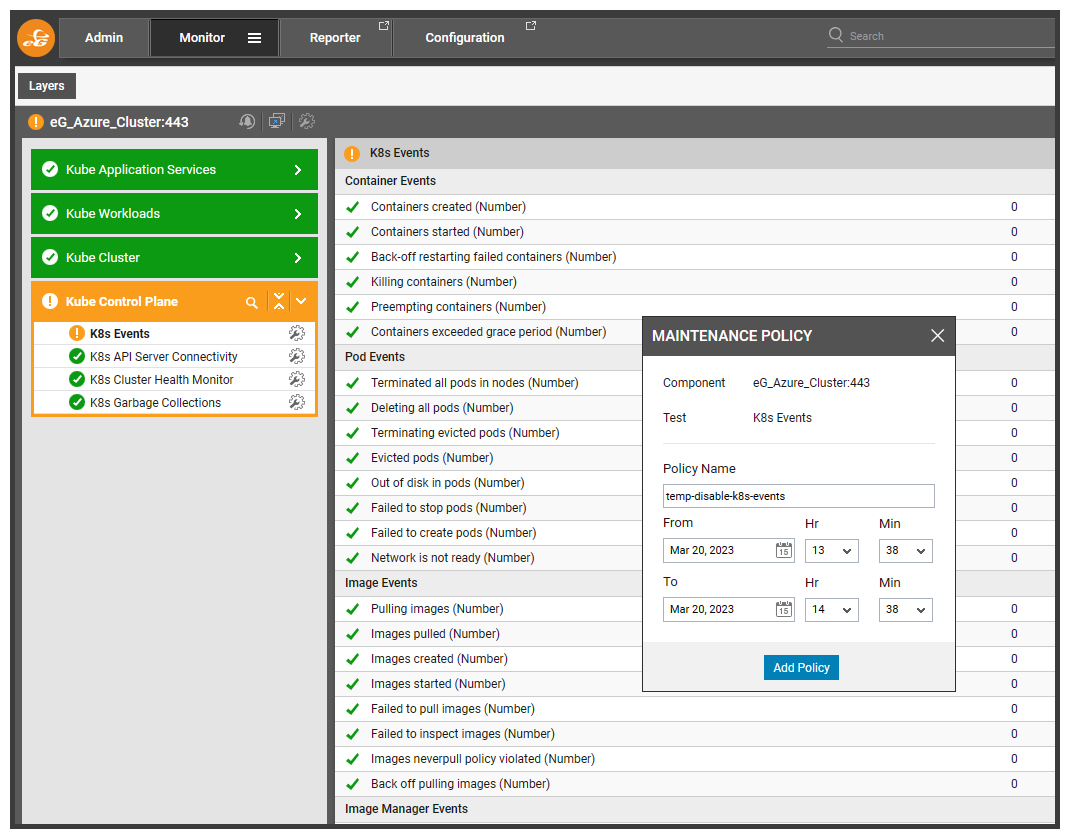
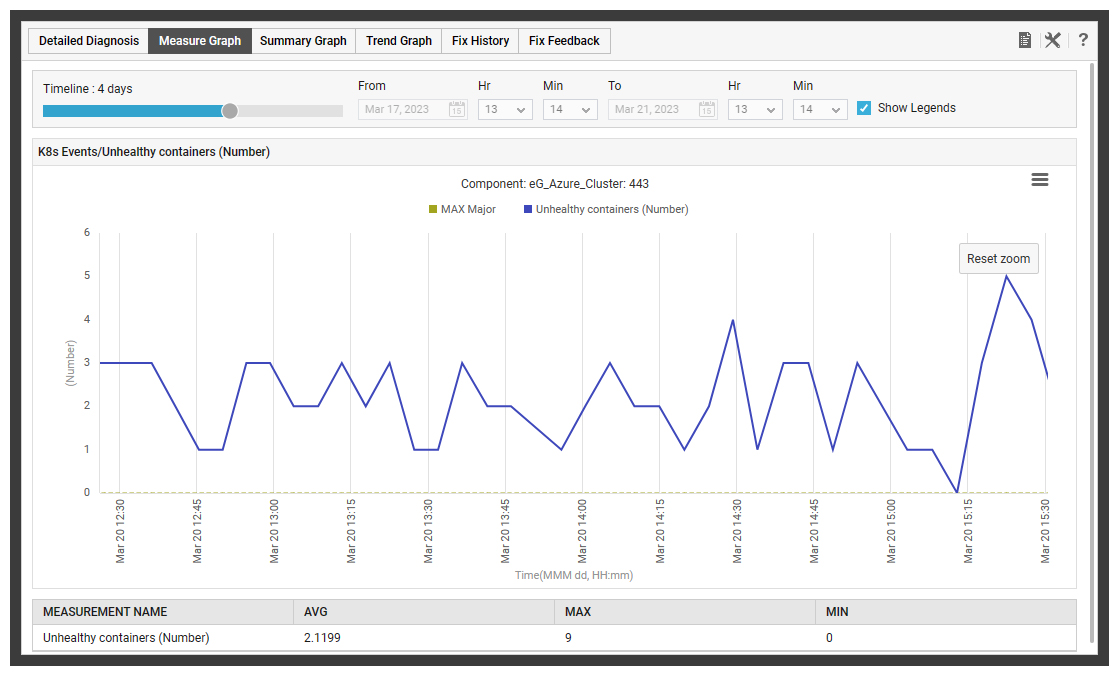
In Figure 13: A Kubernetes deployment was generating alerts owing to an unhealthy container. The administrator can temporarily disable the events test for K8s using the maintenance icon next to the test.
Within a minute or so – you may want to refresh the screen – the alert will be suppressed and a maintenance icon (a spanner crossing a screwdriver) will appear next to the appropriate test.
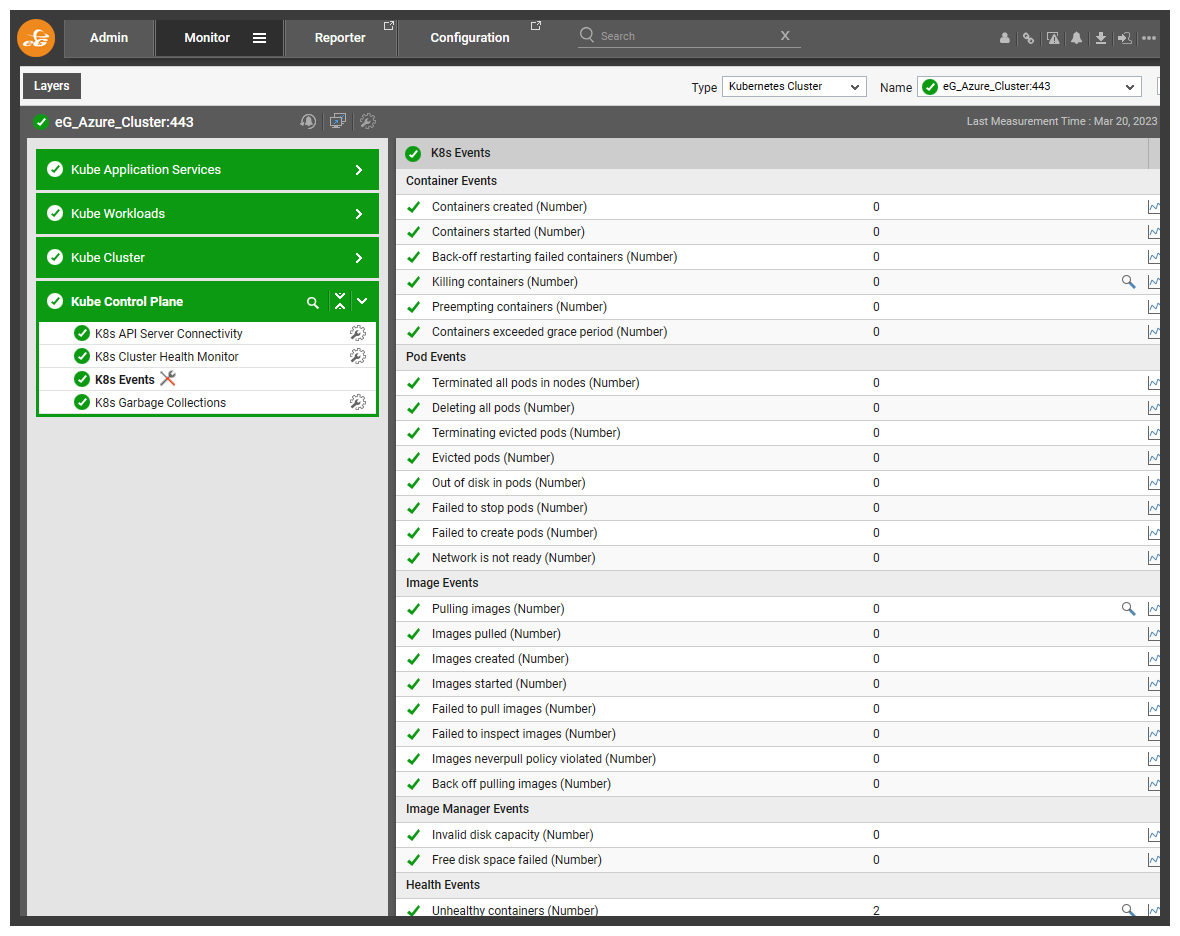
Hovering over the maintenance icon, will show details of the test policy.

Whilst the alert associated with the test will be suppressed. The tests and metric collection will continue ensuring a continuous history is preserved and that the admin can assess the impact of any changes they make while trying to rectify an issue.
Separating alerting from testing and monitoring in this way makes it less likely administrators turn off testing and forget to reinstate it. For this reason, the default window is set to a day and recurrent maintenance must be scheduled via the administrator features rather than the icon shortcuts.
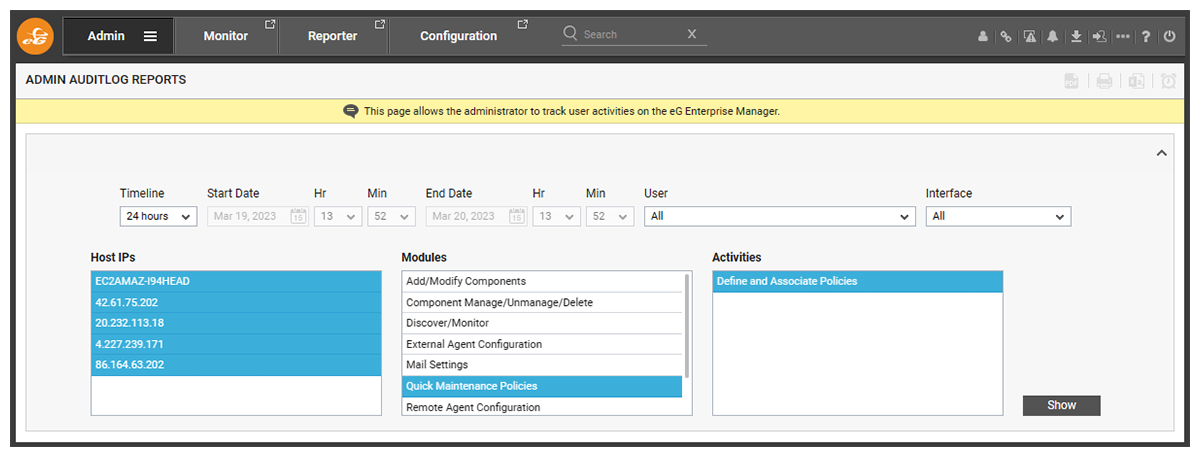
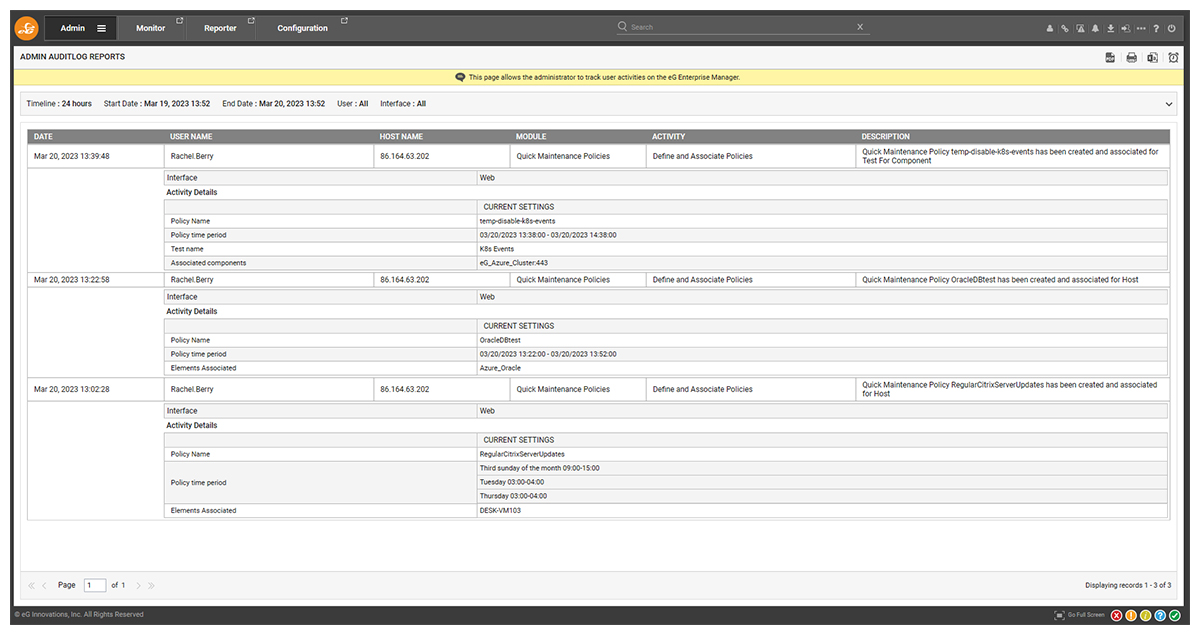
Auditing Maintenance Policy Usage
Administrator actions associated with maintenance policies are all captured in the eG Enterprise audit logs for retrospecitive analysis and compliance review. You can access these from the “Admin” tab via the menu path Audits->Admin.

Using the eG Enterprise REST API to Automate Maintenance
Auto-deployment and self-remediation workflows have become more common, with organizations increasingly adopting DevOps and IaC (Infrastructure as Code) workflows. To allow automation of alert suppression of components under maintenance, eG Enterprise provides a set of API functions that allow components to be put into maintenance and the creation, removal and application of maintenance policies within programmatic workflows.
For those unfamiliar with eG Enterprise APIs, CLI, cURL and similar interfaces, I’d recommend Pandian’s article – APIs for IT Monitoring Solutions | eG Innovations as a good introduction.
Details of the APIs available are covered in the eG Enterprise documentation, here: Introduction to eG Enterprise REST API (eginnovations.com).
This means that you can integrate, for example – automated server upgrades, into your CI/CD pipelines. Moreover, rather than turning off your synthetic testing and stop monitoring and alerting, you will ensure that any backup or alternative servers which users are diverted to are operational during the upgrade. If part of your infrastructure is out of service, you are usually more reliant on other components being up and running well and full visibility is even more important than normally.
The APIs do also allow fine control of individual tests and all tests associated with components but for maintenance operations and workflows the maintenance APIs are usually the best option unless your needs are niche.
A full range of test configuration APIs are available for other IaC workflows associated with configuration, see: Introduction to eG Enterprise REST API (eginnovations.com).
Managing maintenance via the eG Enterprise Mobile App for iOS or Android
For administrators wishing to access the eG Enterprise console on tablets or mobile devices the eG Enterprise Mobile App is available for both Android and iOS. Perfect for IT Ops and system administrators who work on larger campuses, hospital sites and off-site. The creation and application of maintenance policies is one of the many features of this rich app. Details of how to work with maintenance policies in the app are covered in the documentation, here: Working with Alarms in the eG Enterprise Mobile App.
Details on the eG Enterprise Mobile App for iOS and Android are available, here: eG Enterprise Mobile App for Remote IT Monitoring | eG Innovations.

Why use eG Enterprise – What do Cloud Native Alternatives such as Azure Monitor or Amazon CloudWatch do?
Azure Monitor enables alert suppression during maintenance via “Alert Processing Rules”, see: Alert processing rules for Azure Monitor alerts – Azure Monitor | Microsoft Learn. This means it can be a somewhat tedious and fiddly process to apply as a single server could have hundreds of alerts associated with it and will usually require some knowledge of how alerting was configured in the deployment. At scale, some degree of scripting and automation is usually required.
Enabling and disabling alarms on Amazon AWS for CloudWatch can be done via custom scripting using the APIs or CLI, see: Using Amazon CloudWatch alarms – Amazon CloudWatch and Enabling and Disabling Amazon CloudWatch Alarm Actions – AWS SDK for Ruby. The lack of a GUI mechanism to silence alarms is a pain point in the CloudWatch user community and there are some community self-help guides – such as amazon web services – Can AWS CloudWatch alarms be paused/disabled during specific hours? – Stack Overflow and Pause AWS CloudWatch Alarms on a Schedule Without Lambdas | Medium.
Alert or alarm suppression requires privileged admin access to cloud subscription and management accounts and eG Enterprise offers a secure and straightforward way for help desk operators, MSP self-service tenants and similar, to manage alarms without granting access to the cloud management platforms and portals.
eG Enterprise is an Observability solution for Modern IT. Monitor digital workspaces,
web applications, SaaS services, cloud and containers from a single pane of glass.
Further Information
- Configuration change tracking is becoming especially important in observability tools, to understand the impact of changes made and to source changes made by other teams or third parties that may have unintended consequences – for an admin’s overview see: Configuration and Change Tracking for IT Observability (eginnovations.com)
- This article has mentioned administrator auditing for compliance and traceability – furhter information on this is covered in an article by Krishnamurthi Srinivasan, see: Auditing Capabilities in IT Monitoring Tools | eG Innovations
- An overview on eG Enterprise APIs is given in, APIs for IT Monitoring Solutions | eG Innovations. If adopting CD/CI and IaC (Infrastructure as Code) workflows, this article includes considerations that need to be accounted for in monitoring strategies when using IaC and similar – see: How to Monitor IT Infrastructure when adopting IaC for VDI and Digital Workspaces | eG Innovations.
- Infrastructure-as-Code series: Practical monitoring in an IaC universe – CW Developer Network (computerweekly.com) covers CI / CD and IaC considerations for observability.