Hosting Applications in the Cloud
 These days, many IT executives believe that it is easier to deploy applications in the cloud than on-prem. They are also often under the misconception that once an application is hosted in the cloud, it is the responsibility of the cloud service provider to maintain the availability and performance of the application. This tends to be far from the reality and we have provided several reasons that IT teams can use to justify why relying on cloud native tools alone may increase costs and reduce service quality, see: White Paper | Top 10 Requirements for Performance Monitoring of Cloud Applications and Infrastructures.
In this blog, we will present a real-world case study of a logistics application deployed on the cloud and how a critical issue with this application was detected and addressed. This case study details the challenges an organization faces in getting help from cloud service providers when problems happen and how having their own monitoring tools and expertise in analyzing application performance is key for success.
The application involved in this case study is web-based, uses a multi-tier architecture, including a Java web front-end with an RDS database backend. RDS was chosen for its many benefits – reliability, scalability, etc. In this blog, I have included performance graphs of key metrics to provide useful reference points for those troubleshooting database-backed applications deployed on the cloud.
The Application Slowness Issue
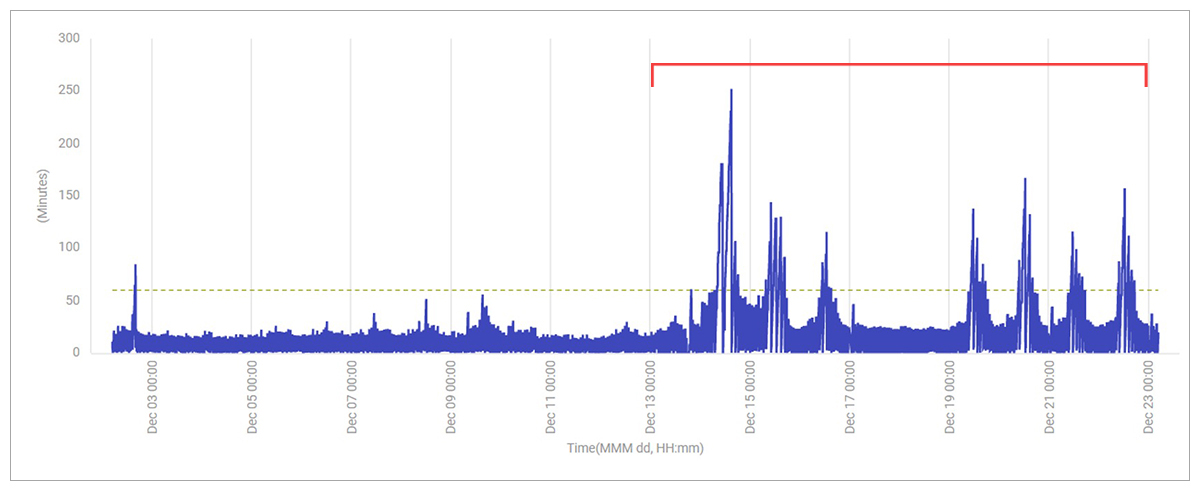
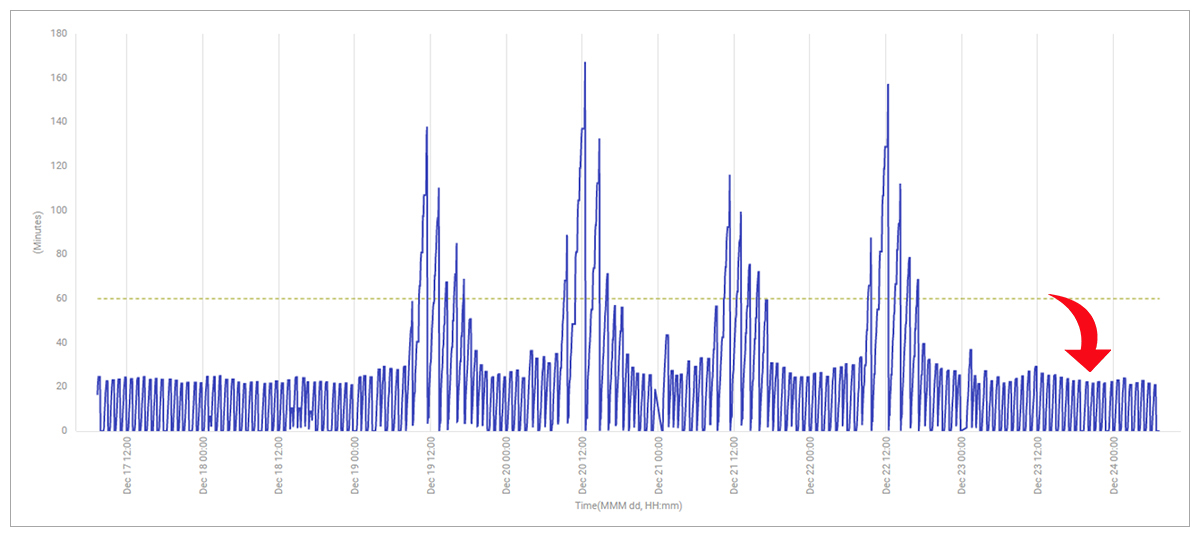
 During the busy retail period leading up to Christmas, administrators noticed a significant application slowdown. Every hour, the application has an order processing task that analyzes all orders from the previous hour and sends them for processing. Around Thursday 15th December, and again on Monday 19th December, issues were noticed with the application. Order processing which usually took less than 30 mins was suddenly taking well over 60 mins and sometimes taking as long as 2hrs (see Figure 1).
The Application Team’s Analysis: “It’s a Database Problem”
The problem was deemed to be an “application problem” and passed to the application team for analysis. The application team could see that TCP connections to the application server had increased significantly around the same times that order processing was slow (see Figure 2). This showed that there was clearly a problem.
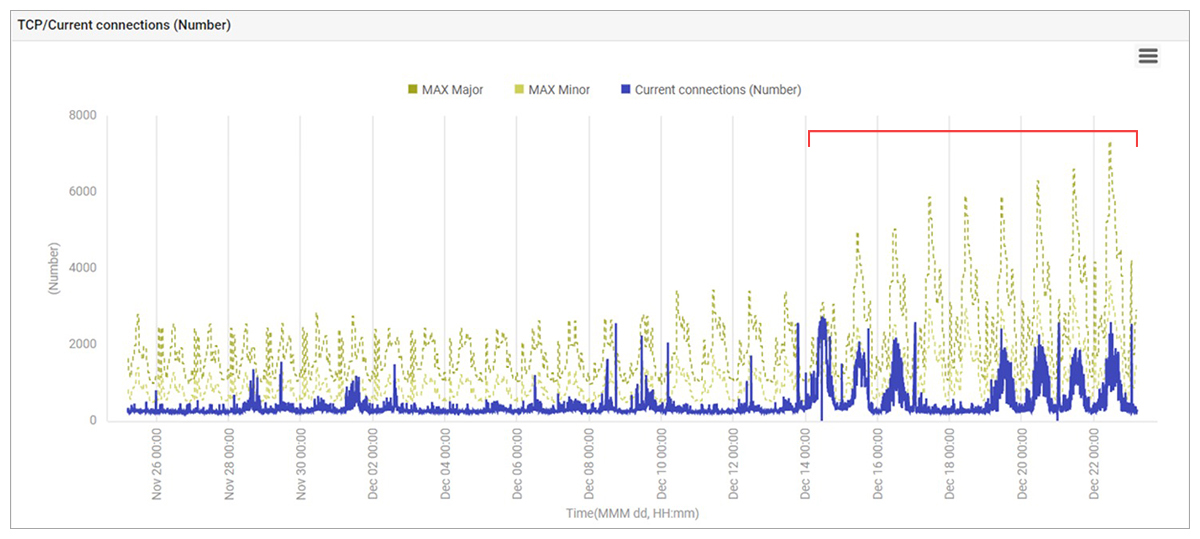
eG Enterprise had already been configured to track connections from the application server to the database server and it clearly showed that most of the connections in Figure 2 were connections established to the database server. The application team then concluded that there was probably a problem with the database server.
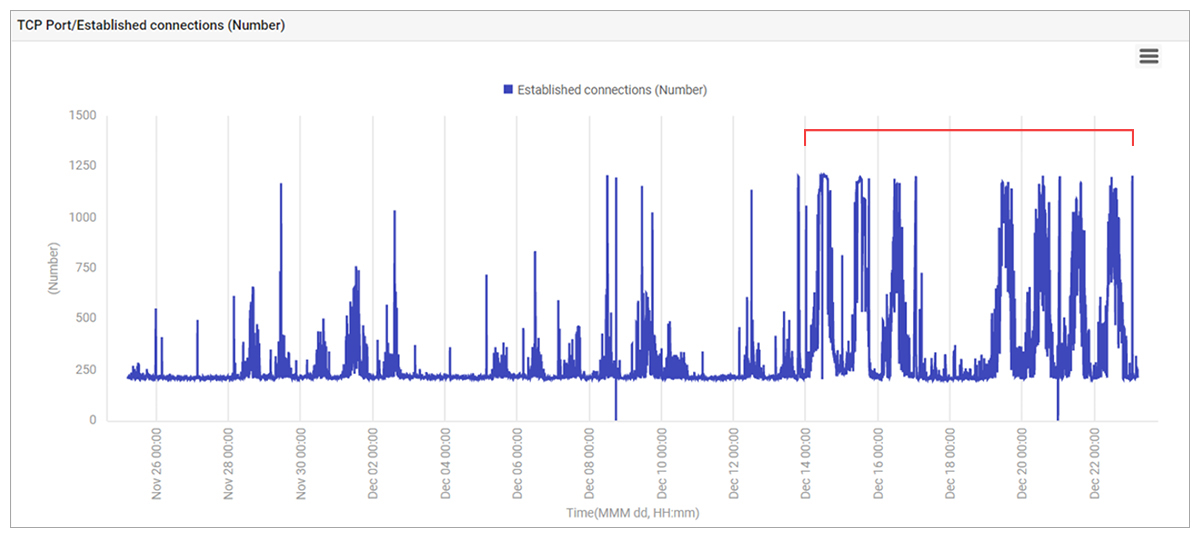
The application used database connection pooling and eG Enterprise was configured to monitor connections in the database pool that were active and in use. Figure 3 below proves that indeed the bottleneck was likely to be backend access to the database service (RDS). There were almost 1000 active connections suddenly to the backend. Notice database connections used to be around 250 at most times in the past, with the odd spike reaching 500 connections.
No changes to the application code had been made in the previous 6 weeks as the business had been in a code freeze period given the critical Christmas holiday retail season. This is a common best practice used in many enterprise organizations to minimize the risk of outages and to minimize MTTR in the event of an incident during the holiday season. Since no changes to the application code had been made, it could not have been an application issue. So was it a database issue?
 |
On a related note, the importance of tracking application and configuration changes and how to do this was covered in a recent article by a colleague, see: Configuration and Change Tracking is a Key for IT Observability.
|
The Database Team’s Analysis: “It’s an Application Problem”
 The database team used their expert tools for analysis. eG Enterprise was also available to provide a single pane of glass across the entire IT landscape across teams. Both sets of tools did not indicate any critical problems at the database level. The database service had some memory constraints, but this had been the case for several weeks and the application had been working fine.
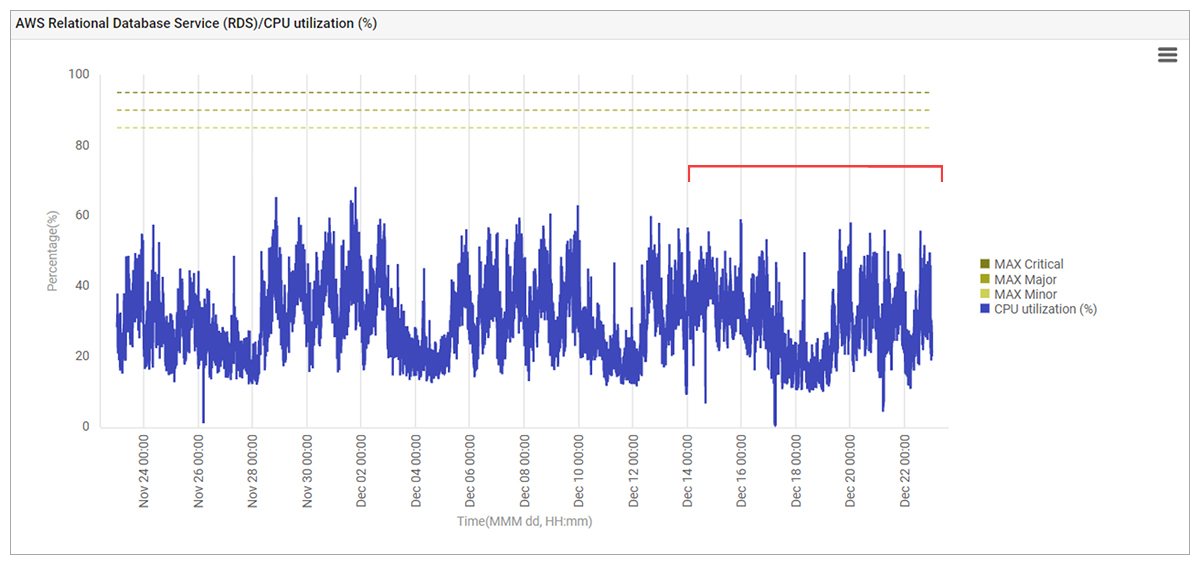
AWS CloudWatch was in place and used to track the database service’s CPU usage and there had been no change in behavior over the previous month either.
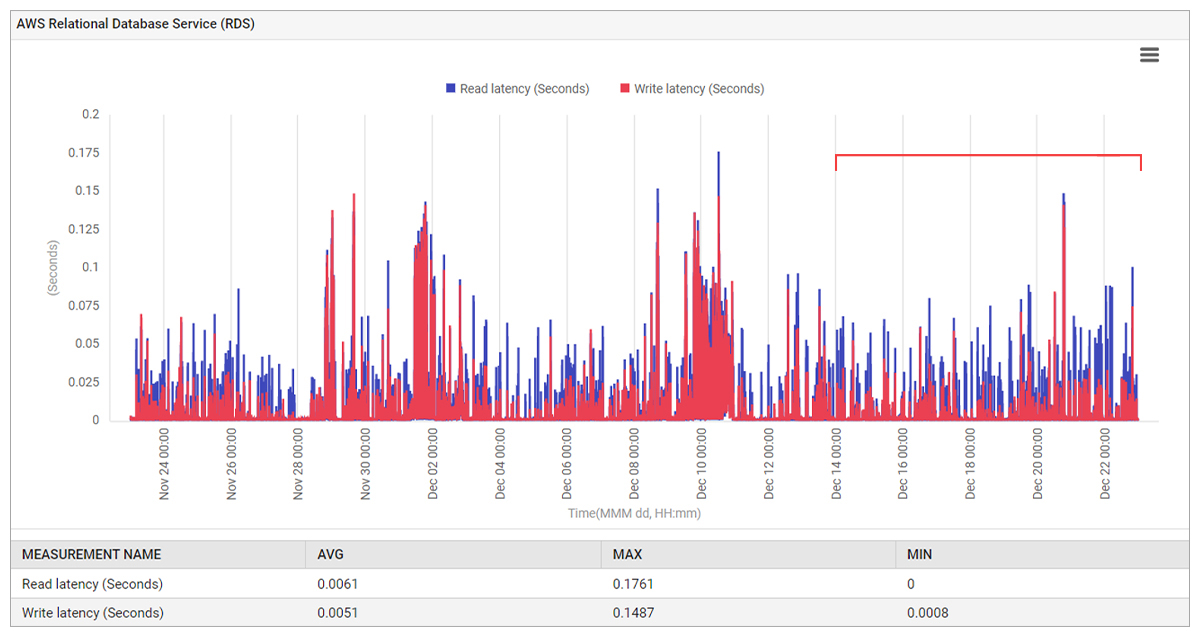
Read and write latency for the database service had not changed significantly and showed no abnormalities that correlated with the increased connection and TCP data.
Read and Write IOPS to the database service had not changed either. That is, the database load had not changed either (see Figure 6).
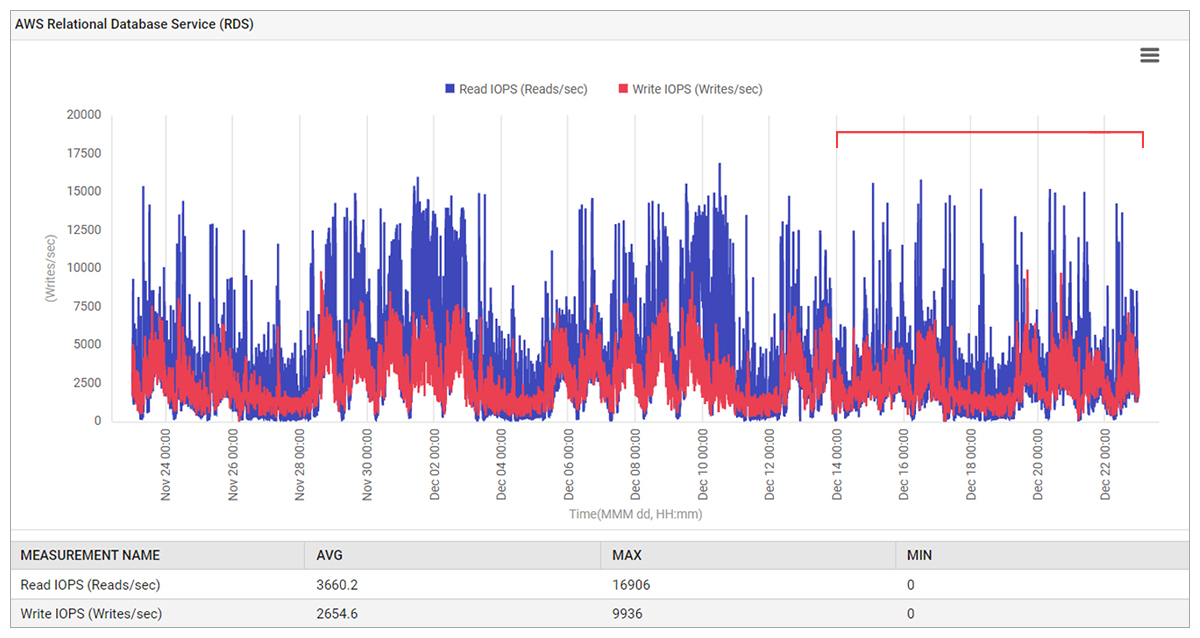
At this point the database team concluded that everything was fine at their end and there was no issue with the RDS service.
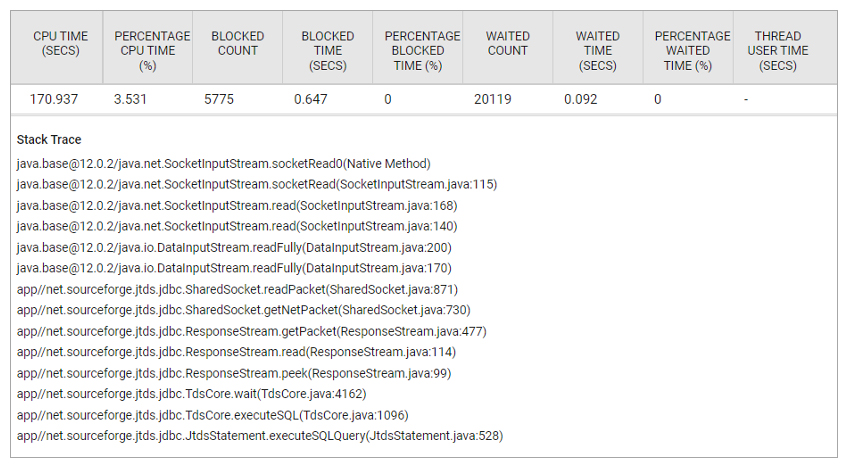
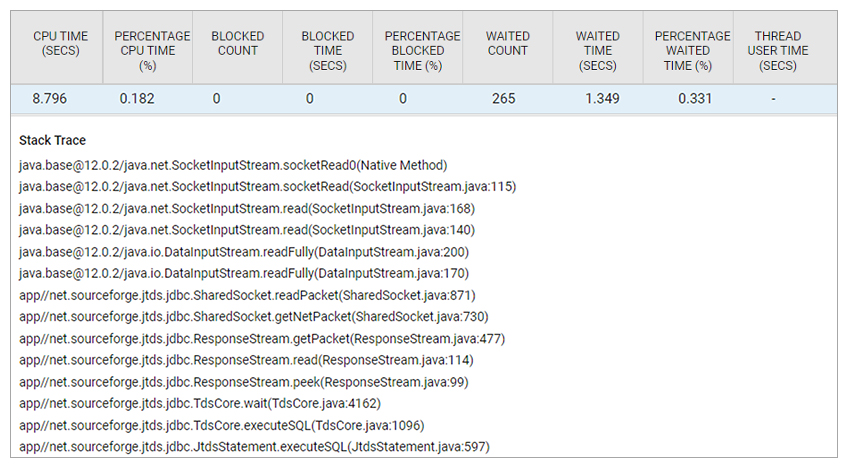
Yet, analysis of the Java application server’s stack (see Figure 7) indicated that database connections were waiting on the database service. The database team reviewed the stack traces, but their response was that connections from the application were idle and wasting database resources. Hence, in their view, there was an application issue!
Clearly, there was finger-pointing between the application and database teams and in the meantime, application performance suffered during the peak season.
The Ping-Pong Continues
 The Database team returned the issue to the Application team. Given that the problem occurred during the daytime when order levels were high and likely to be at peak levels, the question was whether the application workload had increased was increased. It is not unusual for influencer or viral promotions to cause a sudden and unexpected surge upon retail apps nor unusual for malicious / bot operators to attempt to overload apps in DoS (Denial of Service) type attacks.
However, analysis of data from previous weeks showed that the application workload had been very similar (see Figure 8).
Could it be a Cloud (AWS) issue?
 At this point the organization sought assistance from the support team of the cloud service provider (AWS). Two different sets of teams were involved – the EC2 team looking at the instance performance and the RDS team looking at the database performance.
The RDS team got back after their analysis recommending that the configuration of the RDS service be upgraded. This would have more than doubled the cost of the RDS service and while the business considered this recommendation, they chose to continue to explore other options because the application had been functioning well earlier and they had not had a root cause explanation to justify the change in behavior. The EC2 team did not have any findings of note either.
Where Could the Problem Lie?
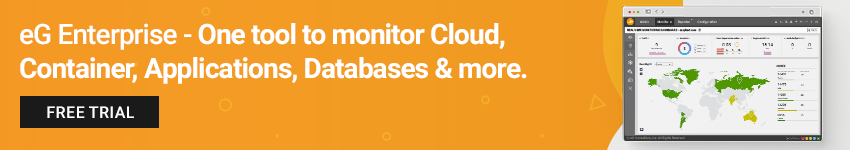
The Application team decided to investigate further as they still felt that a database issue would make the most sense and explored ways of proving this. The database service was, and continued to be, continually monitored in eG Enterprise using external, synthetic monitoring and there had been alerts indicating higher database response times during the problematic period.
The data in Figure 9 indicated that connection time to the database service had increased. The metric shown in the figure is just the connection time to the database service, not the query processing time. This was strange because both the application server and database service are in the same data center and same AWS availability zone which means:
- One should expect good latency between them.
- Could the network between the application server and the database service be a problem?
AWS support were again contacted and their staff analyzed the issue and reported that there was no issue in the interconnecting network.
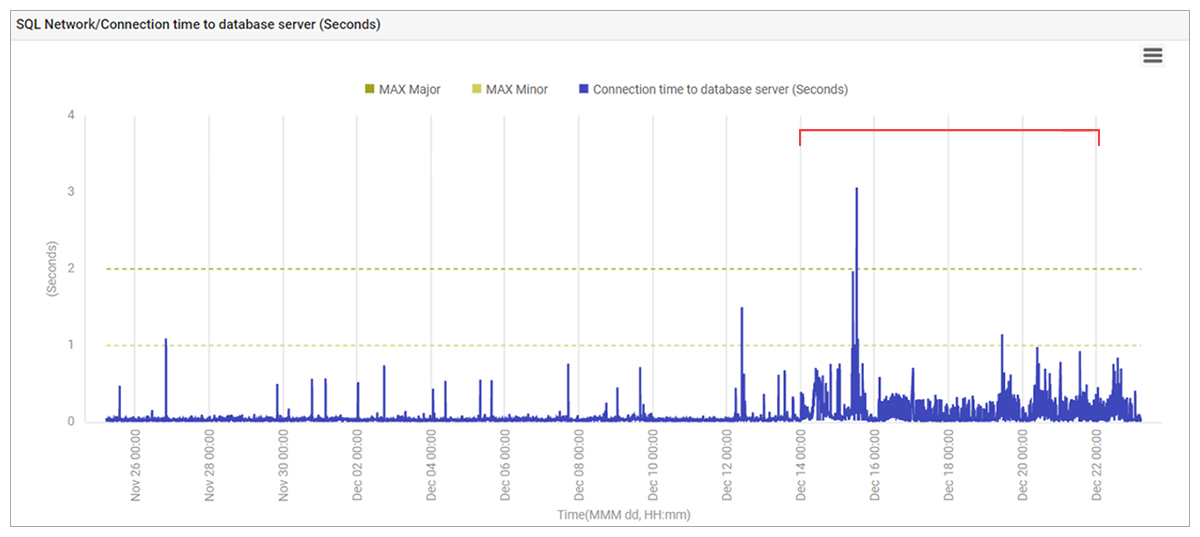
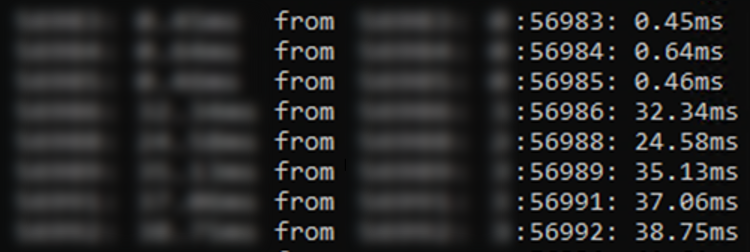
The application team again investigated by themselves. In-depth review of the TCP connection time recorded by eG Enterprise (Figure 10) showed that response time had large and significant variations.
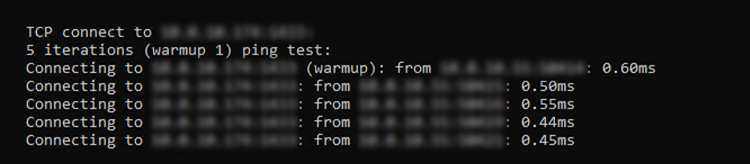
This was confirmed by manually executing the Sysinternals psping tool which also showed the response time variability.
If the database service was fine and the interconnecting network didn’t have an issue, could the problem be in the application server itself? CPU usage on the application server was observed to be high during the problematic period (initially this had been attributed to the increase in database connections that the server was handling). One suggestion mooted was to double the number of CPUs on the application server, which would have caused a 2x increase in cost to the business. Again, a potential quick fix was under consideration that would have led to increased ongoing costs.
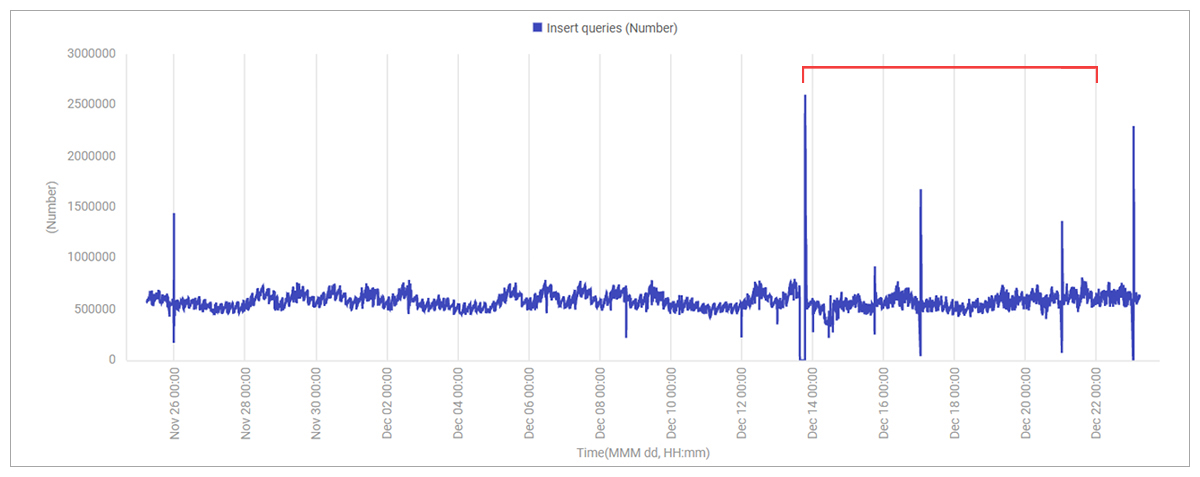
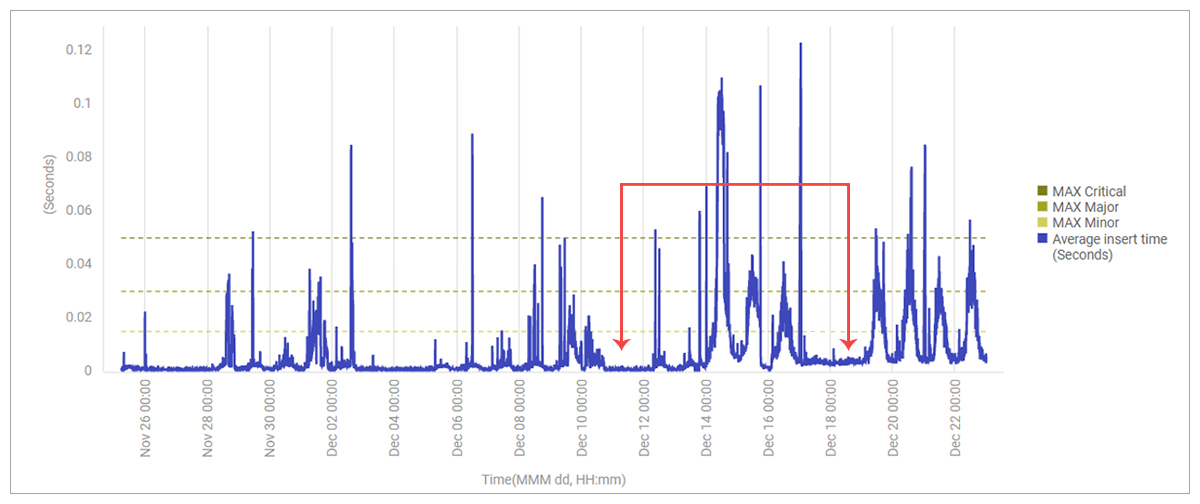
Analysis of database insert times from the application to the database service showed that the lower bound of insert time had itself increased suddenly – i.e., even during non-peak hours, database insert time was higher than normal.
Given the suspicion now was on the application server itself, it was decided to use a new VM to host the application server. And as if by magic, this solved the issue. TCP connection times to the database service were now stable and low again.
In the eG Enterprise console, the application’s database time for insert queries dropped drastically (Figure 14).
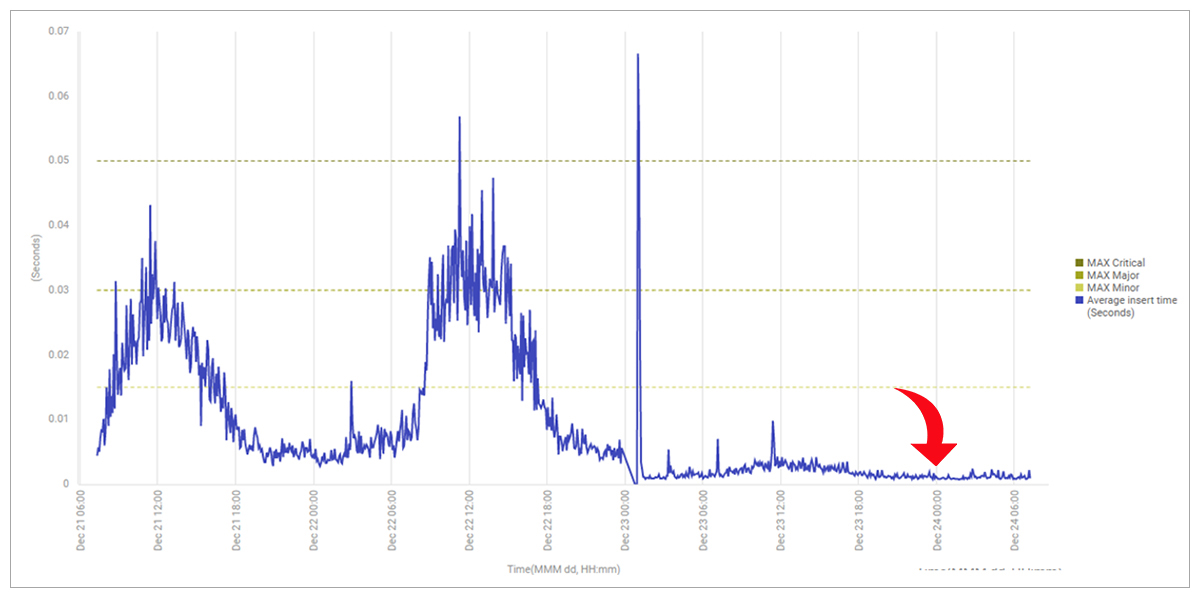
Most importantly the order processing task returned to its normal hourly behavior ensuring that retail orders were processed as needed maintaining critical revenue flow during the busy retail period in the final few days before Christmas.
To date, we/the customer does not have any explanation about why this problem occurred. For all we know, it could have been due to a faulty network card on the infrastructure hosting the EC2 instance. Or there could have been an update to the hypervisor that hosted the application server’s EC2 instance that triggered the application slowness issue. Since customers have no access to the underlying infrastructure in the cloud, there is no way of figuring the exact root-cause of the issue.
Conclusions and Takeaways
The customer’s experience shows the challenges with supporting business critical applications in the cloud.
- Given the lack of visibility into the cloud infrastructure, customers can risk being at the mercy of the cloud service provider. In-depth monitoring is needed to understand what is happening at each tier and each layer.
- One may have to live with incomplete root-cause diagnosis – especially when problems are in the Cloud service provider end. Maybe it was a bad network connection, maybe it was due to the physical server on which the application server VM was hosted, there could be a variety of reasons – and maybe we will never know.
- IT teams have to be willing to take an iterative approach to analyzing the root-cause of problems. IT teams equipped with good tools and confidence can avoid quick but expensive fixes such as double CPU, or buy a bigger RDS plan.
We have seen other issues where customer have been able to deduce internal cloud issues as the root cause and moving or rebuilding a server or VM has resolved the issue, such as: AWS Cloud Case Study: Troubleshooting Application Performance (eginnovations.com) – a probable NIC error causing TCP / SSL issues for a Java application hosted on a JVM.
eG Enterprise is an Observability solution for Modern IT. Monitor digital workspaces,
web applications, SaaS services, cloud and containers from a single pane of glass.
Further Reading
- If you enjoyed this postmortem blog post – you may enjoy this similar one, Troubleshooting Web Application Performance & SSL (Secure Socket Layer) Issues
- Or a more complex performance issue postmortem on Amazon’s AWS (Amazon Web Service) cloud, Application Performance Troubleshooting on AWS Cloud: A Case Study (eginnovations.com)
- Cloud outage monitoring is covered in: Is Azure Down? – Proactive Alerting for Azure Outages | eG Innovations
- A free whitepaper that will help you evaluate and quantify the value of end-to-end monitoring within a cloud strategy is available, see: White Paper | Top 10 Requirements for Performance Monitoring of Cloud Applications and Infrastructures (eginnovations.com)
- For information on eG Enterprise features for Retail and e-Commerce use cases, please see: IT Monitoring for Retail & eCommerce | eG Innovations