


For Azure Virtual Desktop (AVD) sessions, Microsoft exposes a set of user experience and graphics performance counters that eG Enterprise monitors out-of-the-box. These performance counters for Azure Virtual Desktop and Remote Desktop Protocol (RDP) / RemoteFX sessions can be used to troubleshoot AVD problems. The domain aware AIOps engine within eG Enterprise correlates these metrics with other data and metrics about the application, Azure environment, endpoints and dependencies to provide proactive alerting and root-cause diagnostics. There is no need to manually calculate or configure metric thresholds.
If you are using a monitoring tool other than eG Enterprise, I would recommend you set up alerting and proactive monitoring on the following metrics as a minimum:
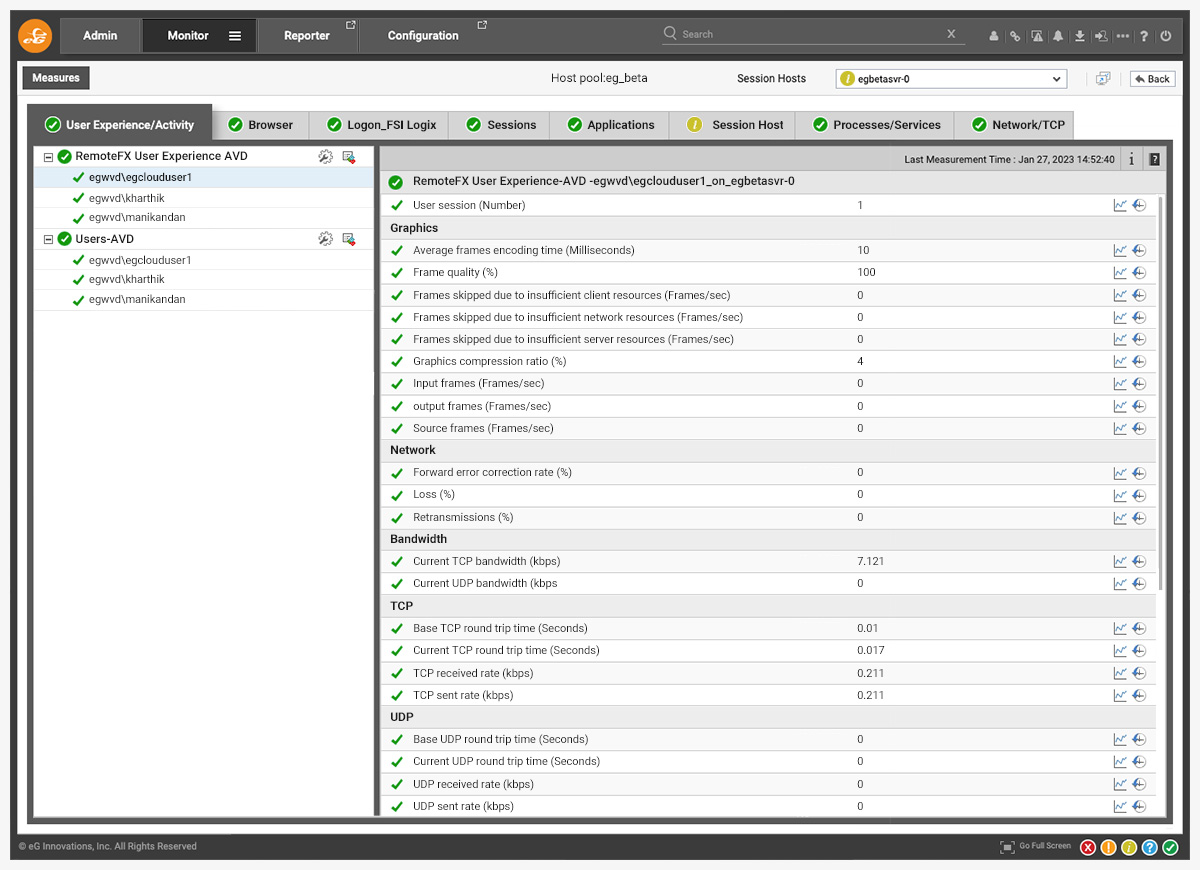
RemoteFX / RDP Metrics:
- Average frames encoding time (milliseconds)
- Frame quality (%)
- Frames Skipped due to insufficient client resources (frames/sec)
- Frames Skipped due to insufficient network resources (frames/sec)
- Frames Skipped due to insufficient server resources (frames/sec)
- Graphics compression ratio (%)
- Loss (%)
- Retransmissions (%)
User Metrics
- Memory usage of user processes (%)
- CPU time used by user sessions (%)
- Input delay for user sessions – avg (seconds)
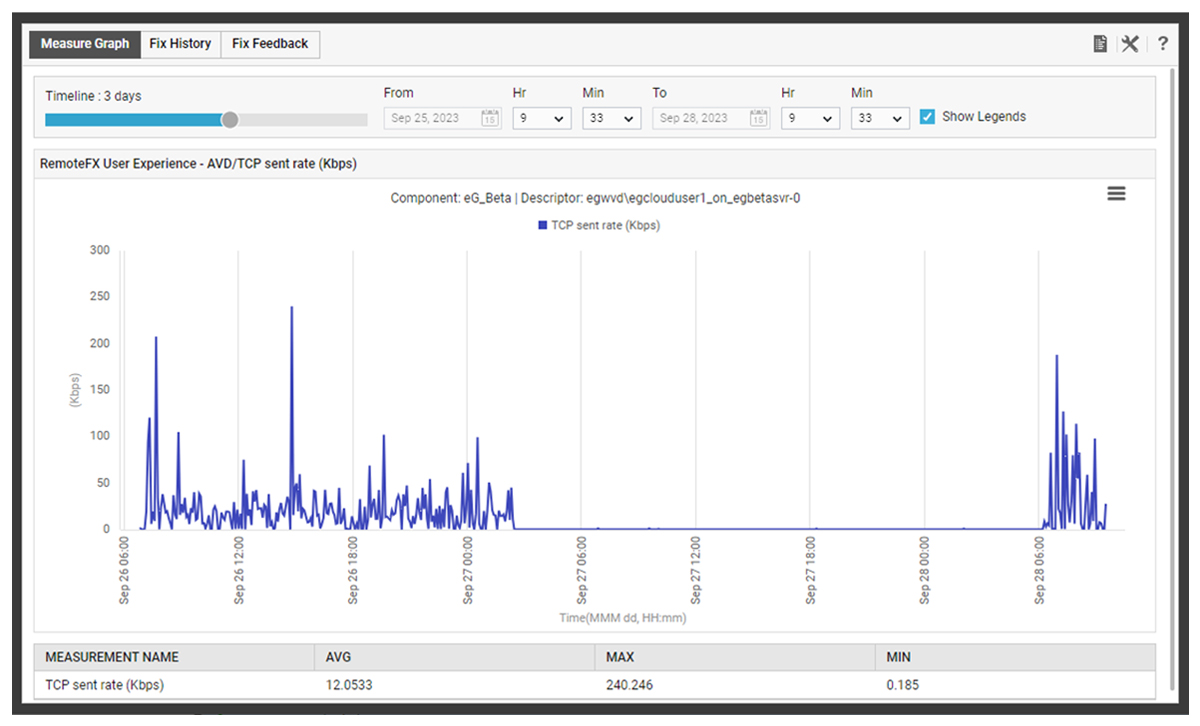
Beyond this you will want to capture key metrics such as the Frame Rate (fps, fps = frames per seconds). It is the best practice to capture both the input and the output rates. However, alerting on fps is a crude tool and frame rates in VDI / DaaS environments do not lend themselves well to setting metric thresholds and alerting. More on this later.
I must emphasize that today I am mostly focusing on a handful of metrics that an administrator should routinely monitor and put alerting in place for (eG Enterprise will do this automatically but in other monitoring tools including Azure Monitor this is often a manual process). Currently eG Enterprise actually continuously captures around 50 metrics pertaining to user experience, session behavior and protocol performance for AVD. The handful I will cover today though will capture most problems and for which alerting gives the best value to the administrator whilst avoiding alert storms.
How to Interpret Frame Rates in VDI and DaaS Environments – A Low Frame Rate does not Necessarily Mean a Bad User Experience!
You should monitor both:
- Output Frames/second
- Input Frames/second
These metrics tell you how often the local image is captured and sent to the user per second and how often an image is received by the user per second. Any difference between them is an indication of dropped / skipped frames.
Because these metrics are dynamic based on the content on the screen, they are generally unsuitable for setting metric thresholds and alerting on individually. A low frame rate is only a problem if the screen content is in fact rapidly changing, indeed a low frame rate is actually the desired state if the user is simply reading a static web page or similar. A high frame rate when the screen is not changing significantly, or the user is not interacting with the content is in fact a problem – basic H.264 codecs designed for video without the intelligence of RemoteFX sometimes churn out 30 fps even when content is static.
What is Average Frames Encoding Time (milliseconds)?
Indicates the average time taken for encoding the frames of a user. Compare the value of this measure across users to know for which user frames encoding took too long.
Encoding is a synchronous process that occurs on the session host, on the server in the single-session scenario and on the VM in the multi-session scenario. The value of this metric should be under 33 ms. If it is under 33 ms but you still have performance issues, there may be an issue with the application or operating system you are using.
eG Enterprise is automatically configured to raise alerts on problems when the Average Frames Encoding Time drops below 33ms for a significant time period that would impact user experience.
Microsoft’s own documentation of this metric is available here: Diagnose graphics performance issues Remote Desktop – Azure | Microsoft Learn.
What is Frame Quality (%)?
Indicates the quality of the output frame expressed as a percentage of the quality of the source frame for this user.
High frame rates produce a smooth representation of frames for the particular user, while low frame rates may cause rough or choppy representation of frames for the particular user. A high value is hence Measurements made by the test desired for this measure.
Compare the value of this measure across users to know which user received the poorest frame quality.
The quality loss may be due to RemoteFX, or it may be inherent to the graphics source. If RemoteFX caused the quality loss, the issue may be a lack of network or desktop resources to send higher-fidelity content. If desktop resources are causing the bottleneck, you may consider trying one of the following approaches to improve performance:
- Reduce the number of sessions per session host / AVD.
- Increase the memory and compute resources on the session host / AVD.
- Drop the resolution of the connection.
If network resources are causing the bottleneck, try one of the following approaches to improve network availability per session:
- Reduce the number of sessions per session host / AVD.
- Use a higher bandwidth network.
- Drop the resolution of the connection.
If client resources are causing the bottleneck, try one of the following approaches to improve performance:
- Install the most recent Remote Desktop client.
- Increase memory and compute resources on the client machine.
Even with adaptive protocols that save bandwidth at the expense of frame quality, a value of less than 85% will almost certainly impact the user experience and metric thresholds and alerting in systems other than eG Enterprise would need to be configured.
What are Frames Skipped due to insufficient client resources (frames/sec), Frames Skipped due to insufficient network resources (frames/sec) and Frames Skipped due to insufficient server resources (frames/sec)?
If the value of the Output Frames metric is less than that of the Input Frames measure, it means that frames are being skipped. The ‘Frames skipped….’ Measures will identify the cause. A high value for any of the ‘Frames skipped…’ measures implies that the problem is related to the resource the counter tracks. For example, if the client does not decode and present frames at the same rate the server provides the frames, the frames skipped due to insufficient client resources will be high.
What is Graphics Compression Ratio (%)?
The Graphics Compression Ratio is the ratio of the number of bytes encoded to the number of bytes input for this user. The compression ratio typically affects the quality of the image users see on their screen. Generally, the higher the compression ratio, the poorer the quality of the resulting picture. Ideally therefore, the value of this measure should be 0. You can compare the value of this measure across users to identify that user whose screen image quality was poor owing to high compression. If using a system without automatic thresholds set up and alerting you probably will want to configure alerting if this value exceeds 5% as some users will become aware of compression artefacts at this level.
What is Loss (%)?
This is a network metric which indicates the percentage of packets lost when being transmitted to this user. A high value indicates that a large number of packets were lost without being retransmitted. By comparing the value of this measure across users, you can find that user who has suffered the maximum data loss. This could be owing to a bad network connection between the remote user terminal and the AVD. A value for this metric of over 60% should trigger an alert as it is indicative of a serious problem, this is automatically configured out-of-the-box for eG Enterprise users.
What is Retransmissions (%)?
Indicates the percentage of packets that have been retransmitted to this user. Retransmissions should only occur when it is certain that a packet to be retransmitted was actually lost. Redundant retransmissions can also occur because of lost acknowledgments, coarse feedback, and bad retransmissions. Retransmission rates over 5% can indicate degraded network performance on a LAN. The internet may vary between 5 and 15 percent depending upon traffic conditions. Any value above 25 percent indicates an excessive number of retransmissions that will significantly increase the time for the file transfer and annoy the user.
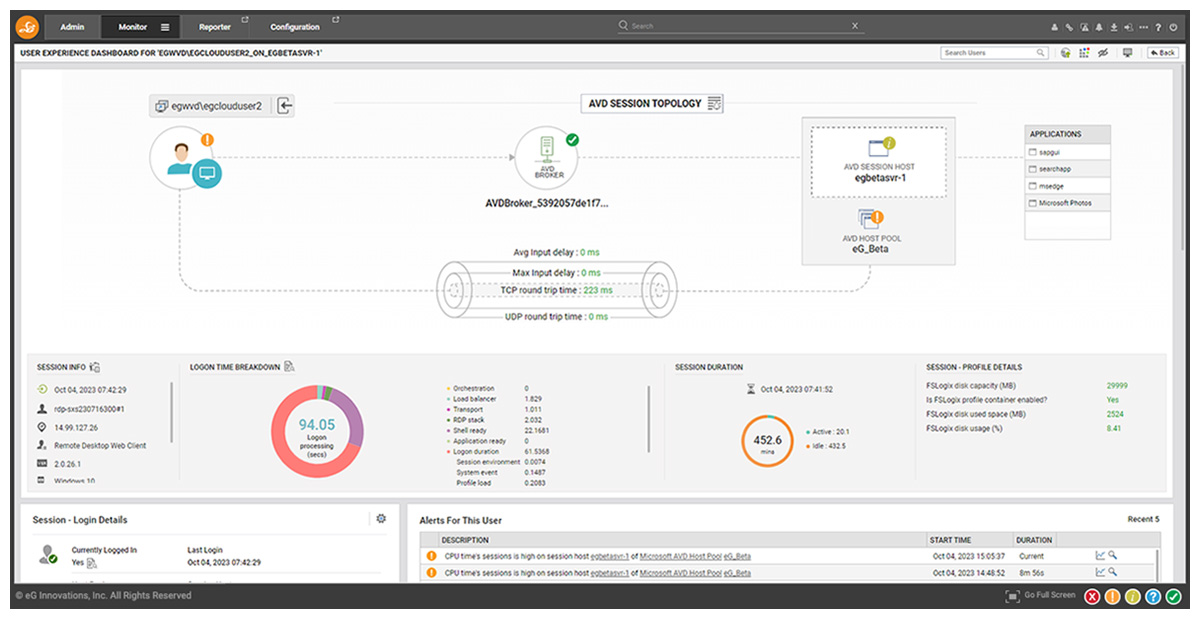
Input delay for user sessions – avg (seconds) – a key AVD user experience metric
This metric is AVD’s User Input Delay counter, a detailed explanation of this key AVD user experience metric is available from Microsoft: Use performance counters to diagnose application responsiveness problems on Remote Desktop session hosts | Microsoft Learn.
This metric indicates the average amount of time lag detected between the user’s input through any input device (e.g., mouse, keyboard) and the time at which the AVD detected the input. The higher this metric is reflects whether the application’s user interface (UI) was locked and unresponsive for that period of time in seconds. Ideally, the value of this measure should be 0 or very low. Alerting is automatically implemented for this metric within eG Enterprise when the input delay exceeds 0.5s for an appropriate time window.
eG Enterprise also captures the Input delay for user sessions – max (Seconds) which indicates the maximum amount of time lag detected between the user’s input through any input device (e.g., mouse, keyboard) and the time at which the AVD responds to the input.
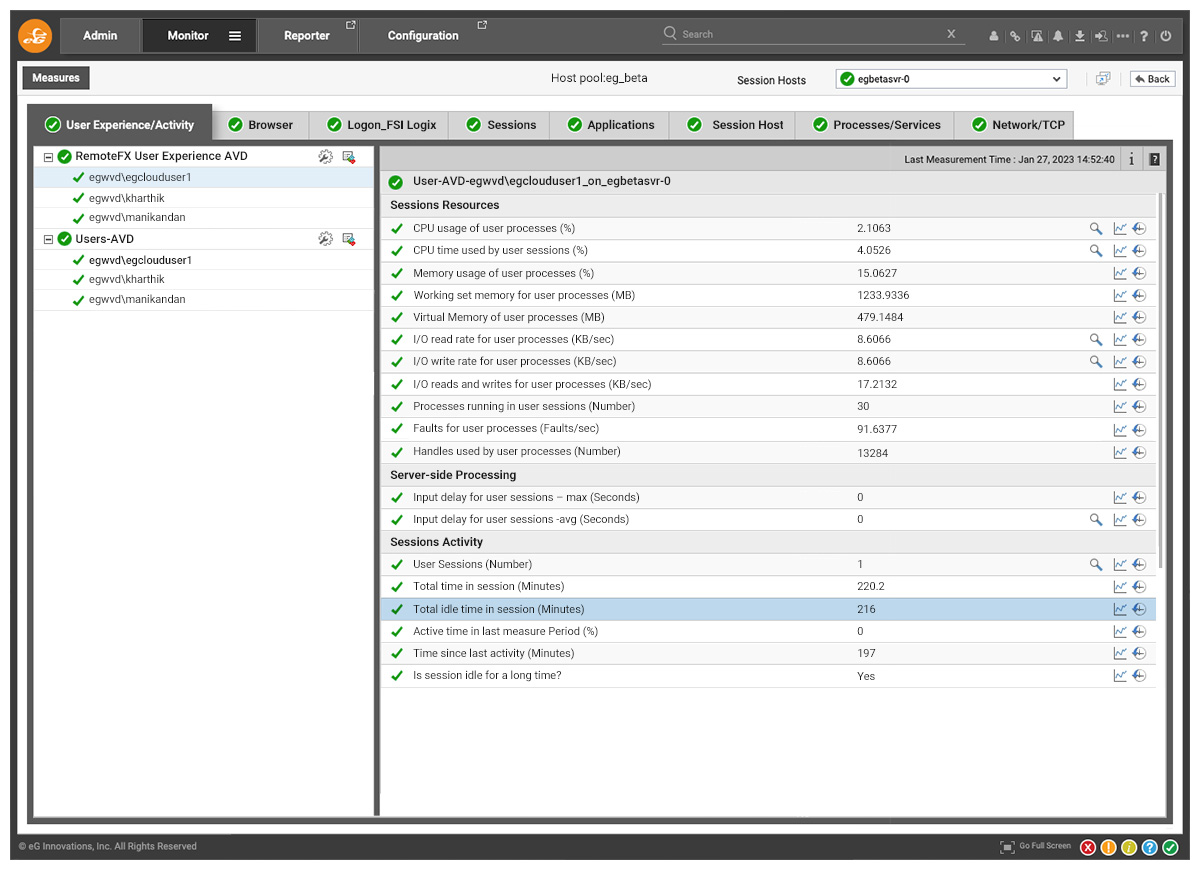
Memory usage of user processes (%)
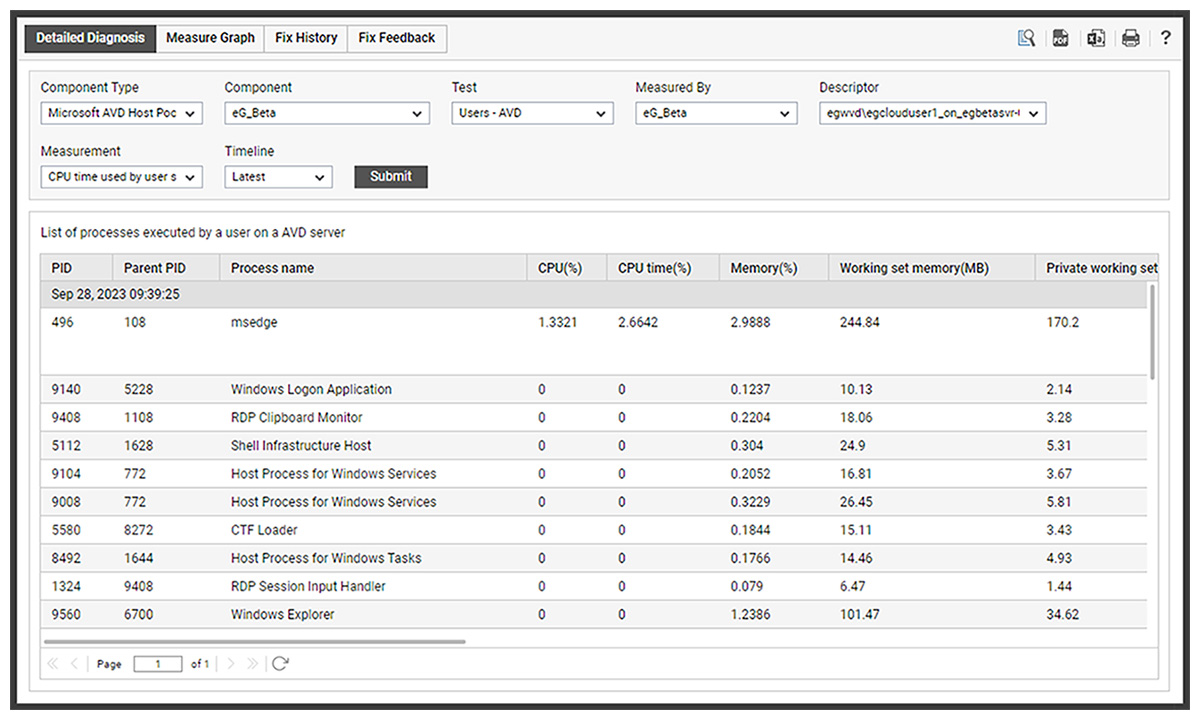
This value represents the ratio of the resident set size of the memory utilized by the user to the physical memory of the host system, expressed as a percentage. If a user is connected via multiple sessions, the value reported is the sum of all memory utilizations across all the sessions. This value indicates the percentage of memory resources that are used up by a specific user. By comparing this value across users, an administrator can identify the heaviest users. A detailed diagnosis will be available within eG Enterprise (use the magnifying glass icon to access it), you can check this detailed diagnosis to view the offending processes/applications.
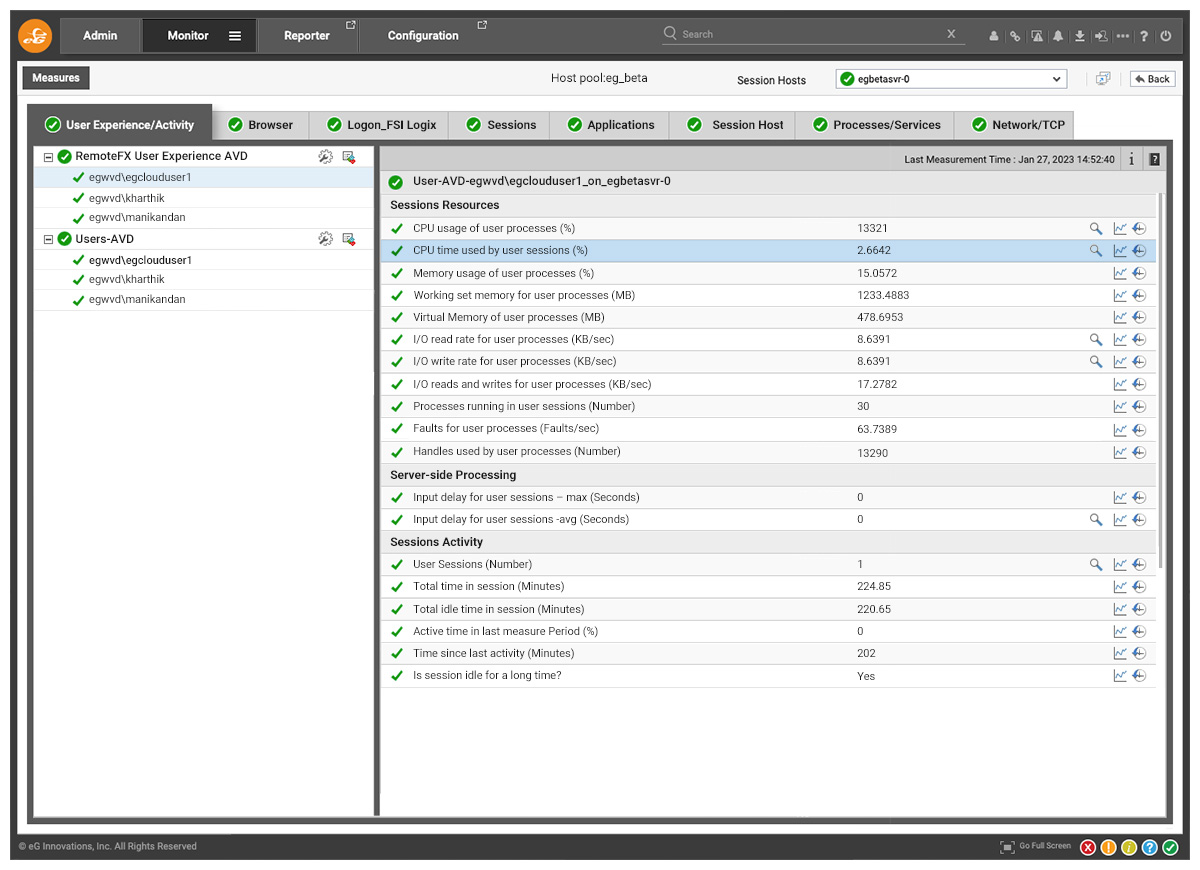
CPU time used by user sessions (%)
Indicates the percentage of time, across all processors, that a user used the CPU. In contrast, the CPU usage for a user’s processes measure indicates the percentage of overall CPU time that a user is using. For example, if a user is taking up one of the CPUs for 100% of the time and there are 8 CPUs on the AVD, CPU usage for user’s processes will be 12.5% (100/800). While 12.5% may seem to be a low number, the fact that the user is taking up one of the CPUs of the AVD is significant.
Hence, CPU time used by user’s session measure is a better indicator of CPU usage by users. In the above example, since the user is consuming 100% of one processor, CPU time used by user’s session will be 100%. A high value of this measure or a consistent increase in the value of this measure demands attention. Use the detailed diagnosis to know what CPU intensive activities are being performed by the user.
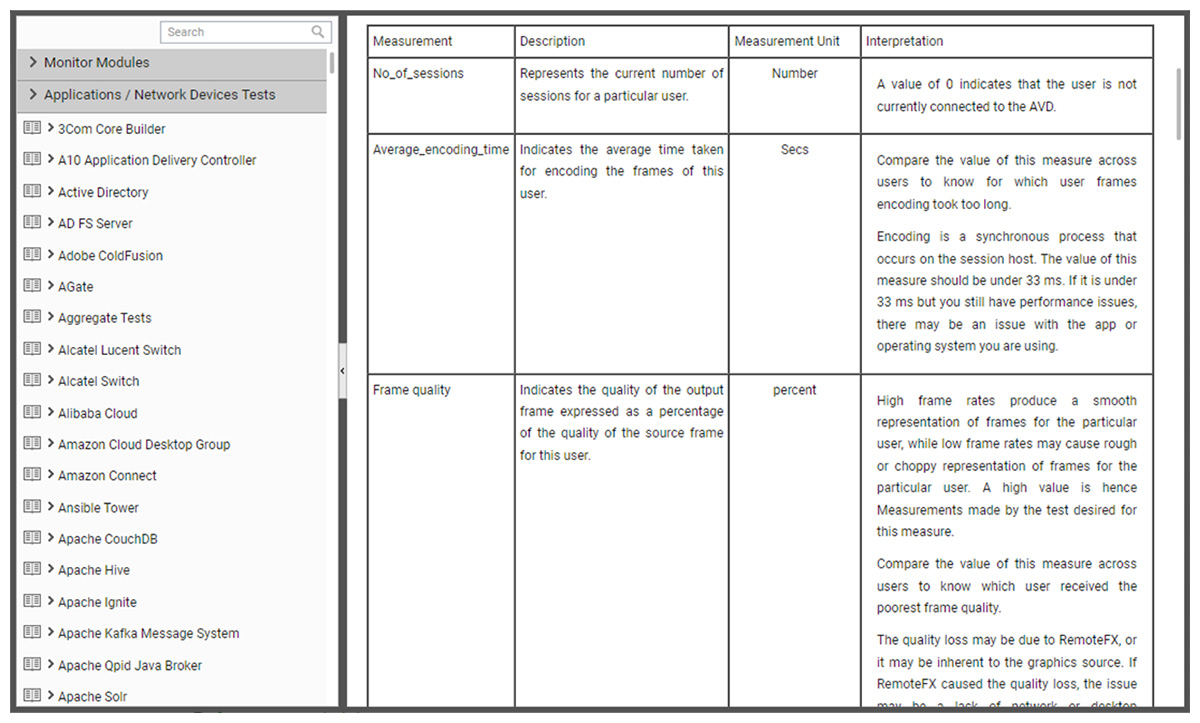
Understanding the Key AVD User Experience Metrics to Monitor
Often the first point of call for a user experiencing issues will be a general IT support service or helpdesk rather than an experienced AVD administrator with an understanding of RTT (Round Trip Time) or User Input Delay metrics.
To assist those running helpdesk operations, eG Enterprise includes a built-in knowledge base that explains each metric and alert. Helpdesk operators have instant access to a detailed understanding of the metric, expected values and if appropriate insights into resolution paths, and other considerations.
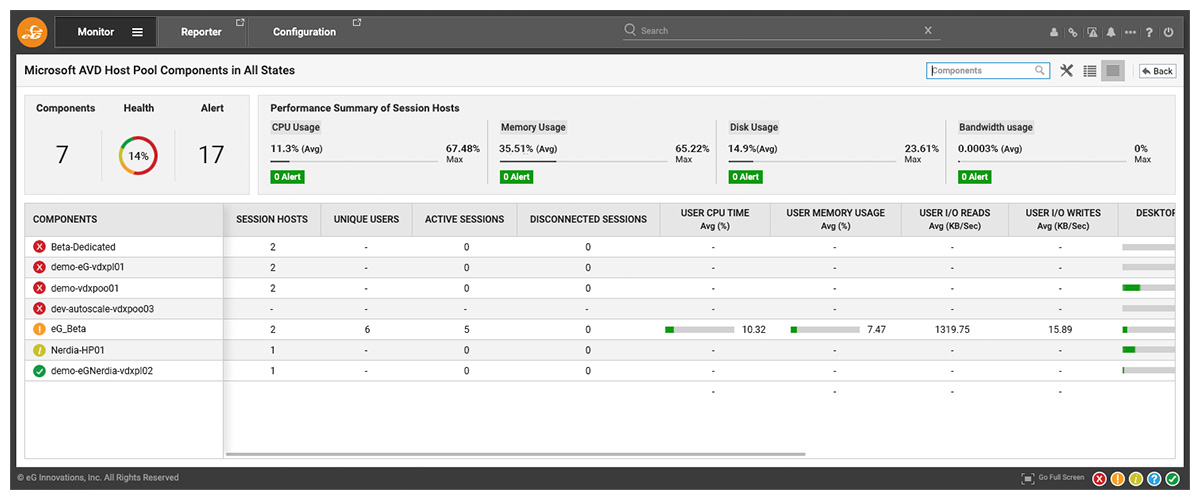
The User Experience Dashboards and reports supplied out-of-the-box for AVD within eG Enterprise are designed to give helpdesk operators, AVD administrators and the whole business appropriate insights into the AVD user experience being delivered appropriate to their role and interest.
Conclusion
Whatever monitoring tool you are using to monitor and ensure a good AVD user experience, Azure Monitor or a third-party tool, I’d strongly recommend setting up appropriate alerting on the few key metrics mentioned above, namely:
RemoteFX / RDP Metrics:
- Average frames encoding time (milliseconds)
- Frame quality (%)
- Frames Skipped due to insufficient client resources (frames/sec)
- Frames Skipped due to insufficient network resources (frames/sec)
- Frames Skipped due to insufficient server resources (frames/sec)
- Graphics compression ratio (%)
- Loss (%)
- Retransmissions (%)
User Metrics
- Memory usage of user processes (%)
- CPU time used by user sessions (%)
- Input delay for user sessions – avg (seconds)
Of course, with eG Enterprise this will be set up out-of-the-box for you.
eG Enterprise is an Observability solution for Modern IT. Monitor digital workspaces,
web applications, SaaS services, cloud and containers from a single pane of glass.
Learn more
- You may like to explore our ultimate end-to-end monitoring guide for AVD, which covers AVD user experience and AVD monitoring and troubleshooting beyond user sessions, see: Ultimate guide to monitoring Azure Virtual Desktop Technology | White Paper.
- An overview of how the AIOps-powered eG Enterprise monitoring platform works, and its key capabilities is provided, here: Azure Virtual Desktop Monitoring | eG Innovations.
- If you are using Nerdio to manage and deploy your AVD landscape, you may like to explore our eG Enterprise monitoring integration with Nerdio, see: Nerdio Manager: Simplify and Perfect AVD Deployment and Operation (eginnovations.com) and Using Nerdio Manager to Deploy eG Enterprise for AVD Monitoring.
 Babu is Head of Product Engineering at eG Innovations, having joined the company back in 2001 as one of our first software developers following undergraduate and masters degrees in Computer Science, he knows the product inside and out. Based within our Singapore R&D Management team, Babu has undertaken various roles in engineering and product management becoming a certified PMP along the way.
