


Event logging for Microsoft Windows provides a standard, centralized way for applications and the operating system to record important software and hardware events. The event-logging service (eventlog) stores events from various sources in a single collection called an event log. The system administrator can use the event log to help determine what conditions caused the error and the context in which it occurred. TechTarget have an excellent overview of Windows event logs available.
The Windows event log is a detailed record of system, security and application notifications stored by the Windows operating system that is used by administrators to diagnose system problems and predict future issues. Applications and the operating system (OS) use these event logs to record important hardware and software actions that the administrator can use to troubleshoot issues with the operating system. The Windows operating system tracks specific events in its log files, such as application installations, security management, system setup operations on initial startup, and problems or errors.
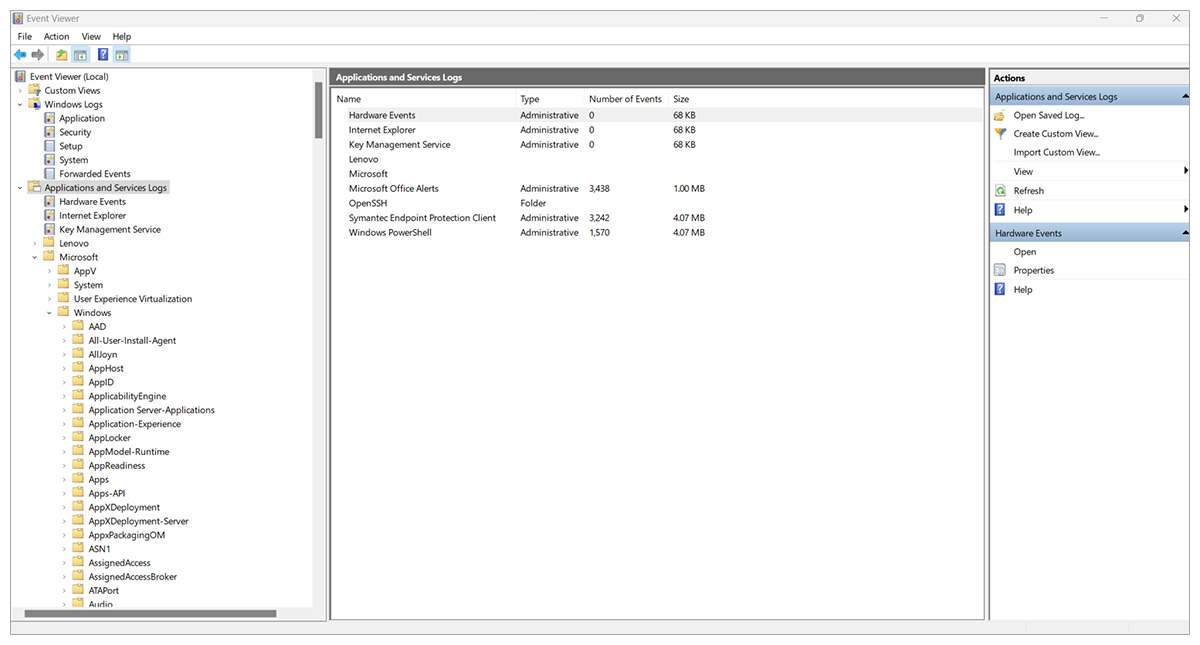
The event log contains the following standard logs as well as application and services log:
| Log | Description |
| Application | Contains events logged by applications. For example, a database application might record a file error. The application developer decides which events to record. |
| Security | Contains events such as valid and invalid logon attempts, as well as events related to resource use such as creating, opening, or deleting files or other objects. An administrator can start auditing to record events in the security log. |
| System | Contains events logged by system components, such as the failure of a driver or other system component to load during startup. |
| CustomLog | Contains events logged by applications that create a custom log. Using a custom log enables an application to control the size of the log or attach ACLs for security purposes without affecting other applications. Custom Logs can be created using the Event Viewer tool. |
| Application and Services Logs | eG Enterprise does not track or monitor all these logs by default. However, a customer can use our “eG Custom Event log” functionality to monitor and track any of these logs or Windows CustomLogs as they desire. |
How can I use the information in a Windows Event Log?
The most common usage of the Windows Event Log is for retrospective debug and analysis in scenarios where a problem has arisen, and a Windows system suffers a failure or performance issues resulting in negative impacts on end-users. The logs are examined or parsed, often manually or with user-instigated tools to search for events that correlate to the issue and may indicate the possible cause
By periodically viewing the event log, the system administrator may be able to identify problems (such as a failing disk, unauthenticated logon attempts, etc) before they affect end user but of course as a manual process it would be hit and miss as to whether issues were detected.
Modern enterprise IT organizations are more likely to automatically and proactively monitor the information in the Windows Event Log either by scheduling their own scripts or using out-of-the-box software such as eG Enterprise. New events written to the logs are proactively and continuously examined and in the event of an event that indicates an issue an alarm or alert is automatically triggered to notify the administrator.
Organizations adopting a Security Information and Event Management (SIEM) strategy are increasingly taking a proactive approach to event log monitoring. For more information on the benefits and ROI of investing effort in proactive monitoring, see: What is Proactive Monitoring and Why it is Important.
The Windows Event Log Service (eventlog) is available to third parties to log events. ISVs can ensure issues in their own applications are recorded within the Windows Event Logs – if they choose to do so. In practice the level of logging implemented varies significantly between applications.
Event Types, Levels and Keywords
In many log viewing tools you will see a “Type” column/field although the Windows Event Viewer doesn’t have this column. Historically there were five types of events that can be logged. All of these have well-defined common data and can optionally include event-specific data.
The application indicates the event type when it reports an event. Each event must be of a single type. The Event Viewer displays a different icon for each type in the list view of the event log.
The following table describes the five original event types used in event logging.
| Event type | Description |
| Error | An event that indicates a significant problem such as loss of data or loss of functionality. For example, if a service fails to load during startup, an Error event is logged. |
| Warning | An event that is not necessarily significant but may indicate a possible future problem. For example, when disk space is low, a Warning event is logged. If an application can recover from an event without loss of functionality or data, it can generally classify the event as a Warning event. |
| Information | An event that describes the successful operation of an application, driver, or service. For example, when a network driver loads successfully, it may be appropriate to log an Information event. Note that it is generally inappropriate for a desktop application to log an event each time it starts. |
| Success Audit | An event that records an audited security access attempt that is successful. For example, a user’s successful attempt to log on to the system is logged as a Success Audit event. |
| Failure Audit | An event that records an audited security access attempt that fails. For example, if a user tries to access a network drive and fails, the attempt is logged as a Failure Audit event. |
Selected activities of users can be tracked by auditing security events and then placing entries in a computer’s security log.
Starting with Windows Vista (Windows Server 2008), Microsoft removed “Type” from the event schema and replaced it with “Level”. Recent versions of Windows now use the following levels: Critical, Error, Warning, Information, Verbose (software developers are free to extend this set and add their own customized levels). These levels define event severity, but they do not define audit status (i.e. success or failure). There is now a new event attribute called keywords. Keywords are a 64-bit mask, 2 bits of this mask represent Audit Success and Audit Failure events.
These changes means many viewers and parsers are inconsistent in how data is exposed and in particular vary in how security logs are handled. When a modern version of the Windows Event Viewer tool displays the Security event log, it shows Keywords column and hides Level column by default.
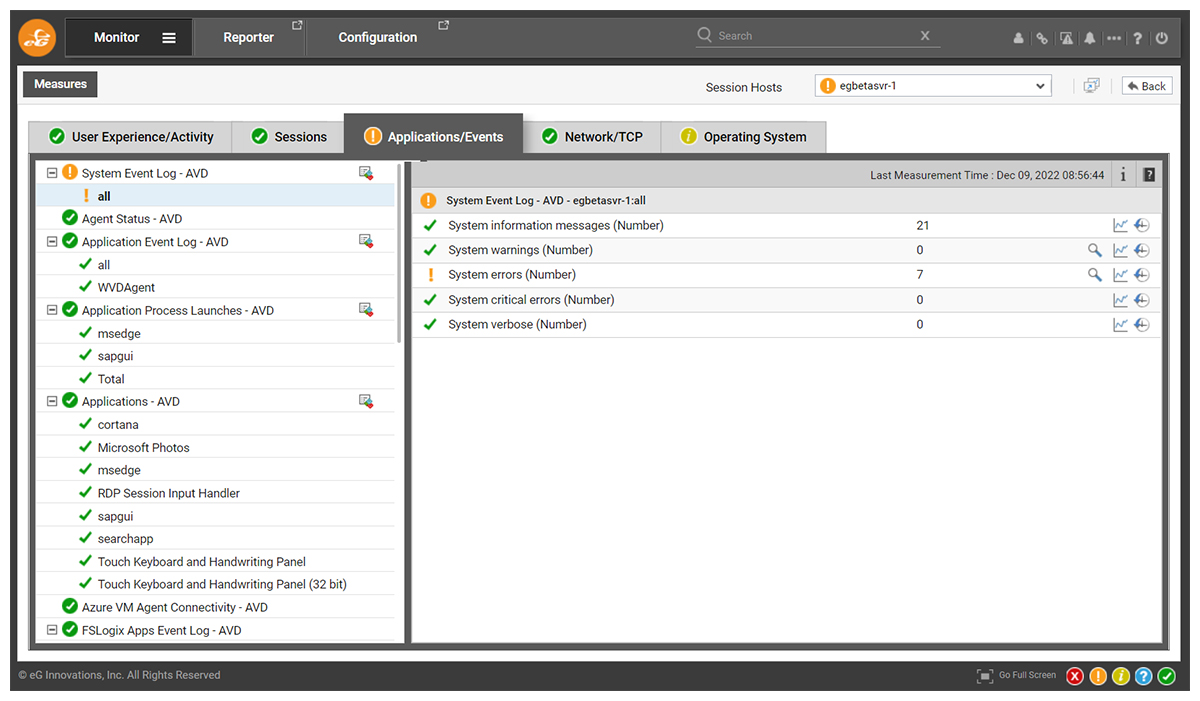
You will see the event level exposed with the eG Enterprise management console, events are marked as being verbose, informational, warning, or critical and shown alongside errors.
What are the elements of a Windows Event Log?
The structure of windows events are defined in an XML schema, see: Event Schema Elements – Win32 apps | Microsoft Learn.
How does eG Enterprise monitor Windows Event Logs?
eG Enterprise monitors Windows Event Logs using an agent. There are several security issues associated with agentless monitoring of Event Logs and for this reason eG Enterprise only supports secure agented monitoring. The event log record has both single- and double-byte characters in the event description. These characters are identified correctly from the machine where the log record is originally created. This is one additional reason why eG Enterprise monitors the event log records with the help of an agent.

eG Enterprise will monitor the standard windows Event Logs out-of-the-box, including the:
- Application Event Log
- Security Log
- System Event Log
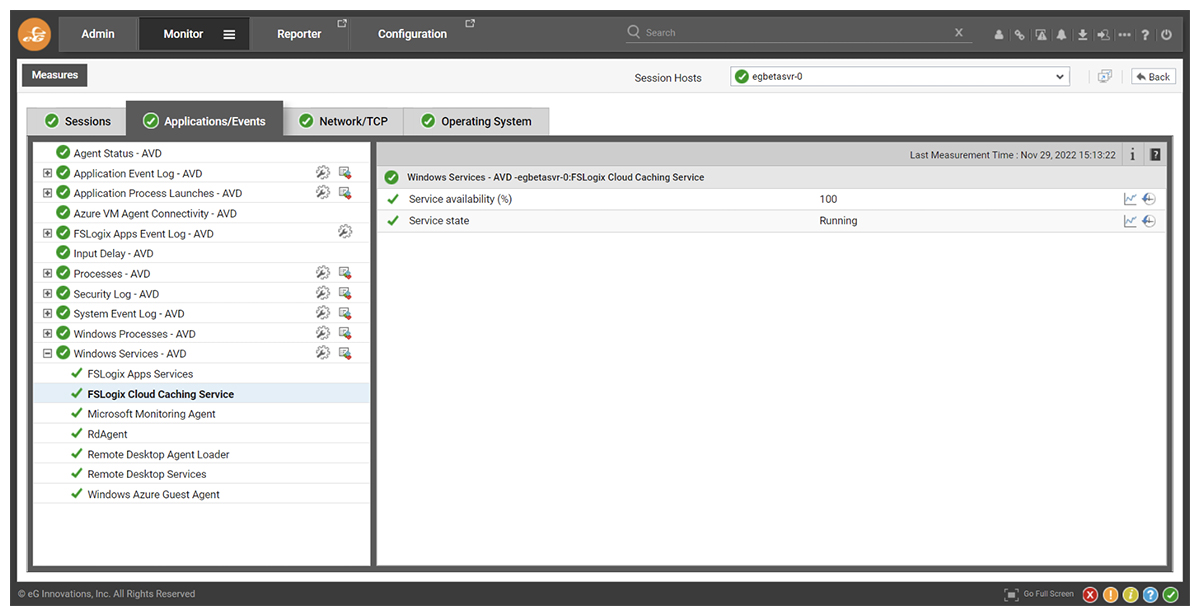
Certain key application or service logs may be included for certain technologies, for example FSLogix logs are monitored out of the box by eG Enterprise on Microsoft AVD (Azure Virtual Desktop) deployments.
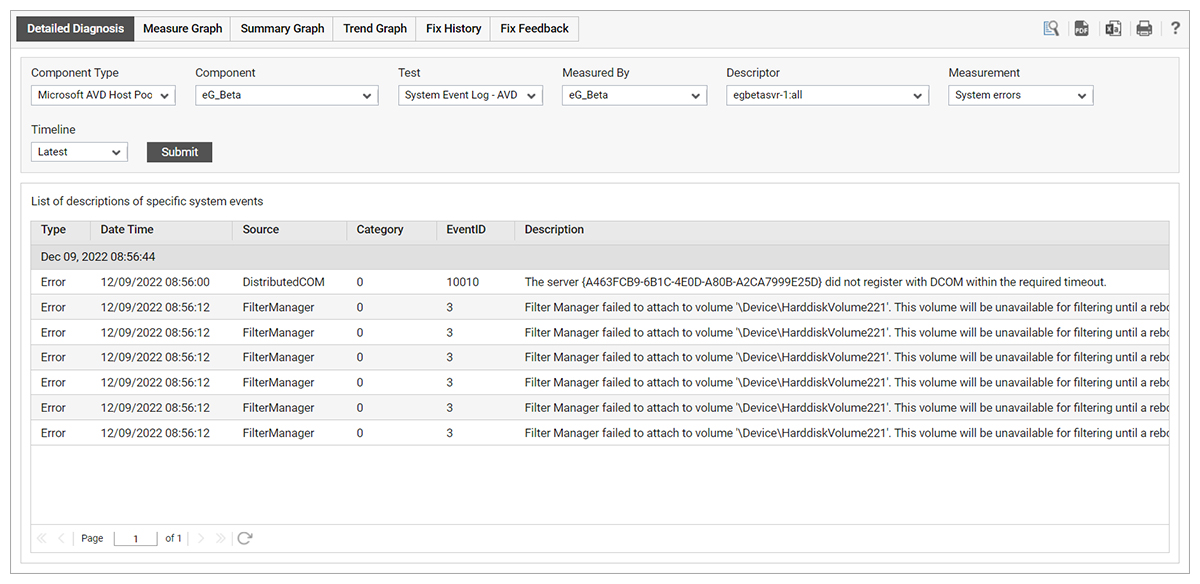
Errors within the Event Logs will automatically trigger alerts within eG Enterprise. Policies can be used to customize the alerting to filter either by inclusion or exclusion to limit the alerting to those errors and warnings of interest and to exclude any noisy logging.
What is a custom Windows Event Log?
Some administrators choose to create custom event logs, rather than writing to the default Application Event Log they may wish to filter certain events from certain events to a custom log file. This means they can control the retention and verboseness of the custom log. For a particularly problematic application an admin may choose to collect verbose application information events and retain them for a few hours in a custom log rather than fill up the main Application Event logs.
There a few guides available to help implement custom logs, such as Use PowerShell to Create and to Use a New Event Log – Scripting Blog (microsoft.com) and Creating a custom event log under Microsoft Event Viewer to log server events – JasonSamuel.com.
Custom logs follow the standard Windows Event Log format and schema and as such can be monitored within eG Enterprise.
Filter and customize Event Log tests in eG Enterprise
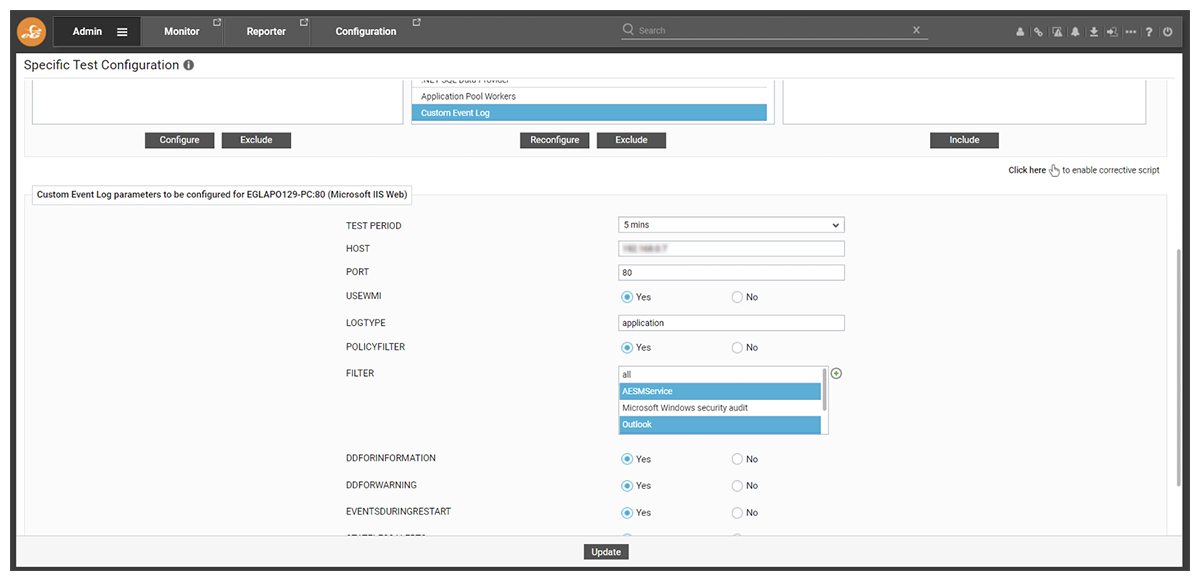
How event logs are monitored can be customized within eG Enterprise via policies. Event logs can be filtered so that events from certain sources are explicitly excluded or included, similar filtering can be performed on specific EventIDs and so on.

Select Agents-> Tests -> Specific Configuration.
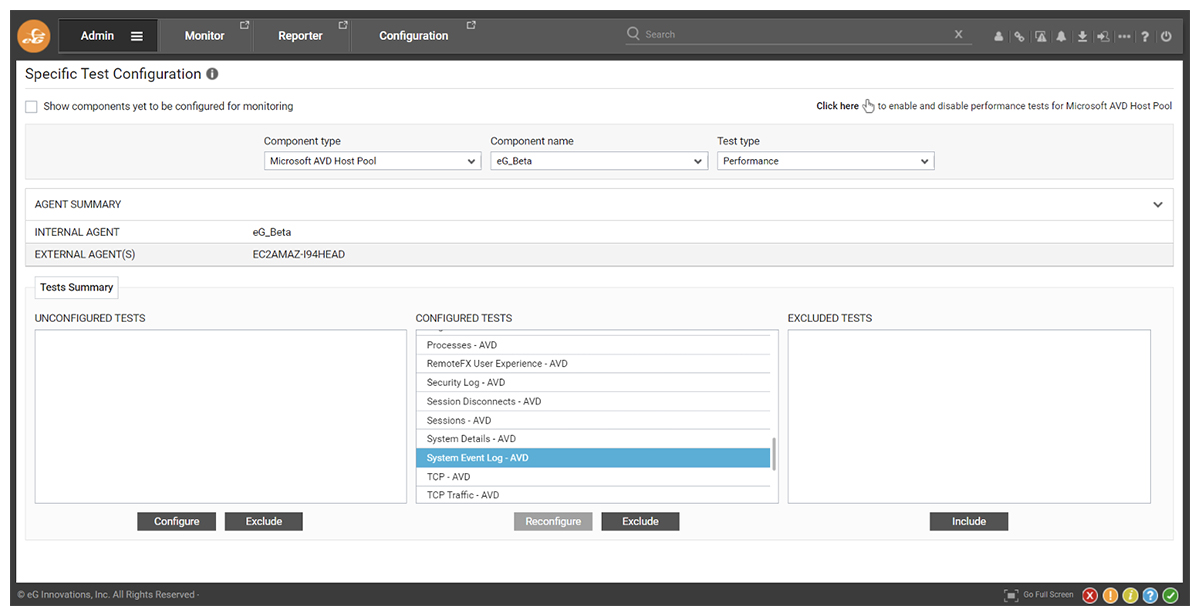
Select the appropriate Component and Event Log then press the Reconfigure button.
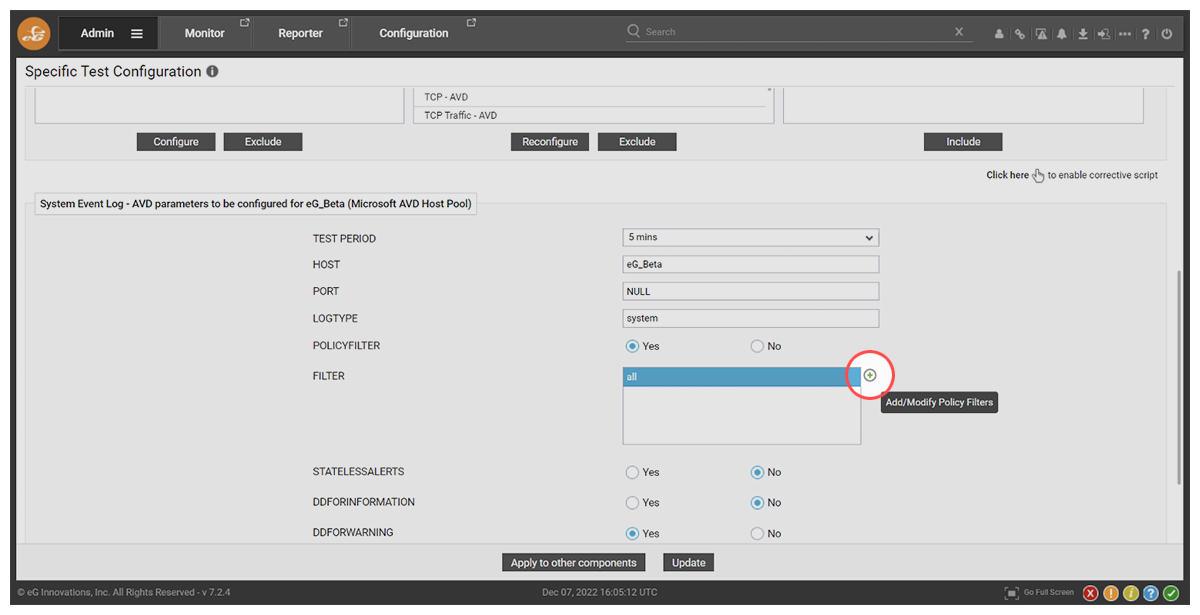
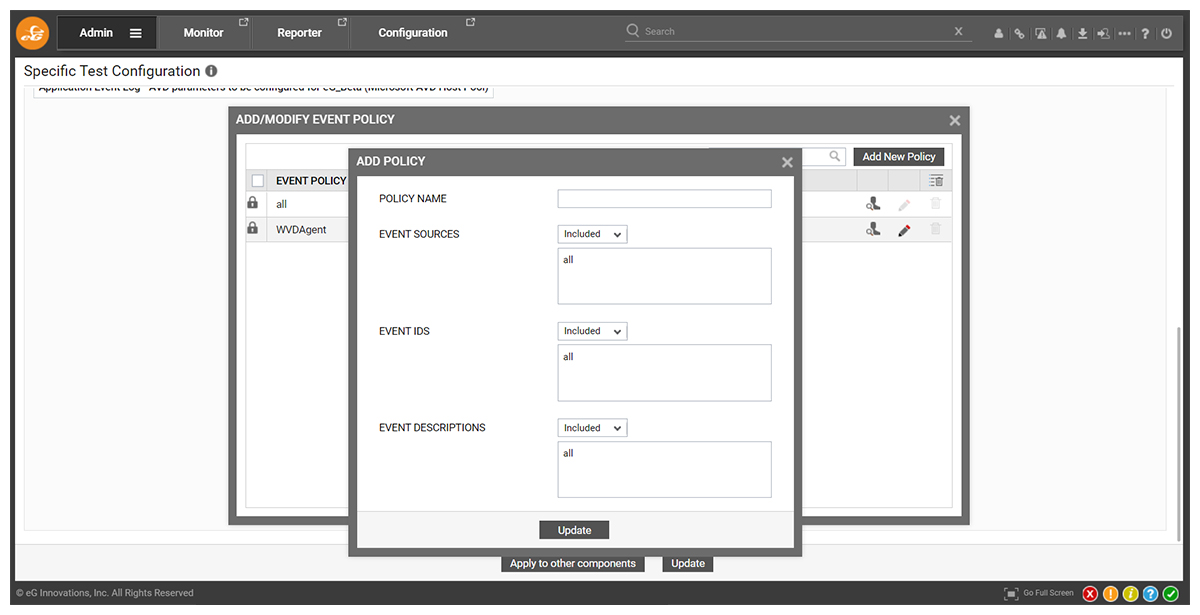
Use the + icon next to the FILTER field to Add/Modify Policy Filters
How to monitor windows custom Event Logs or add additional standard application services event logs with eG Enterprise
Example 1 – Monitor specific events or informational events – Example: Monitoring kerberos encryption via standard logs
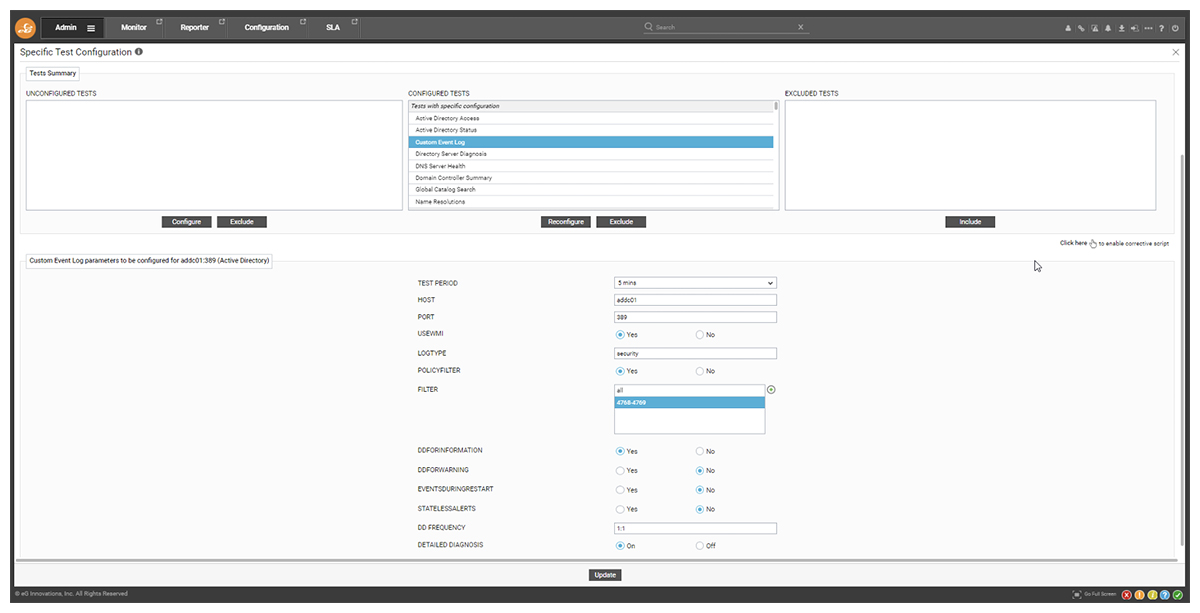
Besides monitoring and alarming on warning and error events you might want to monitor specific event IDs and/or informational events. With eG Enterprise it’s very easy to add this to a new or existing component. The easiest approach is to use the Custom Event Log test. You might need to associate this test to the component type that you are monitoring. After that, provide the log type, create a filter to include only the required event(s) and select only this filter in the test configuration. If the events include Informational events, make sure to select the according radio button. In this case the events of interest were:
- Event ID 4768 – A Kerberos authentication ticket (TGT) was requested
- Event ID 4769 – A Kerberos service ticket was requested
As the customer wished to alert on and collect detailed diagnostics from these two informational-level event IDs (4768 + 4769) from the security log. This is on Domain Controllers so they can monitor what type of Kerberos encryption is being used.

Example 2: Using custom logs to monitor Symantec endpoint protection
Custom Event Log monitoring can be configured by those with appropriate privileges via the admin tab in eG Enterprise.
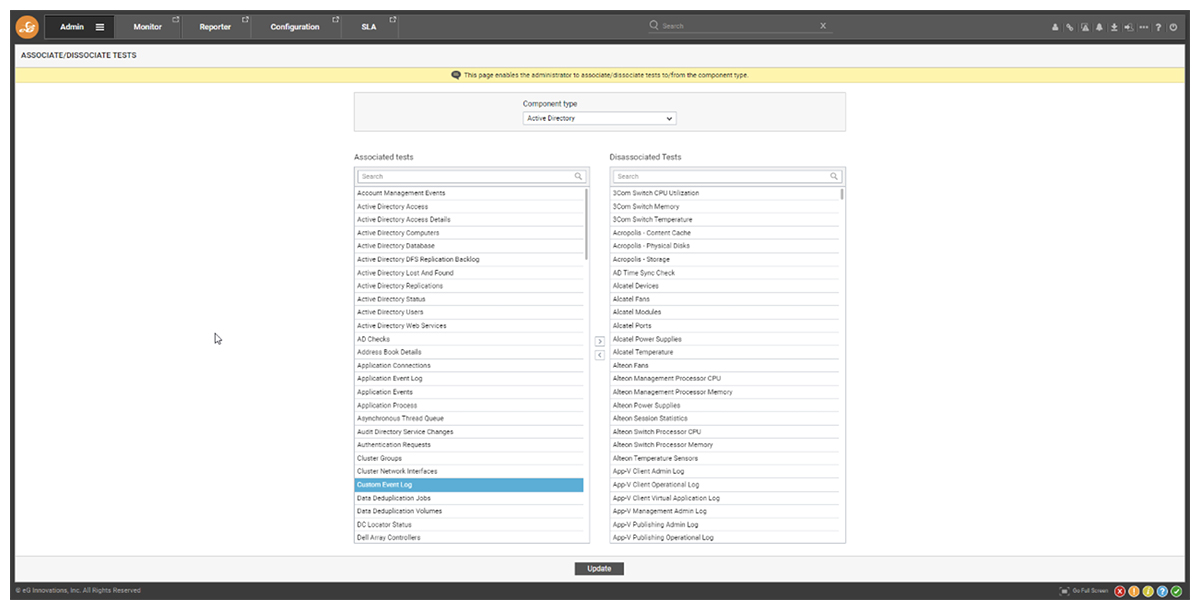
It is important to ensure that the Custom Event Log test is associated with the system and component where the event logs are generated, by default this test may not be enabled. You can do this via the Admin tab and Agents -> Tests -> Associate / Disassociate. After this you will need to Enable the test via Agents -> Tests -> Enable / Disable menu.
Once the test is enabled, eG allows us to add custom logs to configure how the monitoring will occur.
Below is the procedure for adding a custom event log monitoring with eG. As a user/admin we can find the event ID, event sources or event description from the event viewer. Once this information is captured, we can provide the details in the test description.
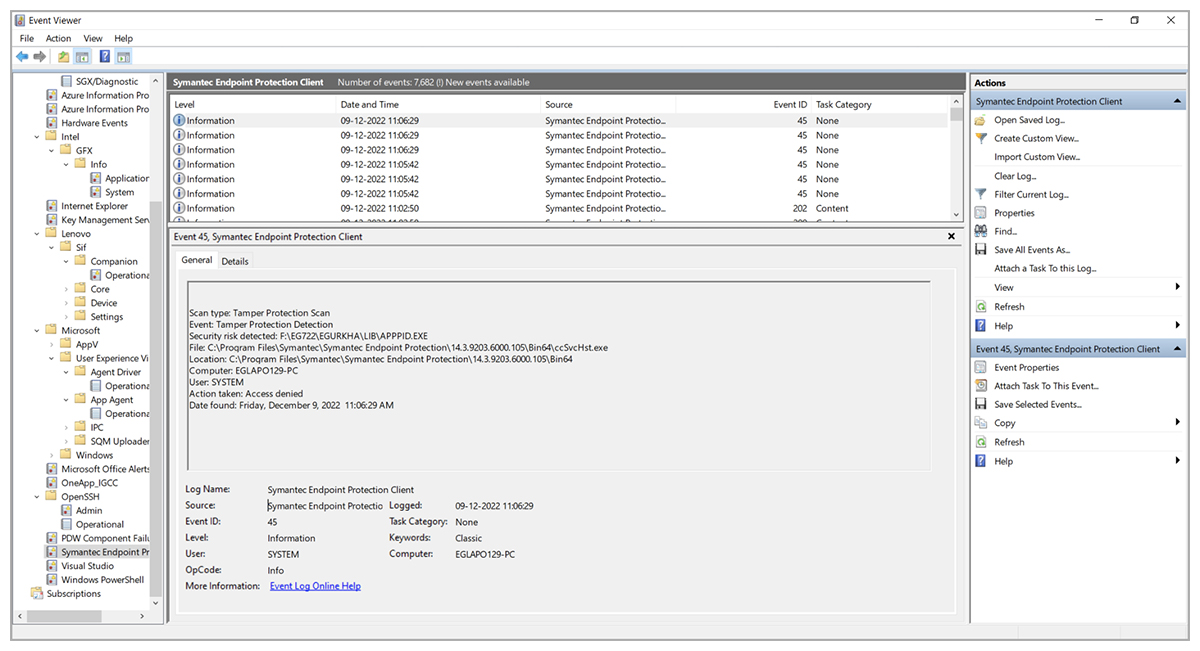
eG Enterprise allows multiple filters to trigger an alert for a custom event log. In this case, we are creating a custom event log monitoring for the Symantec Endpoint protection of a particular Windows operating system.
Once the test configuration is defined for the monitoring like above, eG will start capturing the measures. If there are any red flags observed, eG will show us an alert.
Whilst we demonstrated configuring the custom event log monitoring for one particular event only above, eG Enterprise also allows the administrator to configure the tests for multiple events with different custom event IDs, Event descriptions and so on.
Windows Event Log reporting: Consolidated Event Log reports for your organization
Beyond live monitoring and reporting, historical reporting of events is increasingly important, particularly within larger organizations. Comprehensive reporting of Windows provides useful data to quantify system performance against SLAs and KPIs and input into work and resource planning. Moreover, in larger organizations where multiple teams or individuals may have responsibilities or work to shift patterns – recurrent and intermittent issues can be tracked across shifts and teams.
Many Windows Event Log records are ephemeral and not indicative alone of a serious issue. The ability eG Enterprise gives to administrators to review those events with the context of the last day, week, month or longer provides deep insights into intermittent or recurrent issues.
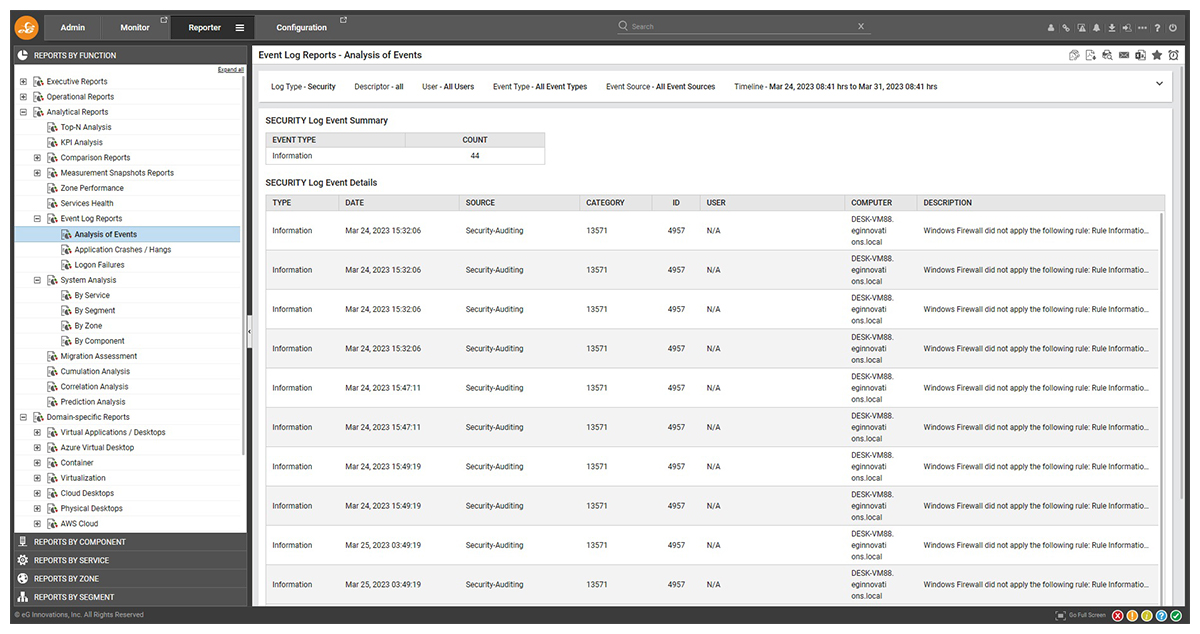
eG Enterprise provides a set of reports out-of-the-box that provide live and historical reports on Windows Event Logs. These reports can be scheduled and published as needed, or generated on-the-fly. A large number of configuration options and filters are available within the ready-to-go reports, allowing administrators to parse and view data swiftly. The results of reports can be exported to standard formats such as .csv and .pdf for further analysis or for audit purposes.
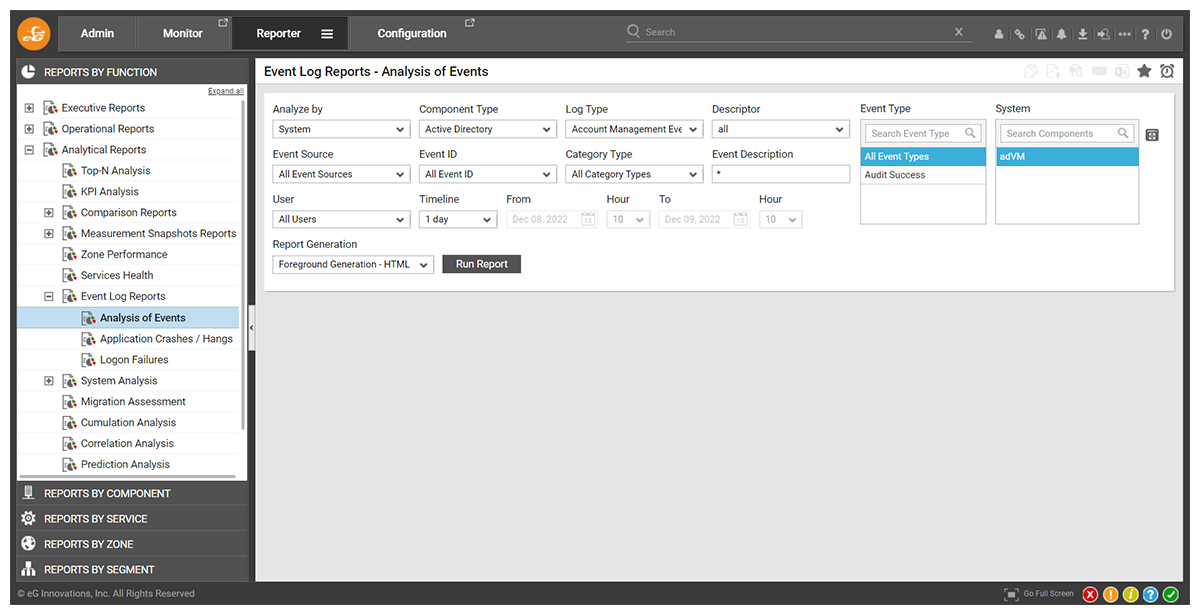
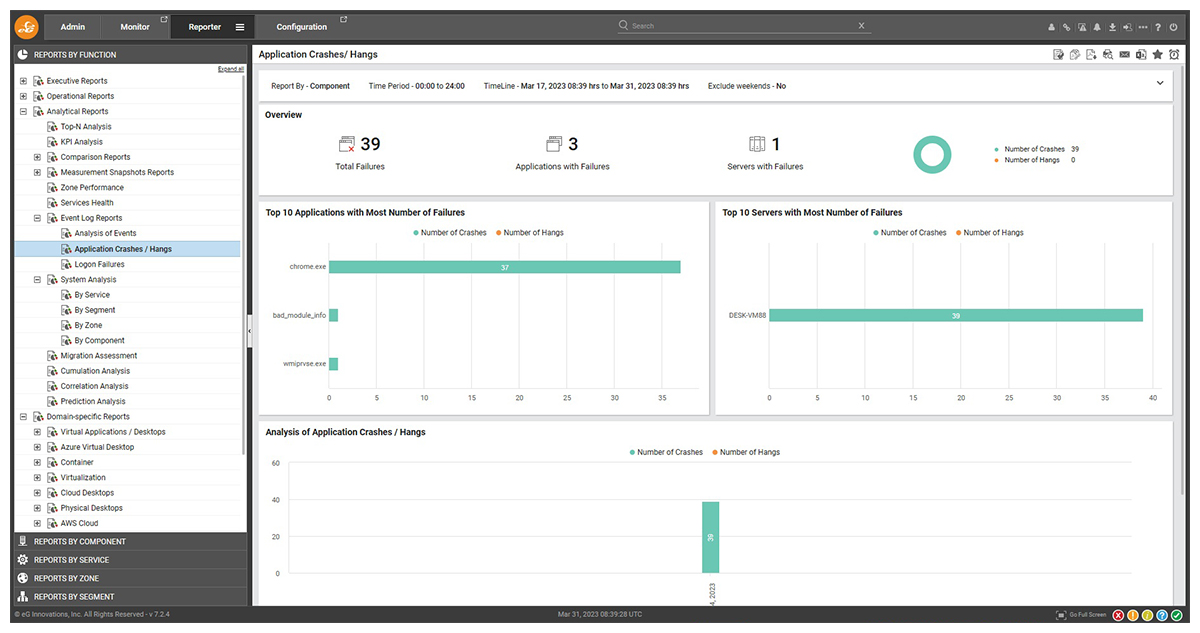
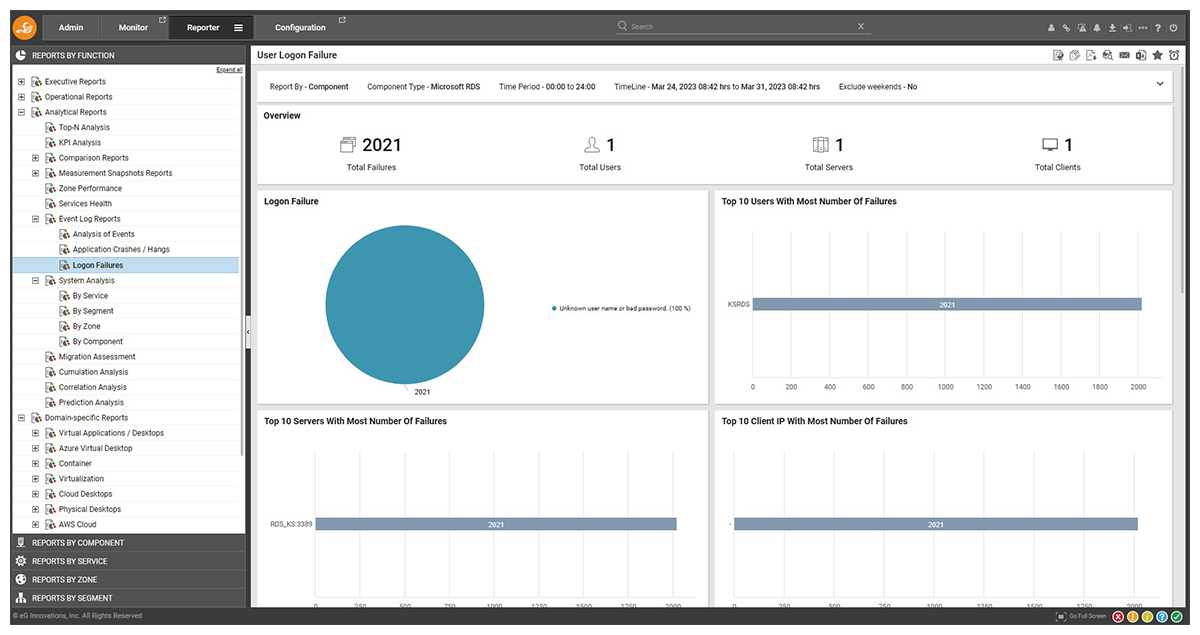
Three out-of-the-box reports are supplied within eG Enterprise to assist with troubleshooting, these can be found under the Reporter tab via Reports by FUNCTION -> Analytical Reports -> Event Log Reports:
- Analysis of Event Report: This is particularly powerful for administrators to determine patterns of events
- Application Crashes / Hangs Report: This is often very useful for determining the cause of service failures and for determining the extent of application issues across multiple machines
- Logon Failures Report
Reports can be further customized or custom reports built via the easy-to-use GUI eG Enterprise report builder editor if need.
Monitoring Windows service availability beyond Event Logs
Any Windows Services you leverage will use the event log service to record events and notifications from those services. Of course, if any of those services are unavailable and not running no information will be recorded. eG Enterprise includes “Windows Service Monitoring” to continuously monitor the availability of Windows Services alongside event log monitoring, to ensure you have full observability. If services have failed and are unavailable alerts will be raised. Failures in services can be easily correlated with any events such as warnings or errors recorded immediately prior to the failure.
Monitoring Windows Service availability alone is only sufficient to know that a service has failed or is unavailable. Event logs will often reveal the root cause of service failure. In particular, if services have crashed or failed the event log report Application Crashes/Hangs will be of particular use, and can be found under the Reporter tab via Reports by FUNCTION -> Analytical Reports -> Event Log Reports -> Application Crashes/ Hangs.
Note of thanks: Many thanks to my colleague Erik van Veenendaal who provided some of the examples and information in this article.
Monitoring Windows Event Logs – Frequently asked questions (FAQs)
There are many online directories of Windows Event IDs such as: Randy’s Windows Security Log Encyclopedia (ultimatewindowssecurity.com)./
Microsoft themselves have a list of Security Log Event IDs they recommend monitoring, see: Appendix L – Events to Monitor | Microsoft Learn.
You can collect Windows event log data sources with Log Analytics agent and access this data via Azure Monitor, see: Collect Windows event log data sources with Log Analytics agent in Azure Monitor – Azure Monitor | Microsoft Learn. You can collect events from standard logs, such as System and Application, and any custom logs created by applications you need to monitor. However, you cannot configure the collection of security events from the workspace by using the Log Analytics agent. If using native Azure functionality, you can only use Microsoft Defender for Cloud or Microsoft Sentinel to collect security events. The Azure Monitor agent can also be used to collect security events.
By default, event log data stored within Log Analytics will only be retained for 30 days. Organizations often wish to retain such data longer for retrospective analysis of incidents and auditing needs. This is where a third-party product such as eG Enterprise can help.
Microsoft provides a free tool called Event Viewer that provides a simple GUI within which users can manually navigate and examine events and the information within the underlying logs. Information from certain logs such as the Security Log is only accessible to those with appropriate Administrator level privileges. See: What Is the Windows Event Viewer, and How Can I Use It? (howtogeek.com). Given how event logs have evolved users of post-Vista versions of Windows will probably find this guide helpful, see: How to use Event Viewer on Windows 10 | Windows Central.
There are also plenty of proprietary Windows Event Log management tools available.
On a Windows OS: Press the Windows key + R on your keyboard to open the run window. In the run dialog box, type “eventvwr” and click OK. This will start the Event Viewer tool. In the Event Viewer window you will be able to expand the Windows Logs menu. Under the Windows Logs menu, you will notice the different categories of events such as: application, security, setup, system, and forwarded event.
For those looking to write and maintain their own Event Log monitoring scripts, Microsoft provides PowerShell cmdlets. In newer versions of PowerShell cmdlets such as Get-WinEvent are recommended (See: Get-WinEvent (Microsoft.PowerShell.Diagnostics) – PowerShell | Microsoft Learn) whilst for older versions the legacy cmdlets such as Get-EventLog are available (See: Get-EventLog (Microsoft.PowerShell.Management) – PowerShell | Microsoft Learn). Beyond parsing and analyzing the log files, those looking to build their own solution usually have to invest effort in scheduling their scripts to run, integrating results into some sort of alerting system, and ensuring information is preserved and available during failover.
Developers looking to implement Windows Event logging within their applications should refer to the Microsoft Developer’s Guide: Using Windows Event Log – Win32 apps | Microsoft Learn.
As defined by Gartner: “Security information and event management (SIEM) technology supports threat detection, compliance and security incident management through the collection and analysis (both near real time and historical) of security events, as well as a wide variety of other event and contextual data sources. The core capabilities are a broad scope of log event collection and management, the ability to analyze log events and other data across disparate sources, and operational capabilities (such as incident management, dashboards and reporting).”
eG Enterprise’s rich event log monitoring and visualization capabilities provide organizations with a straightforward way to adopt and implement proactive SIEM methodologies.
eG Enterprise is an Observability solution for Modern IT. Monitor digital workspaces,
web applications, SaaS services, cloud and containers from a single pane of glass.
eG Enterprise is an Observability solution for Modern IT. Monitor digital workspaces,
web applications, SaaS services, cloud and containers from a single pane of glass.
More information and reference information
- What is Windows event log? – Definition from WhatIs.com (techtarget.com)
- There are many useful community guides around event logging, including: Create a Custom Event in the Windows Event Viewer • Raymond.CC,
- Learn how OS logs can be leveraged alongside other key metrics for complete observability of server health and can be used to set KPIs for server performance and availability, see: Server Monitoring – KPIs & Metrics


