Configuring Manager Settings
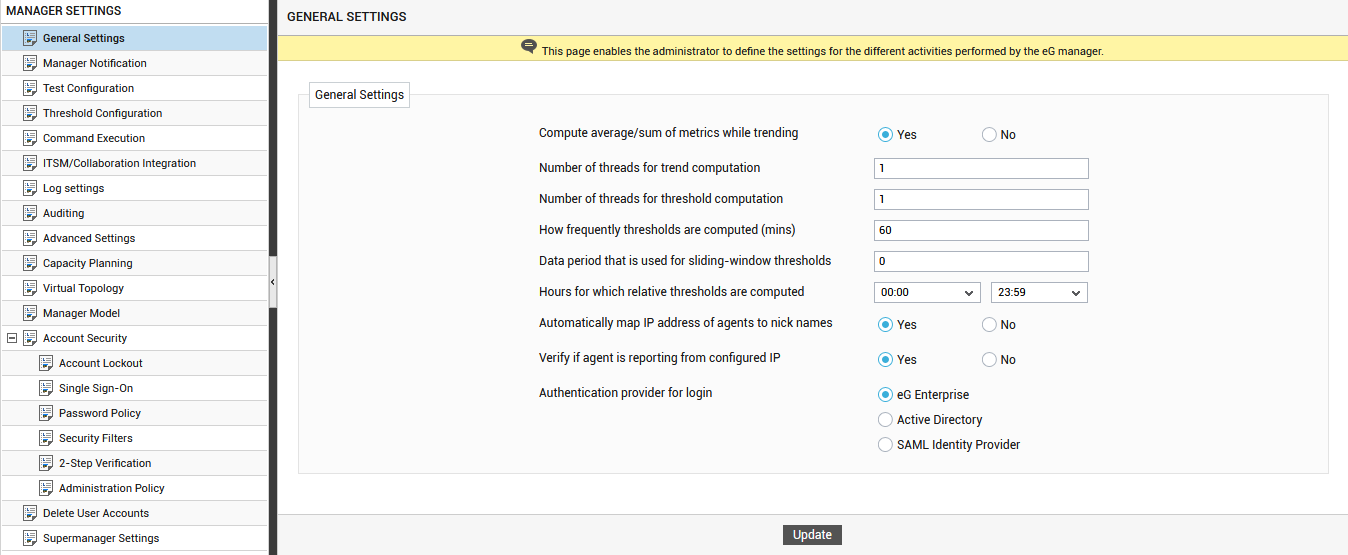
To configure manager settings, select the Manager option from the Settings tile. Figure 1 will then appear with a manager settings panel to its left. Clicking on any option in the manager settings panel will invoke a list of parameters in the right panel that you can configure.
-
Clicking on the General Settings option will open a general SETTINGS page in the right panel (see Figure 1).
-
Using the general SETTINGS page, you can configure the following settings:
- The trend graph option in the eG monitoring console allows users to view and analyze the computed trend values over time. By default, during trending, the eG manager computes the upper and lower bounds of every metric using statistical quality control techniques. In addition, the manager also computes the average and sum of every metric while trending, and stores these values too in the database. Accordingly, the Compute average/sum of metrics while trending flag is set to Yes by default. This ensures that users have the option to plot min-max, average, or sum values of a chosen metric in a trend graph, and are able to better assess and plan the current and future performance of the target components. However, if, for some reason, you do not want the eG manager to perform average and sum computations while trending, you can indicate that by setting the Compute average/sum of metrics while trending flag to No.
- The default value 1 in the Number of threads for trend computation text box indicates that by default, the eG manager uses a single thread for computing trend values. To speed up the day-end trending activity, you can configure the eG manager to spawn more threads, by increasing the Number of threads for trend computation.
- The default value 1 in the Number of threads for threshold computation text box indicates that by default, the eG manager uses a single thread for computing thresholds. To speed up the threshold computation process, you can configure the eG manager to spawn more threads, by increasing the Number of threads for threshold computation.
- Typically, the eG manager computes thresholds on an hourly basis. Accordingly, the default value in the How frequently thresholds are computed text box is 60 (minutes). However, in case of highly dynamic environments (eg., trading environments), where significant data changes occur at regular intervals, you might want to compute thresholds more frequently, say every half an hour, so as to capture the smallest of performance variations. On the contrary, in fairly static environments, where performance data is not likely to change frequently or dramatically, just a few threshold computation points would suffice - in other words, thresholds can be computed less frequently. To alter the frequency of threshold computation to suit your environment, simply modify the How frequently thresholds are computed setting.
- Since the default threshold frequency is 1 hour (i.e., 60 minutes), by default, thresholds are computed for distinct one-hour data periods - eg., between 7 and 8 PM, between 1 and 2 PM, etc. However, in some environments, data transition might not always occur at such definite time windows. For instance, dramatic data changes could occur in an environment between 6.45 and 7.45 PM, and not during the precise 7 - 8 PM slot. To address the unique thresholding needs of such environments, you can off-set the data period for threshold computation by a fixed duration (in minutes) specified in the Data period that is used for sliding-window thresholds text box. For example, to ensure that the data collected during 6.45 PM and 7.45 PM is considered for threshold computation, specify 15 (minutes) in the Data period that is used for sliding-window thresholds text box.
- By default, relative thresholds are computed for the whole day. This is why the From and To specifications in the Hours for which relative thresholds are computed configuration indicate 24 hours by default. Sometimes, administrators might decide to compute thresholds for the working hours only - say between 9 AM and 6 PM - so as to avoid computing thresholds for periods of inactivity in the environment, and thus reducing the unnecessary stress on the eG backend. In such a case, you can modify the From time and the To time accordingly.
- When an agent attempts to download from the manager the details of managed components and tests to be executed, by default, the manager first determines the IP of the agent that is requesting for the information. Then, the manager verifies the IP to nickname mapping, identifies all the nick names that map to that IP address, and allows the agent to download those sections of the eg_agents.ini file that have either the agent's IP address or the nicknames that correspond to it. Accordingly, the Automatically map IP address of agents to nick names flag is set to Yes by default. In a managed service provider environment however, the same IP address could exist in two different customer networks. Similarly, if you have DHCP enabled environments, the IP address could change frequently. In such cases therefore, you can set this flag to No.
- By default, the manager checks the nickname to IP mapping of every agent that talks to it. Accordingly, the Verify if agent is reporting from configured IP parameter is set to Yes by default. However, in case of DHCP enabled environments, where the IP constantly changes, this has to be set to No, as the agent will otherwise fail.
-
Next, indicate how user logins to the eG management console are to be authenticated. By default, the login credentials of each eG Enterprise user are stored in the eG database. Every time a user attempts to login to the eG management console, their credentials are validated by the eG database. This is why, eG Enterprise is set as the default Authentication provider for login. You can override this default setting by choosing one of the other options, which are as follows:
- Active Directory: Select this option if eG Enterprise integrates with Active Directory to authenticate domain user logins to the eG management console. If this option is chosen, then the passwords of domain users will not be stored or maintained by the eG database. Instead, the Active Directory server will be the single point of control and management of the passwords. Every time a domain user/group attempts to login to the eG management console, the eG manager connects to the Active Directory server to authenticate the login.
- SAML Identity Provider: Select this option if you want eG Enterprise to support Single Sign-On (SSO) via SAML. SAML is an open standard that allows identity providers (IdP) to pass authorization credentials to service providers (SP). If this option is chosen, then eG Enterprise will serve as a service provider (SP) that integrates with an Identity Provider (IP) such as OneLogin, Okta, ADFS etc., to grant authorization to any user who attempts to login to the eG management console. For more details on how to enable SSO for eG Enterprise via SAML, refer to SAML Enablement for Single Sign-On.
- Finally, click the Update button.
-
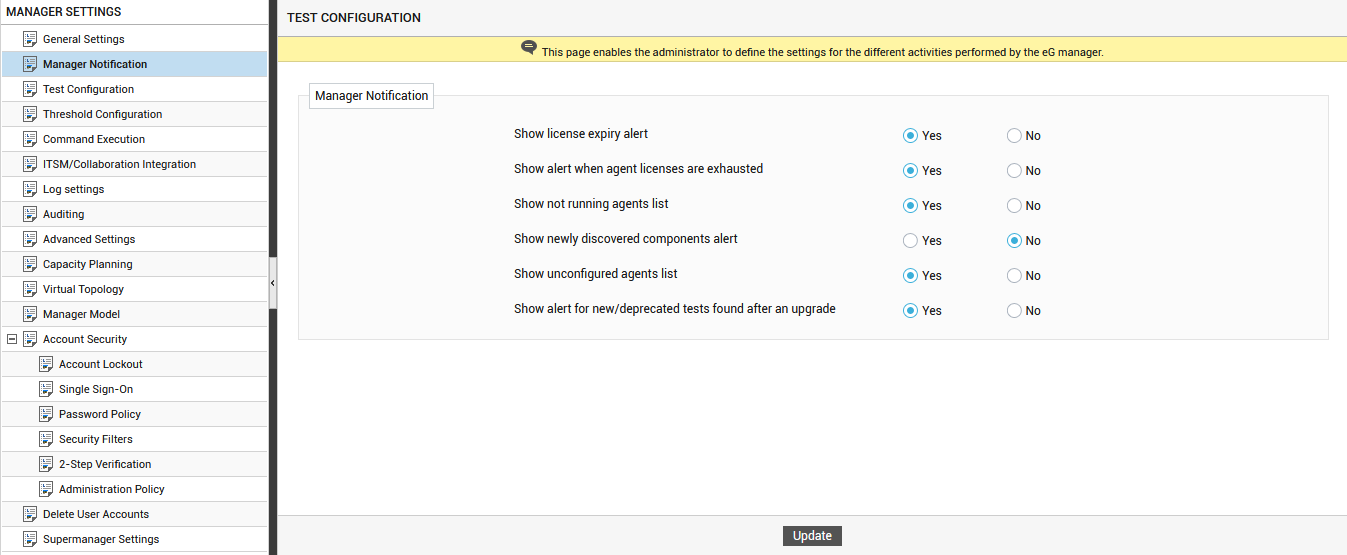
Clicking on the Manager Notification option in the manager settings panel will invoke a manager notification page (see Figure 2) in the right panel.
-
Using the Manager Notification page, you can configure the type of alerts you want displayed in the manager notification window that pops out as soon as you login to the eG administrative interface or when you click the Manager Notification icon (
 ) in the Admin tool bar available at the right, top corner of the Admin interface.
 - If you want the manager notification window to alert you to the impending expiry of the eG license, then set the Show license expiry alert flag to Yes. If this is done, then, starting from 7 days before the license expiry, the manager notification window will display a license expiry alert every day.
- If you want the manager notification window to alert you once your eG installation runs out of agent licenses, then set the Show alert when agent licenses are exhausted flag to Yes.
- To ensure that the manager notification window alerts you to agents that are not running, set the Show not running agents list flag to Yes. Note that if this flag is turned on, you will also be alerted by email to agents that are not running.
- Whenever the eG manager discovers/re-discovers new components/devices, you can optionally configure the manager to display the list of the recently discovered components/devices in manager notification window. To enable this capability, set the Show newly discovered components alert flag to Yes.
- Many times you may install an eG agent on a host, but may not use that agent to monitor any component/device in your environment. To make sure that the manager notification window informs you about the existence of such ‘unused’ agents, set the Show unconfigured agents list flag to Yes. Once this is done, then, the manager notification window will display the count of the unconfigured (i.e., unused) agents. Clicking on the count will lead you to a page that lists the agents that are yet to be used for monitoring.
- Upgrading eG Enterprise to a new version may often result in the addition of new monitoring capabilities - eg., addition of new tests, measures etc. - and/or the deprecation of a few old ones - eg., removal of old tests. To ensure that eG Enterprise users receive a heads-up on these additions/removals as soon as they login to an upgraded eG manager, you can have an alert to this effect displayed in the manager notification window. To enable this alert, set the Show alert for new/deprecated tests found after an upgrade flag to Yes.
- Finally, click the Update button.
-
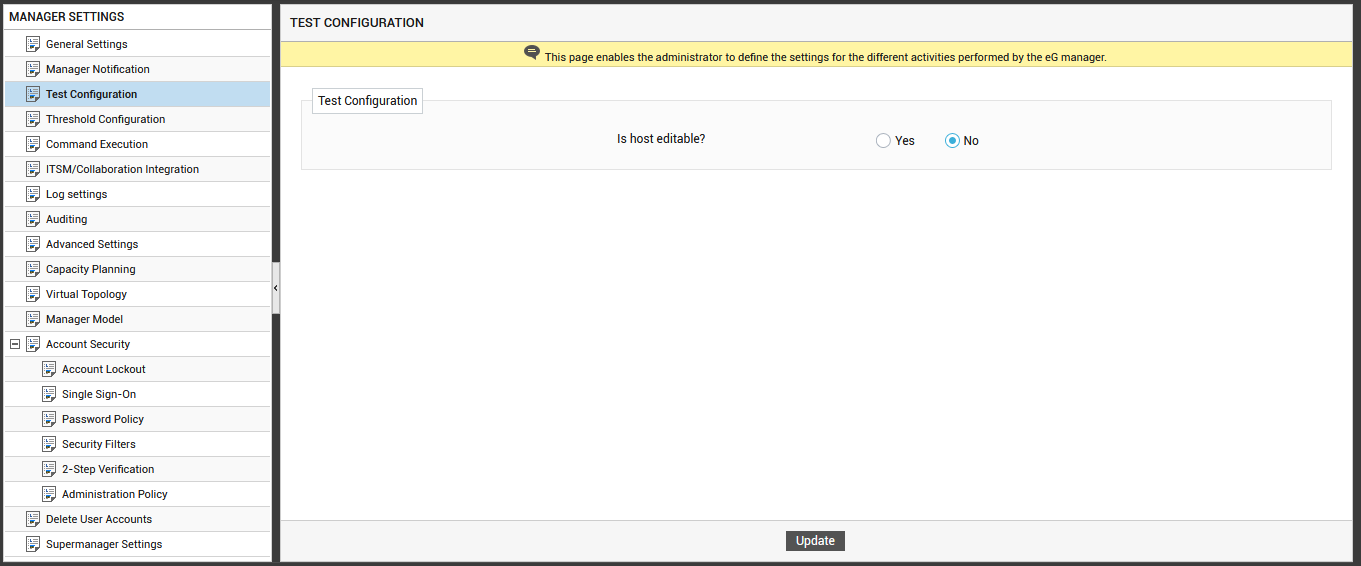
If you click on the Test Configuration option in the manager settings panel, a test configuration page will appear in the right panel (see Figure 3).
-
Using the test configuration page, you can define the following:
- By default, the host parameter of a test cannot be modified during test configuration. Accordingly, the Is host editable? flag is set to No by default. If you want to change the value of the host parameter at the time of test configuration, then set this flag to Yes.
-
Finally, click the Update button.
Note:
If the Is host editable? flag is set to Yes, then the host parameter for all tests – both internal and external – will become editable. However, this capability, when enabled, is most useful when configuring external tests, as it allows administrators the flexibility to run the test on a remote host and collect metrics.
-
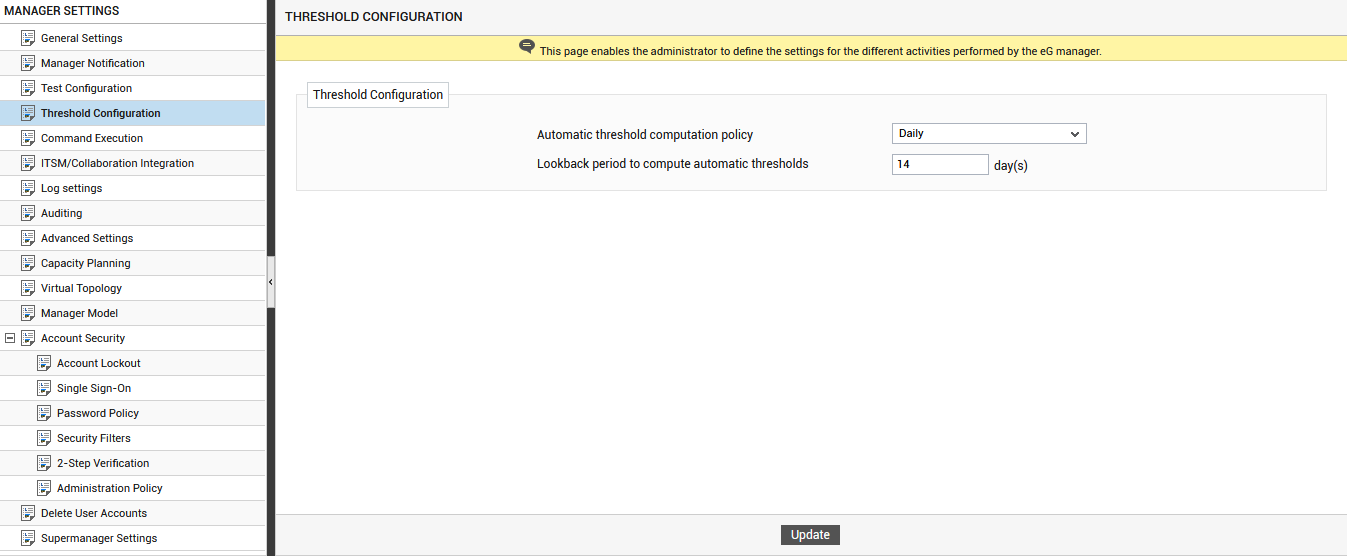
Clicking on the Threshold Configuration option in Figure 3 will invoke a threshold configuration page in the right panel (see Figure 4).
-
eG Enterprise is capable of automatically computing the thresholds of performance using historical data. This auto-thresholding capability eliminates the need for determining the norms of performance manually in dynamic environments where measure values vary with time. eG Enterprise uses tried and tested statistical quality control techniques to analyze past values of the metrics, and automatically sets the upper and lower bounds for each of the metrics based on this analysis. With the help of the threshold configuration page, you can configure the 'past values' to be considered for automatic threshold computations.
-
By default, to perform the threshold computation, the values reported by a measure during each day of the last 14 days is used. This is why, the Automatic threshold computation policy is set to Daily, and the Lookback period to compute automatic thresholds is set to 14, by default. According to these default settings, the threshold for a measure for 8 AM to 9 AM on August 18, will be automatically computed using the actual values reported by that measure during 8 AM to 9 AM on each of the 14 days prior to August 18.
In some environments, mandatory operations - for example, data backup operations or virus scanning operations - may occur on one/more servers once a week. This in turn may increase the activity levels on those servers during that time window. In some other environments, such routine operations may be scheduled to take place at a specific time every month. If threshold computations in such environments are based on Daily data collections, then the resulting thresholds may not reflect the weekly/monthly deviations in usage, thus causing false alerts. In such a case, you can set the Automatic threshold computation policy to Weekly or Monthly (as the case may be), and specify the number of past weeks/months to be considered for computing thresholds in the Lookback period to compute automatic thresholds. For instance, say that the Automatic threshold computation policy is set to Weekly and the Lookback period is configured as 2. In such a case, to compute thresholds for 8 AM to 9 AM on August 18, the actual measure values reported on the same day and time in the last 2 weeks will be considered - this will be 8 AM - 9 AM on August 11 and 8 AM - 9 AM on August 4. Similarly, assume that the computation policy is set to Monthly and the Lookback period is set to 2. In such a case, to compute thresholds for 8 AM to 9 AM on August 18, the actual measure values reported on the same date and time but in the last 2 months will be considered - this will be 8 AM - 9 AM on July 18 and 8 AM - 9 AM on June 18.
Note:
If the Monthly computation policy is chosen and the date for which thresholds are to be computed is not available in the previous month - say, thresholds are to be computed for July 31, but the previous month of June has only 30 days - then, the data collected during the last day of the previous month will be used for threshold computation. In the case of our example therefore, the data collected on June 30 will be used.
- Finally, click the Update button.
-
-
Click on the Command Execution option in the manager settings panel to view the command execution section in the right panel (see Figure 5).
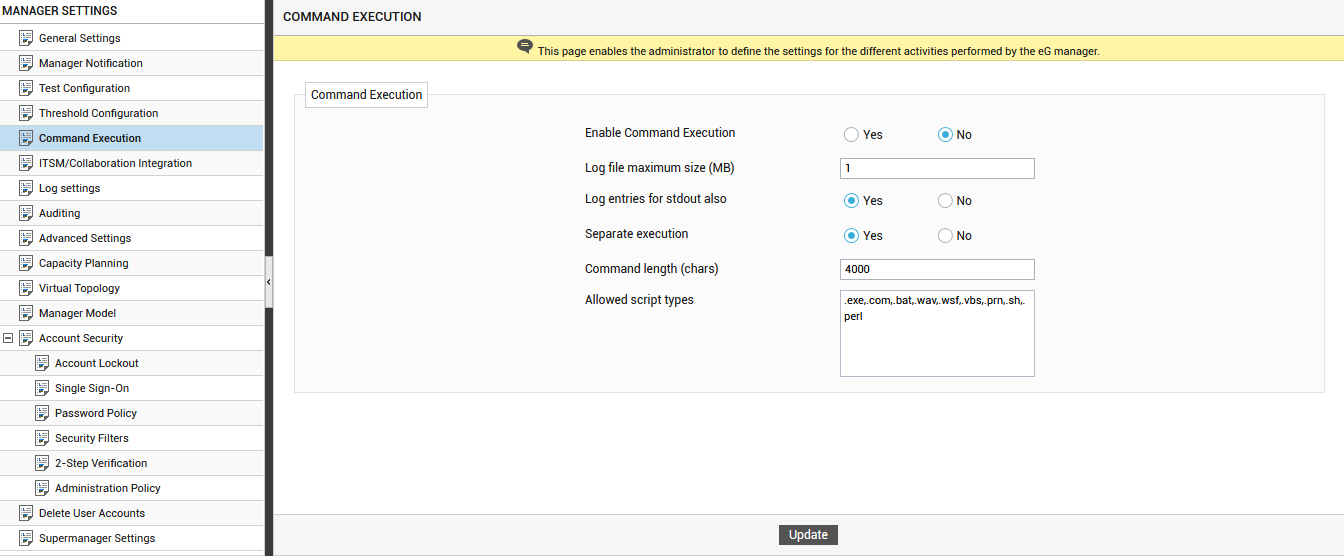
Figure 5 : Configuring command execution on alert generation
-
Like email IDs / mobile numbers, you can associate one/more custom scripts with users to the eG Enterprise system. Whenever alarms are raised/modified/closed for a specific user, the associated custom script will automatically execute, so that the details of the alarms are routed to third-party customer relationship management systems or TT systems, and trouble tickets automatically created (or closed, as the case may be) for the corresponding user. The custom scripts thus provide a mechanism by means of which eG alerts are integrated into CRM/TT systems. These custom scripts can be configured in addition to or instead of email / SMS alerts. The eG manager will invoke this custom script with a fixed set of parameters, namely - ComponentType, ComponentName, LayerName, Desc, StartTime, Priority
Note:
This capability is also supported in a redundant eG manager configuration. In case of the redundant manager configuration, if the primary manager is up and running, it will perform script execution. If the primary manager is down for any reason, the secondary manager will perform script execution.
-
Using the command execution page, you can configure the details of these scripts as follows:
- First, to enable the command execution capability, set the Enable Command Execution flag to Yes. By default, this is set to No.
- To track the status of the script execution and to troubleshoot issues with the same, use the mailexec.log file that is automatically created in the <eg_install_dir>\manager\logs directory when the custom scripts execute. You can specify the maximum size up to which this log file can grow, in the Log file maximum size text box. When the file reaches the specified size limit, the details originally logged in the mailexec.log file will be moved to another log file named mailexec.log.1, and the newer information will be logged in the mailexec.log file instead. This log rotation mechanism helps ensure that the log file does not grow beyond control. The default maximum size is 1 MB.
- You can even indicate the type of information you want logged in the mailexec.log file. By default, the log files capture both the errors and the standard output of the specified Command; accordingly, the Log entries for stdout also flag is set to Yes by default. If you want to capture only the errors, set the Log entries for stdout also flag to No.
-
To execute the script for every alert that is generated, set the Separate execution flag to Yes. This means that when the script executes, the details of only a single alert will be included in the script output. Given below is an extract from the mailexec.log file, when the Separate execution flag is set to Yes.
31/08/2011 11:06:51 USER admin COMMAND echo PARAMS -ComponentType "Host system" -ComponentName "esx150" -LayerName "Operating System" -Desc "-|Processors - Esx|Usage|Physical CPU usage of ESX server's processor is high|Processor 3|192.168.8.67" -StartTime "Aug 31, 2011 11:05:18" -Priority "Critical"
31/08/2011 11:06:51 INFO -ComponentType "Host system" -ComponentName "esx150" -LayerName "Operating System" -Desc "-|Processors - Esx|Usage|Physical CPU usage of ESX server's processor is high|Processor 3|192.168.8.67" -StartTime "Aug 31, 2011 11:05:18" -Priority "Critical"As you can see, for a single alert, two lines have been logged in the mailexec.log file.
The first line is the script invocation. It displays the user who will be receiving the alarm intimation, the syntax of the command that is being executed by the script, and the params - i.e., the input parameters/arguments - that the command takes while executing. In the sample provided, echo is the command executed by the script. Therefore, the params tag in our extract is followed by the input parameters required by the echo command. As you can see, every parameter of the echo command consists of two components: the parameter name and its value at runtime. While the param name begins with a - (hyphen), its runtime value is enclosed within "double quotes". Take for instance the parameter, -ComponentType "Host system". Here, -ComponentType is the parameter, and the "Host system" is its value.
The second line logs the output of the command - in the case of our example, this will be the output of the echo command. The command output typically begins with the tag info, and will be followed by the details of the alert being sent. Like its input, the output of the echo command too is a combination of the parameter name and its value at runtime. While the parameter name indicates what type of information is being sent, the actual information itself is contained within "double quotes" and forms the parameter value. The parameters included in the output of the echo command have been discussed in the table below:
Parameter Description ComponentType
The problem component type
ComponentName
The name of the problem component
LayerName
The name of the problem layer
Desc
A brief description of the problem; typically, for the echo command, a problem description includes the following:
- the site affected; if the alarm does not pertain to any site, only a '-' will appear in the output, as is the case in our sample output;
- the problem test - this is Processors - Esx in our example;
- the problem measure - this is Usage in our example;
- the alarm description - in the case of our sample, this is: Physical CPU usage of ESX server's processor is high;
- the problem descriptor (if any); in the case of our example, this is Processor 3. For non-descriptor-based tests, a '-' will appear here.
- the measurement host - this is 192.168.8.67 in the case of our example
- the last measurement value - this is not available in the case of our sample. This value will appear in the description only if the Show last measure value in alerts flag in the MAIL ALERT PREFERENCES page (Alerts -> Mail Settings -> Alerts) is set to Yes.
StartTime
The problem date/time
Priority
The problem severity
If the Separate execution flag is set to No on the other hand, the script will be executed only once for all alerts raised simultaneously. Given below is an extract from the mailexec.log file, when the Separate execution flag is set to No.
30/08/2011 12:13:27 USER admin COMMAND echo PARAMS -ComponentType "Microsoft SQL" -ComponentName "sql100:1433" -LayerName "MS SQL Service" -Desc "-|MsSqlNet|Availability|SQL Server unavailable|master|192.168.8.77" -StartTime "Aug 30, 2011 12:10:26" -Priority "Critical" # -ComponentType "Windows" -ComponentName "win77" -LayerName "Windows Service" -Desc "-|WindowsServices|Availability|Service not up|eGAgentMon|win77" -StartTime "Aug 30, 2011 12:10:41" -Priority "Critical" # -ComponentType "Host system" -ComponentName "esx150" -LayerName "Operating System" -Desc "-|Processors - Esx|Usage|Physical CPU usage of ESX server's processor is high|Processor 3|192.168.8.67" -StartTime "Aug 30, 2011 12:11:18" -Priority "Critical" # -ComponentType "Host system" -ComponentName "vdi136" -LayerName "Network" -Desc "-|Network - Esx|Availability|Network interface of the ESX server is down|vmnic1|192.168.8.67" -StartTime "Aug 30, 2011 12:11:23" -Priority "Critical"
30/08/2011 12:13:27 INFO -ComponentType "Microsoft SQL" -ComponentName "sql100:1433" -LayerName "MS SQL Service" -Desc "-|MsSqlNet|Availability|SQL Server unavailable|master|192.168.8.77" -StartTime "Aug 30, 2011 12:10:26" -Priority "Critical" # -ComponentType "Windows" -ComponentName "win77" -LayerName "Windows Service" -Desc "-|WindowsServices|Availability|Service not up|eGAgentMon|win77" -StartTime "Aug 30, 2011 12:10:41" -Priority "Critical" # -ComponentType "Host system" -ComponentName "esx150" -LayerName "Operating System" -Desc "-|Processors - Esx|Usage|Physical CPU usage of ESX server's processor is high|Processor 3|192.168.8.67" -StartTime "Aug 30, 2011 12:11:18" -Priority "Critical" # -ComponentType "Host system" -ComponentName "vdi136" -LayerName "Network" -Desc "-|Network - Esx|Availability|Network interface of the ESX server is down|vmnic1|192.168.8.67" -StartTime "Aug 30, 2011 12:11:23" -Priority "Critical"In this case again, only two lines will be logged in the mailexec.log. The first line will display the user name, command syntax, and the command params (with their corresponding values). Since multiple alerts will be clubbed in the command output, the first line will include the params for all alerts. '#' (hash) will be used to separate the parameter-value pairs of one alert from the other.
The second line, which begins with the tag info, will display the combined output of all email alerts generated simultaneously - each alert in the output will also be separated by the hash (#) symbol.
Note:
The Separate execution flag setting will take effect only if a user is configured to receive New alarm intimations alone - i.e., if the Type of notification is set to New for a user in the add user page. For users who are configured to receive the Complete List of alarms, details of multiple alarms will always be clubbed in a single script execution, regardless of this flag setting.
- Specify the maximum permissible length of the command in the Command length text box. The command line here includes the command syntax, its input arguments (if any), and the value of each argument. By default, the command line can have a maximum of 4000 characters. You can alter this default setting by specifying a length of your choice in the Command length text box. If the Separate execution flag is set to Yes, then, if the Command length is violated, the command will be truncated at the end of the parameter value that is closest to the configured Command length. If the Separate execution flag is set to No, then, upon a Command length violation, the command will be truncated at the end of the complete alert specification that is closest to the configured length.
-
Next, indicate the type of scripts that eG Enterprise should execute by running the configured command. The default list includes .exe, .com. .bat, .wav, .wsf, .vbs, .prn, .sh, and .perl. You can override the default list by appending new script types to it or removing existing ones. For instance, if you want eG Enterprise to support powershell scripts as well, then your specification should be:
.exe,.com.,.bat,.wav,.wsf,.vbs,.prn,.sh,.perl,.ps1
- Finally, click the Update button.
-
eG Enterprise is capable of integrating with trouble ticketing systems such as Autotask, ServiceNow, etc.. Vide this integration, eG alerts will be automatically routed to the third-party TT system, resulting in the automatic creation, modification, or closure of trouble tickets. Likewise, eG Enterprise can also readily integrate with chat/collaboration systems such as HipChat, Slack etc. This results in eG alerts being automatically circulated to all users connected to a configured chat room/channel. For instance, if help desk personnel are part of a single chat room on HipChat, you can have eG Enterprise integrate with that chat room. This way, help desk personnel are instantly notified of problem conditions, and can effectively work together for a speedy resolution.
To enable TT integration, click on the TT Integration Settings node in the MANAGER SETTINGS tree. This will show the Enable event-based TT Integration flag in the right-panel (see Figure 6). By default, this flag is set to No. You can set this flag to Yes to enable integration of third-party trouble ticketing systems with the eG manager. Once enabled, the alerts generated in the eG manager will be automatically forwarded to the trouble ticketing systems based on predefined configurations.
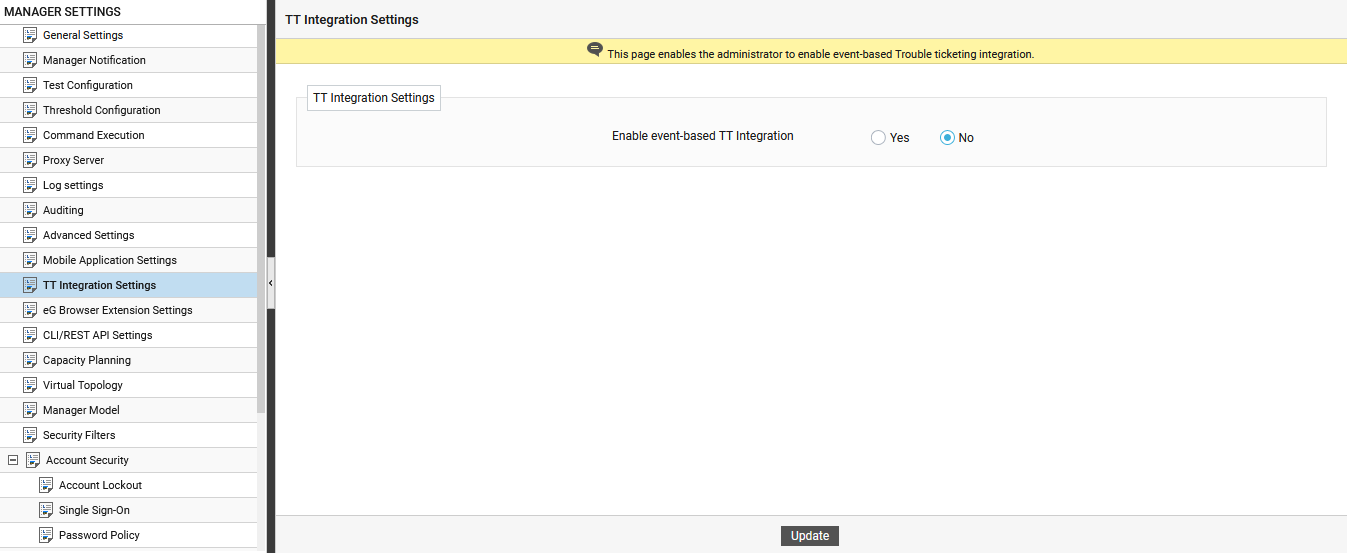
Figure 6 : Enabling TT Integrstion Settings flag
Note:
This node will appear only if the Trouble Ticket Integration capability is enabled by the eG license.
-
In environments where the eG manager is installed on a box without internet privilege, eG Enterprise offers the ability to allow the eG manager to access the internet (for populating Google Maps, discovering components hosted on Cloud etc.) via a proxy server. To do so, you can click the Proxy Server node in the tree structure of the left panel (see Figure 7)

Figure 7 : Configuring Proxy Server Details
In Figure 7, set the Do you want your eG Manager to communicate via a proxy server? flag to Yes. By default, this is set to No.
If the Yes option is chosen as shown in Figure 7, you need to provide the following details of the proxy server that the eG manager should use for communication.
-
Proxy Server IP/Hostname: Mention the IP address/hostname of the proxy server used by the eG manager for communication.
-
Proxy Server Port: Specify the port number at which the proxy server listens.
-
Does the proxy server require authentication?: Indicate whether/not the proxy server requires authentication. Select the No option if authentication is not required, and Yes if it is.
-
Username, Password, and Confirm Password: If the proxy server requires authentication, then provide the credentials of a valid proxy server user against the Username and Password text boxes. Confirm the password by retyping it in the Confirm Password text box.
-
Finally, click the Submit button to confirm the proxy server specification.
-
-
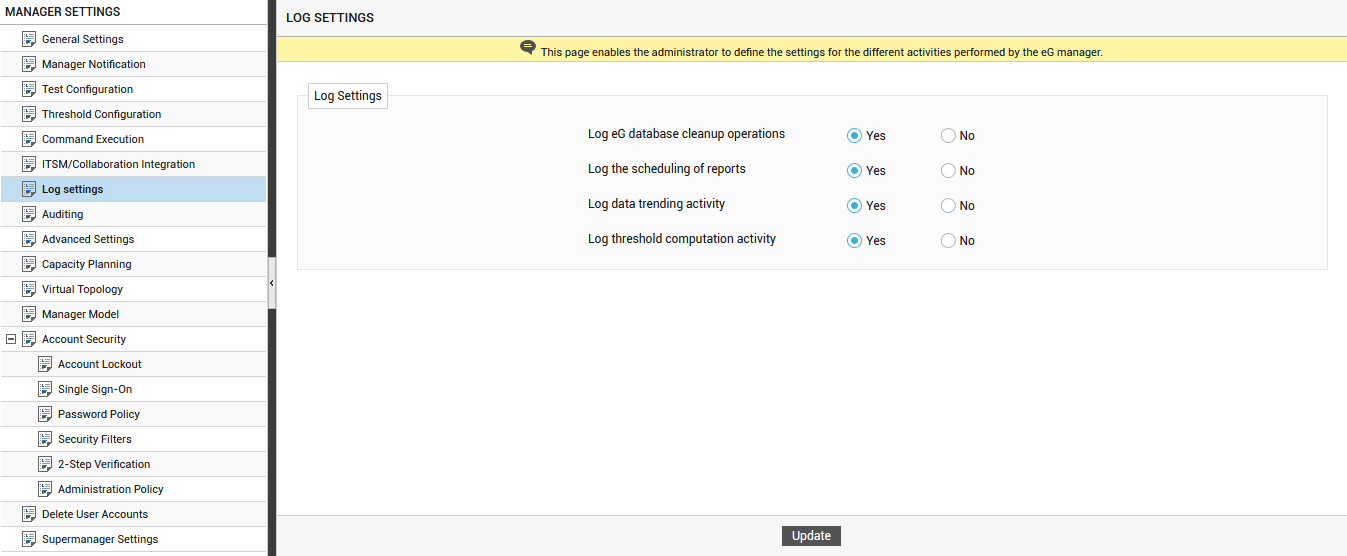
Clicking on the Log Settings option in the left panel will open the log settings page in the right panel (see Figure 8).
-
In the LOG SETTINGS section of this page, the following settings can be defined:
- The eG manager runs database cleanup operations at pre-configured frequencies. By default, the eG manager logs the details of a cleanup in the cleanup_log file in the <EG_INSTALL_DIR>\manager\logs directory. The details such as when the cleanup started, when it ended, the duration of the cleanup, what was cleaned up, errors during cleanup, etc., are logged, so that administrators are enabled to efficiently troubleshoot issues (if any) during cleanup. If, for some reason, you want to disable this logging activity, set the Log eG database cleanup operations to No.
- Once key reports are scheduled to be emailed to specific recipients, the eG manager, by default, creates a schedule_log file in the <EG_INSTALL_DIR>\manager\logs directory, to which the success/failure of the report scheduling activity is logged. If you do not want to maintain this log file, then you can disable logging of report scheduling activities, by setting the Log the scheduling of reports flag to No.
- The eG manager, by default, logs the details of the day-end trend activity, so that administrators know when, how, and for how long trending occurred; this information enables administrators to troubleshoot issues with trending. A trend_log file is created in the <EG_INSTALL_DIR>\manager\logs directory for this purpose. However, if need be, trend logging can be disabled, by setting the Log data trending activity flag to No.
- By default, the eG Enterprise system performs threshold logging - i.e., the ability to record threshold activities in a log file. A thresh_log file is created in the <EG_INSTALL_DIR>\manager\logs directory, to which all threshold-related processes are logged. However, if need be, threshold logging can be disabled, by setting the Log threshold computation activity flag to No.
- Finally, click the Update button.
- To enable the Audit log capability of eG Enterprise, click on the Auditing option in the manager settings panel. An audit log can be best described as a simple log of changes, typically used for tracking temporal information. The eG manager can now be configured to create and maintain audit logs in the eG database, so that all key configuration changes to the eG Enterprise system, which have been effected via the eG user interface, are tracked. The eG audit logs reveal critical change details such as what has changed, who did the change, and when the change occurred, so that administrators are able to quickly and accurately identify unauthorized accesses/modifications to the eG Enterprise system.
-
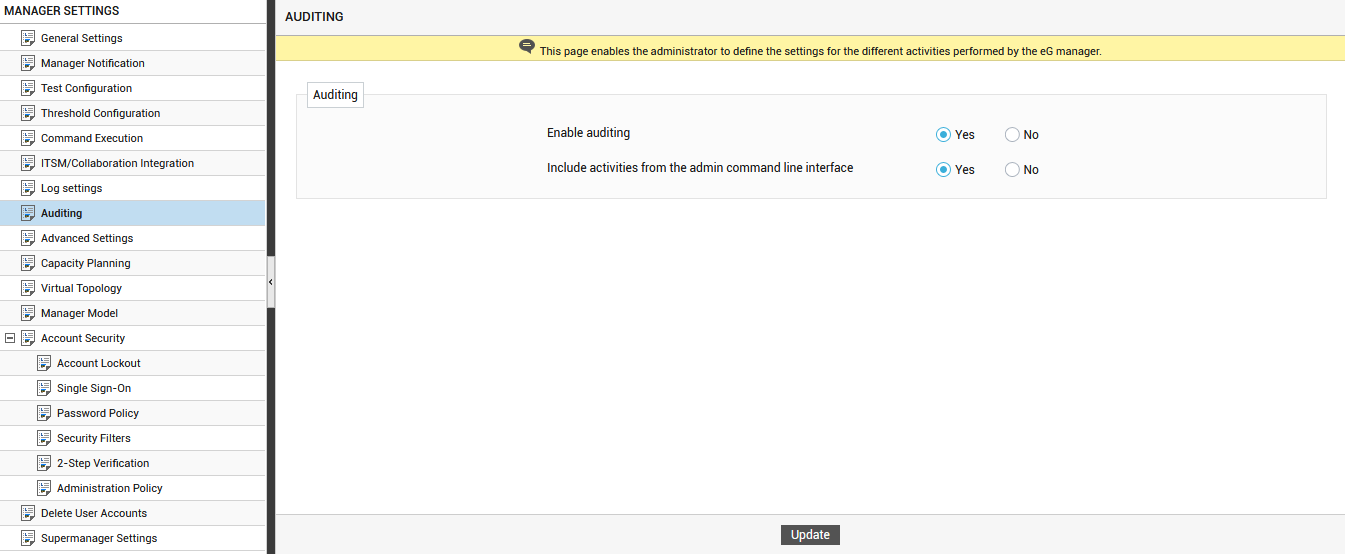
Clicking on the Auditing option reveals an auditing page in the right panel (see Figure 9).
-
Define the following in the auditing page:
- By default, the eG manager does not have audit logging capabilities. To enable the eG manager to perform audit logging, set the Enable auditing flag to Yes. By default, this flag is set to No.
- Setting the Enable auditing flag to Yes will allow you to include/exclude admin CLI (command lineinterface) activities in the eG manager's audit logging purview. The eG Enterprise provides a command-line interface (CLI) which allows any automation tool that pre-exists in the target environment or a script to communicate with the eG manager and execute simple commands on the manager to perform critical configuration tasks. This integration minimizes user intervention in the configuration of the monitoring system. By default, the eG manager also performs audit logging for configuration activities executed via the command line. Accordingly, the Include activities from the admin command line interface flag is set to Yes by default. To ensure that audit logging is not performed for admin CLI activitie, set this flag to No.
- Finally, click the Update button.
-
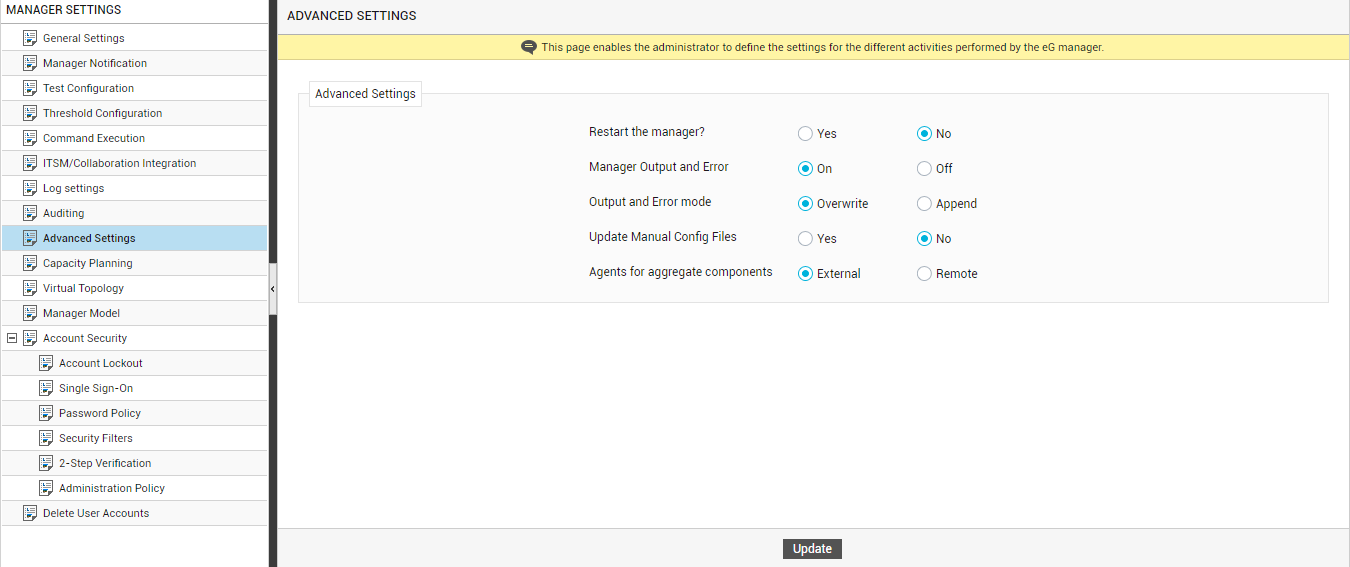
For configuring advanced manager settings, click on the Advanced Settings option in manager settings panel. This will result in the display of the advanced settings page (see Figure 10).
-
You can configure the following in the advanced settings page:
- You can now restart the eG manager from the eG administrative console itself. To restart the eG manager immediately, set the Restart the manager now? flag to Yes. By default, it is set to No.
- To enable logging of the errors and output related to the eG manager's activities, set the Manager Output and Error flag to Yes. This automatically creates the managererr.log and the managerout.log files in the <EG_INSTALL_DIR>\manager\logs directory. While the errors are logged in the managererr.log , the output of manager operations is logged in the managerout.log. Using these log files, you can quickly and easily track the status of the eG manager's activities, capture the errors that occur, and analyze the reasons for these errors/failures.
- Sometimes, after logging manager-related errors and output for a while, you may switch off logging for a brief period, and then switch it back on. Likewise, for some reason, you may decide to restart an eG manager, which is actively logging manager errors and output. In both these cases, new error and output messages will emerge, waiting to be written to the log files that pre-exist. By setting the Output and Error mode flag to Overwrite, you can ensure that the new messages completely replace the existing contents of the log files. Setting this flag to Append on the other hand, ensures that the new messages are only appended to the old contents.
-
Typically, whenever a user manually changes a configuration file (.ini file) of the eG manager, he/she would have to restart the eG manager for the changes to take effect. To make sure that changes to configuration files are effected even without a manager restart, then, soon after you make modifications to one/more configuration files, set the Update Manual Config Files flag in Figure 10 to Yes, and click the Update button. This will automatically update the eG manager with the configuration changes. Once the updation is complete, the status of the Update Manual Config Files will automatically switch to No.
Note:
The Update Manual Config Files flag cannot be used to update the eG manager with changes to language files. Gor changes to language files to take effect, you will always have to restart the eG manager.
-
The Metric Aggregation capability of the eG Enterprise allows administrators to group one or more components of a particular type and monitor that group as a single logical entity termed as an aggregate component. This aggregate component provides a collective view of the performance of all the components that are grouped together. Aggregates can be used to represent all the components of a specific type, or all components of a type in a geography or in a business unit.
Different organizations may want to view performance in different ways - some by type, some by geographies, and some by business unit. To provide administrators with maximum flexibility, and help them to configure any number of aggregate components without being constrained by the licensing of the eG monitors, eG Enterprise performs metric aggregation using external agents. By default, the Agents for aggregate components flag is set to External indicating that the default external agent bundled with the eG Enterprise is capable of monitoring an aggregate component. This helps the administrators to add any number of aggregate components depending on the views of their infrastructure they desire without needing additional licenses. In case, if you wish to monitor the aggregate components using a remote agent, then set this flag to Remote.
Note:
If you are already monitoring aggregate components using an external agent and now, if you wish to monitor the same aggregate components using a remote agent, then, you are required to purchase the premium licenses accordingly. If enough licenses are not available, then a message as shown in Figure 11 will be displayed and the external agent will continue to monitor the aggregate components.
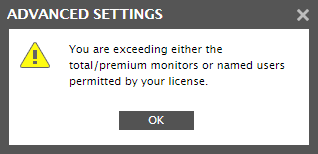
Figure 11 : A message displaying that there are not enough premium licenses available
- Finally, click the Update button.
-
eG Enterprise offers eG CLI and eG REST API capabilities to enable administrators to perform various configuration tasks on the eG manager using CLI/REST API commands. Administrators can use these capabilities only if they are enabled. For this purpose, click on the CLI/Rest API Settings option in manager settings panel. This will result in the display of the cli/rest api settings page (see Figure 12).
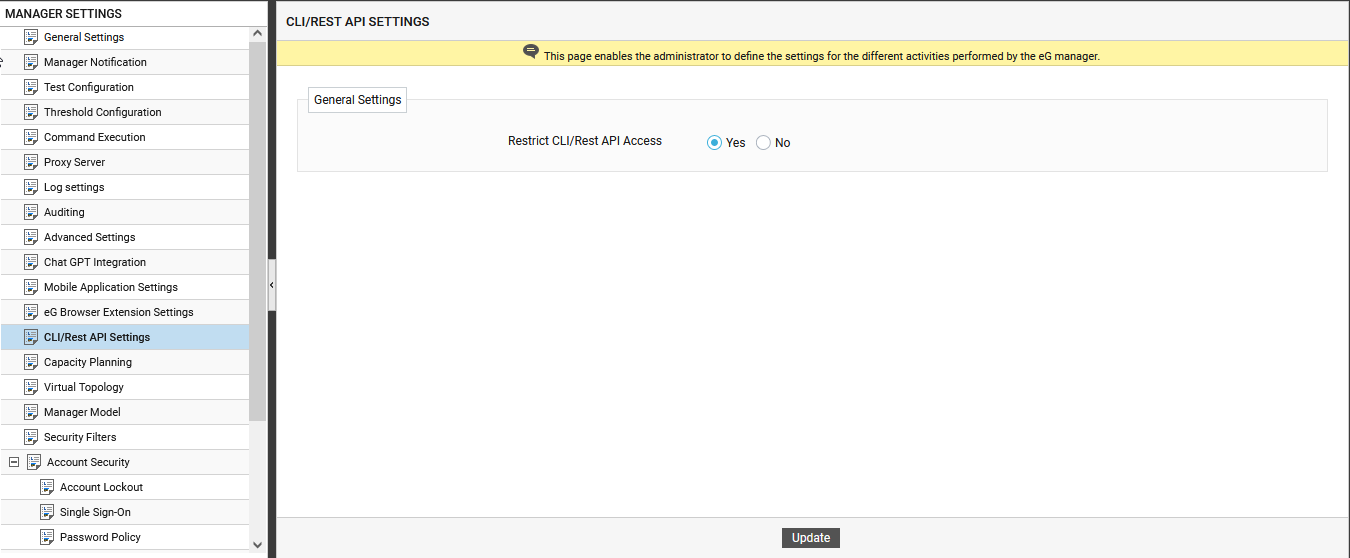
Figure 12 : Configuring the CLI/Rest API Settings
By default, the Restrict CLI/Rest API Access flag is set to Yes indicating that eG Enterprise restricts the administrators to perform the tasks through the CLI/Rest API commands by default. If administrators wish to perform the tasks using CLI/Rest API commands, set this flag to No and register the setting by clicking on the Update button (see Figure 12). Doing so will invoke additional flags as shown in Figure 13.
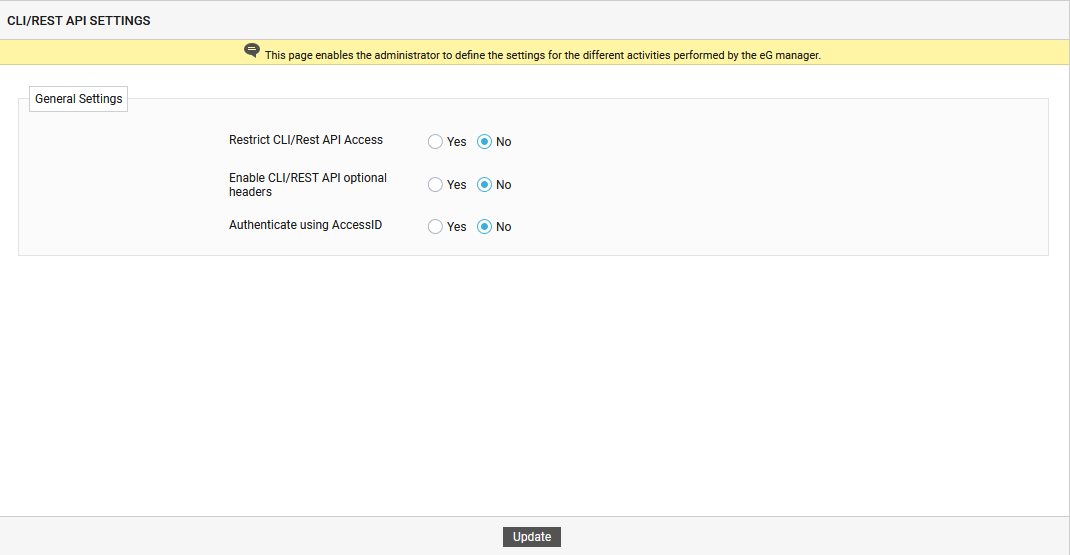
Figure 13 : Additional flags for configuring CLI/Rest API access
By default, eG Enterprise sends the Server:eG Manager as a Key:Value pair in the REST API Header in response to HTTP requests. If you wish to send additional Key:Value pairs in the REST API Header in response to HTTP requests, then you can do so by setting the Enable CLI/REST API optional headers flag to Yes. Upon doing so, the following Key:Value pairs will also be sent in the REST API Header in response to a HTTP request.
Key
Value X-Content-Type-Optionsnosniff nosniff Content-Security-Policy default-src 'none' X-Powered-By none X-AspNet-Version none To ensure secure authentication between a third party REST API tool (for e.g., Postman) and the eG manager, you can set the Authenticate using AccessID flag to Yes. A REST API AccessID field then appears. Administrators can copy this AccessID using the
 button and paste the same in the Value column again the accessID Key in the Header of the third party tool used to receive/send HTTP requests/responses. This ensures that the authentication between the third party tool and the eG manager is secure.
 -
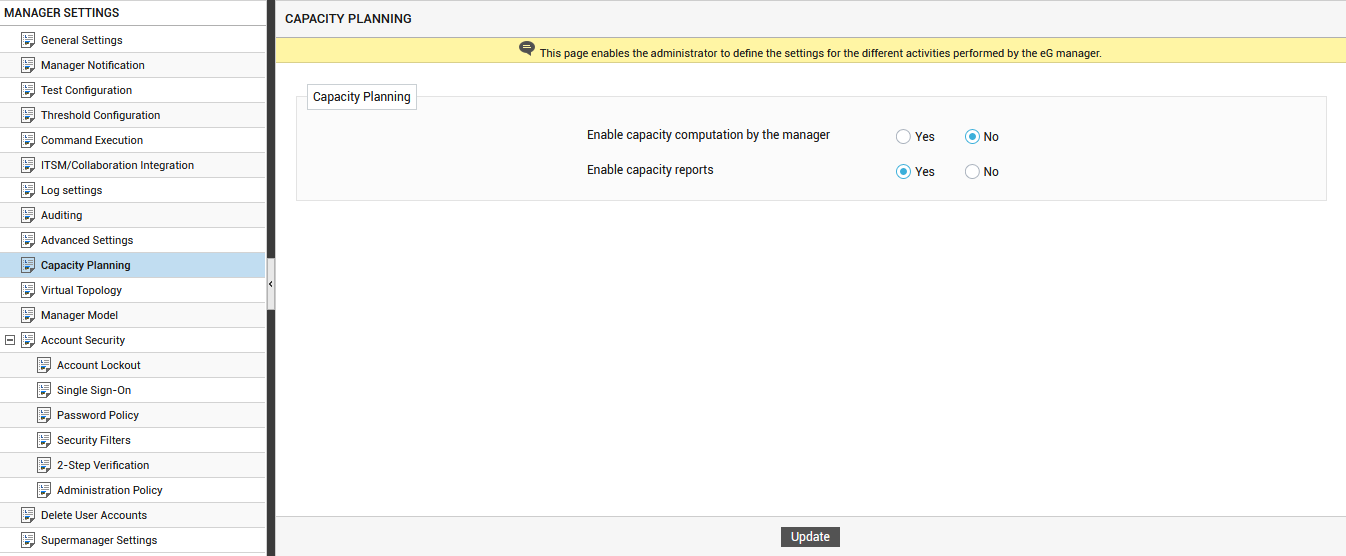
To enable administrators to easily and effectively study the historical trends in performance and accurately assess future capacity requirements, the eG Reporter offers a dedicated Capacity Planning Reports category. By default, eG Reporter does not allow users to generate Capacity Planning reports. Clicking on the Capacity Planning option in the manager settings panel will invoke the capacity planning page in the right panel (see Figure 14).
-
To enable the generation of this category of reports, do the following in the capacity planning page:
- Reports generated using trend data can accurately reveal the past load and performance trends, using which future trends in load and usage can be determined, potential sizing inadequacies predicted, and the future capacity prudently planned. This trend data is typically computed by applying the Avg, Sum, Max, Min, and Percentile functions on the measure data. To enable the eG manager to compute the trend data by applying the aforesaid functions, set the Enable capacity computation by the eG manager flag to Yes. By default, this is set to No.
- To enable capacity report generation, set the Enable capacity reports flag to Yes. If you do not want to generate any capacity planning reports, then, set this flag to No. If this flag is set to Yes and the Enable capacity computation by the eG manager flag to No, then the eG manager will not compute the Avg, Sum, Max, Min, and Percentile values of the measures, but you can still attempt to generate capacity planning reports. In this case, the Custom and System capacity planning reports, which rely solely on trend data, will not display any results. Also, the Cumulation, Correlation, and Prediction reports can be generated using raw measure data only and not the computed trend data. On the other hand, if both the flags are set to Yes, then all reports can be generated.
- Finally, click the Update button.
-
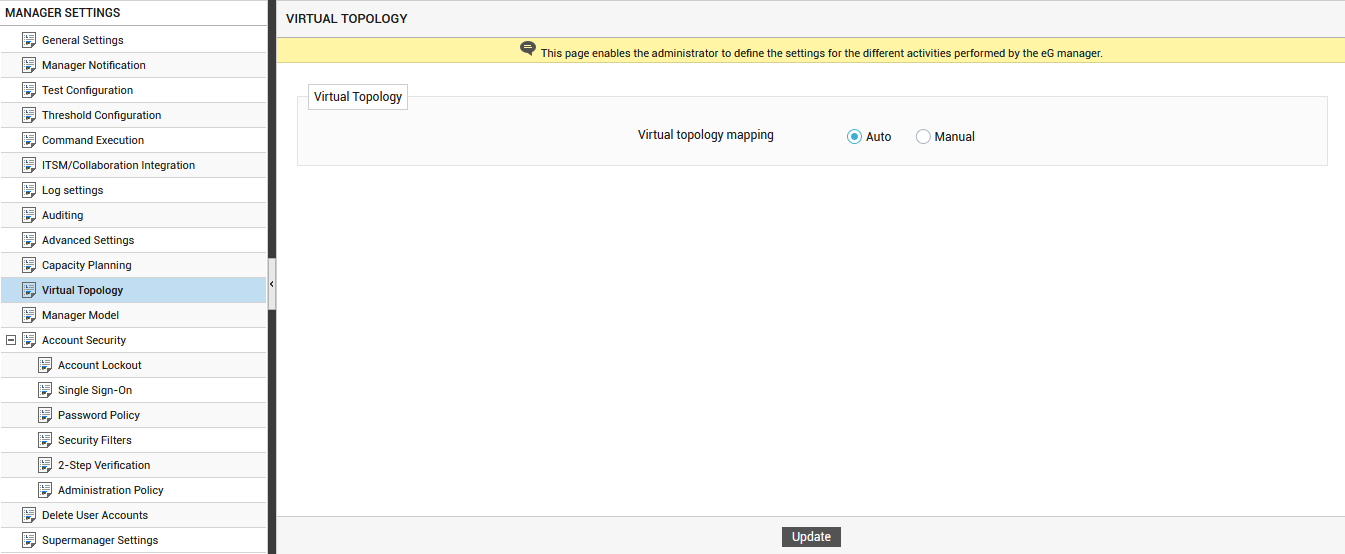
To configure the automatic generation of a virtual topology, click the Virtual Topology option in the manager settings panel of Figure 14. The right panel will then change to reveal the virtual topology page (see Figure 15).
-
eG Enterprise is capable of automatically determining the mapping of applications to virtual hosts. This is why, the Virtual topology mapping flag in Figure 15 is set to Auto by default. This default setting ensures that eG Enterprise intelligently discovers which managed applications are actually executing on the VMs of a virtual host and automatically maps these applications to that virtual host in the Virtual Topology preview in the eG monitoring console. This mapping of applications to virtual hosts is important for root-cause diagnosis - for example, a problem with the virtual host (e.g., excessive disk slowdowns) can impact the performance of all the applications running on that host’s virtual machines.
If you set the Virtual topology mapping flag to Manual, then, when adding applications for monitoring in an environment where one/more hypervisors are already monitored, you will have to explicitly indicate whether/not the application being added is executing on a virtual host. If so, you will have to additionally pick the managed virtual host with which that application is associated.
-
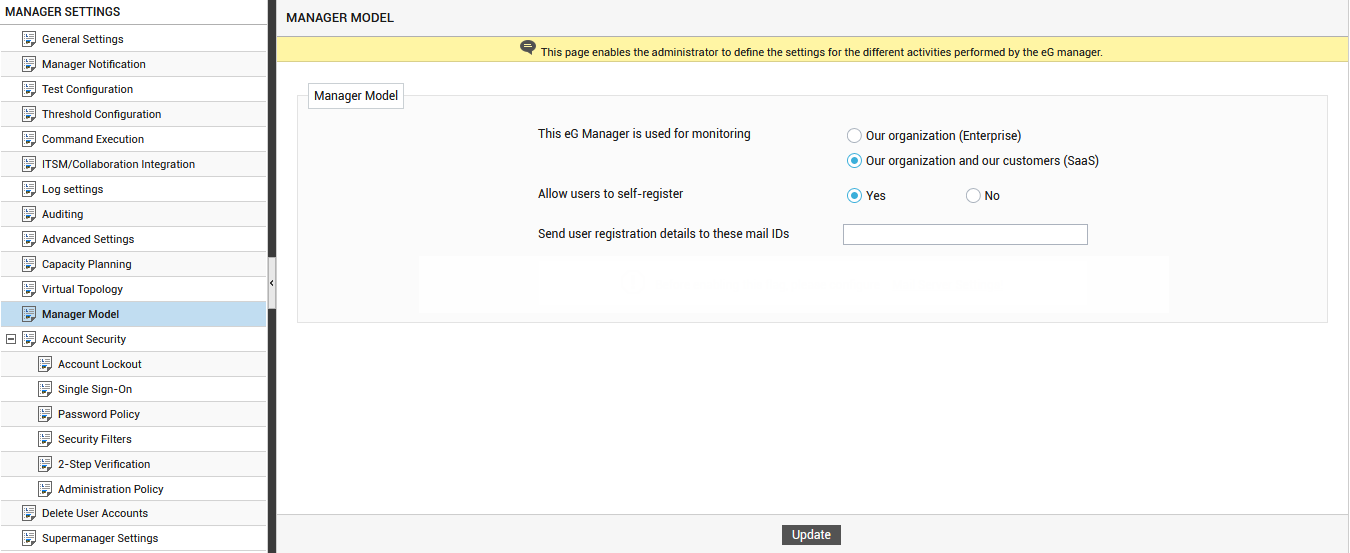
Use the Manager Model option to change the deployment model of the eG manager. At the time of manager installation, you are required to indicate the deployment model of the eG manager. If, post manager installation, you want to switch to a model different from the one chosen earlier, you can do so using the Manager Model option. Clicking on this option in the left panel, provides the following options in the right panel:
-
Enterprise: This model is ideal if your eG manager will be monitoring only your organization's IT infrastructure. In this case, eG's agent-based/agentless monitors will be deployed on and will pull metrics from the components in your infrastructure only. The employees of your organization will be the primary stakeholders and consumers of the performance data so collected.
Such a model is typically, administrator-driven. In other words, an administrator will be responsible for performing all administrative activities related to the eG manager - this includes, installing agents, managing the components, configuring thresholds, tests and alerting, managing users, building segments and services, defining zones, and more. The other stakeholders - i.e., the employees - will usually be vested with only monitoring rights, or in some special cases, very limited administrative rights, as the administrator deems fit.
If you want to deploy the eG manager for Enterprise, then select the Our Organization (Enterprise) option in Figure 16.
-
SaaS: This model is ideal if you are a Managed Service Provider (MSP), providing infrastructure hosting and management services to multiple customers. Monitoring is quiet often a cloud-based service that an MSP offers to each of their customers. If you are an MSP, you will want the eG manager to not just monitor your infrastructure, but also that of your customers. This means that an eG manager centrally deployed in the MSP infrastructure will be managing agents deployed in the customer infrastructure as well.
The SaaS model also helps where a single eG manager manages agents used by different departments (eg., Development, Testing, Support etc.) / support groups (Europe Support, EMEA Support, USA Support etc.) / IT domains (Network administration, Database administration, Windows administration etc.).
With the SaaS model, eG Enterprise fully supports mult-tenancy. Unlike the Enterprise model, in SaaS, the administrator will not be the sole custodian of administrative rights. Instead, these rights will be delegated to the individual tenants - say, MSP customers, department heads/workers, support personnel who are part of different support groups, or IT domain experts. The tenants are thus empowered to deploy the agents they want, manage the components they wish to monitor, and customize accesses, monitoring, and alerting based on the requirements of their infrastructure. The central administrator will continue to hold unrestricted administrative rights, which will enable him/her to manage monitoring licenses of the tenants, oversee performance and problems across tenant infrastructures, and even override a tenant's monitoring configuration if required.
If you want to deploy the eG manager for SaaS, then select the Our Organization and our customers (SaaS) option in Figure 16.
-
-
In a SaaS deployment, tenants are by default allowed to self-register with the SaaS manager. This is why, if the Our Organization and our customers (SaaS) option is chosen as the deployment model, an Allow users to self-register flag will appear, which will be set to Yes by default. In some SaaS environments, for security reasons, the administrator may prefer to completely control tenant registrations, instead of allowing tenants this flexibility. In such a case, the administrator can set the Allow users to self-register flag to No. If this is done, then only an administrator will be able to register a tenant by creating a profile in the eG Enterprise system for that tenant.
- If the Allow users to self-register flag is set to Yes, then a Send user registration details to these mail IDs text box will appear. In this text box, specify a comma-separated list of email IDs to which the registration details of a tenant has to be sent soon after that tenant self-registers with the SaaS manager. This way, you can have key personnel in an organization notified every time a tenant self-registers with the SaaS manager.
-
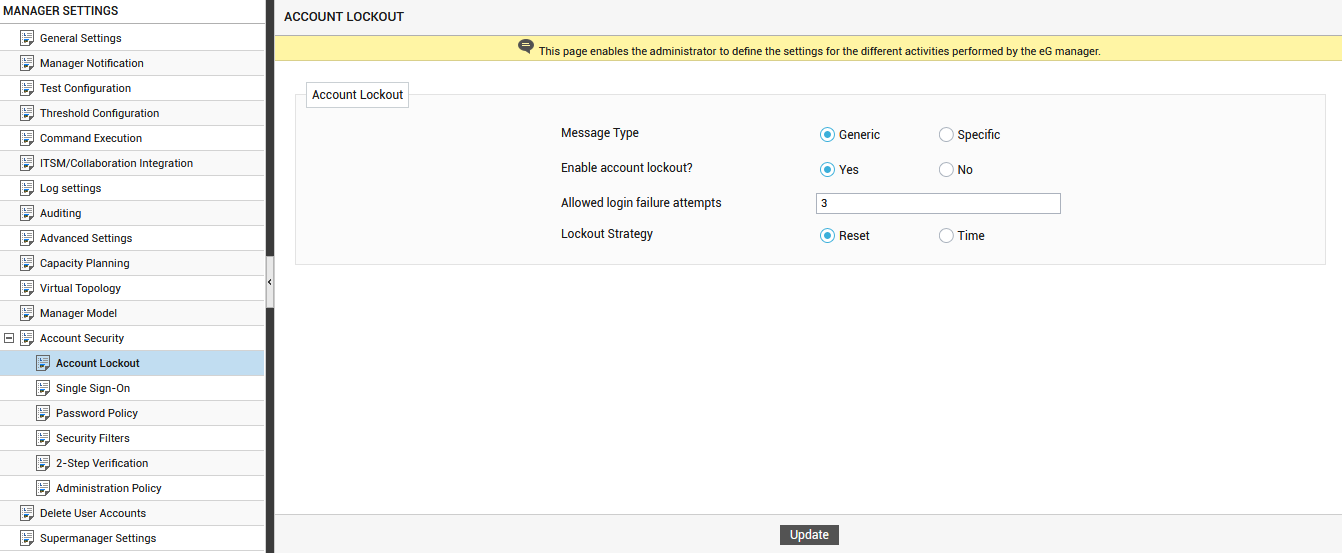
In order to protect the eG Enterprise system from misuse by malicious users, the eG manager automatically locks out a user if he/she consistently fails to login to the eG management console. You can set when the lockout should occur, how long a user should remain locked out, and can even disable the locking capability, using the Account Lockout option in the manager settings panel of Figure 15. Selecting this option invokes the account lockout page in the right panel, as depicted by Figure 17. To know how set an account lockout policy, refer to the Account Lockout topic.
-
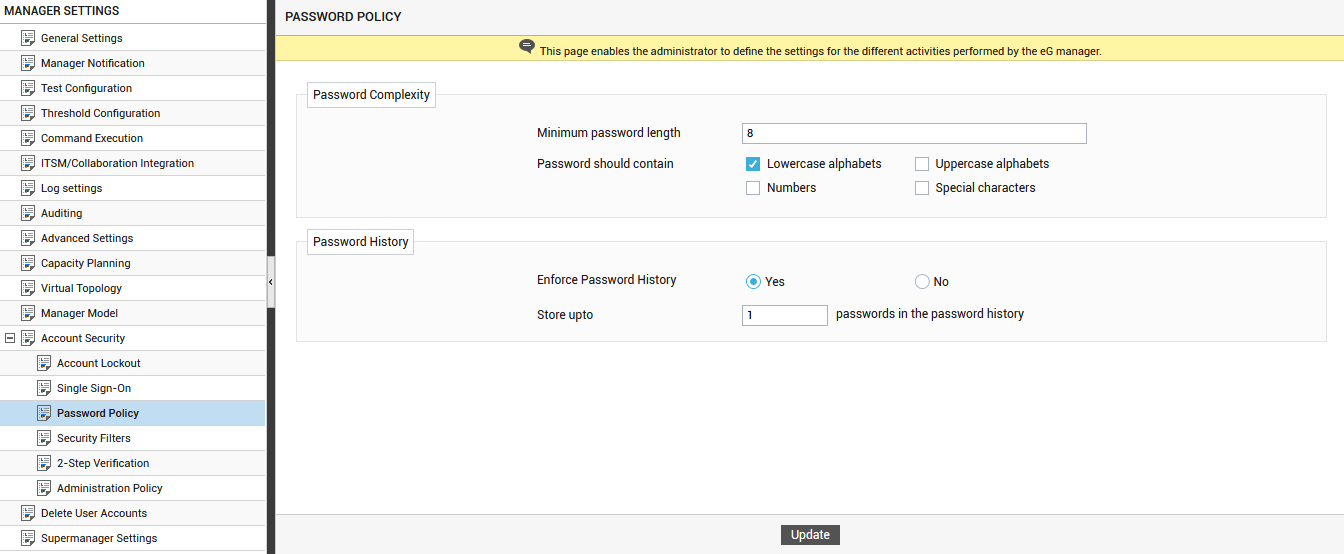
You can also define a policy for the password you set for local (not domain) users to the eG management console. For this, select the Password Policy option from the manager settings panel in Figure 17. This will invoke the password policy page in the right panel (see Figure 18). To know how to define a password policy using this page, refer to the Password Policy topic.
-
One of the growing concerns in the web world is security! New security threats/vulnerabilities keep cropping up each day, putting web applications and the confidential/sensitive data they handle at risk.
To enable application developers/architects to keep track of such threats/vulnerabilities, a non-profit organization called OWASP - Open Web Application Security Project - periodically publishes a Top-10 report. This is an 'awareness' report, which outlines the most critical security risks for web applications. The risks highlighted in the latest Top-10 report include Injection, Cross-site scripting (XSS), Broken Authentication, Security misconfiguration, Insufficient Logging etc.
Since eG manager is a web application, the security threats that are featured in OWASP's report apply to the eG manager as well , and can greatly impact its stability and reliability. This is why, the eG manager is pre-hardened against many of the security vulnerabilities listed in OWASP's report!
The security filters of the eG manager are turned on by default, so that, as soon as the eG manager is installed and configured, it is automatically protected against the following vulnerabilities:
Vulnerability
Description
SQL Injection
An injection attack that executes malicious SQL statements to control a database server behind a web application
Cross-Site Scripting (XSS)
A client-side code injection attack that executes malicious scripts in a web browser of the victim by including malicious code in a legitimate web page or web application.
Cross-Site Request Forgery (CSRF)
An attack against authenticated web applications using cookies where the attacker is able to trick the victim into making a request that the victim did not intend to make.
Clickjacking
An attack that tricks a user into clicking a webpage element which is invisible or disguised as another element.
TCP Time Stamp Vulnerabilities
The TCP timestamp response can be used to approximate the remote host's uptime, potentially causing attacks.
Hacking of Browser Cookies
Many web applications have cookie related vulnerabilities that lead to user impersonation, remote cookie tampering, XSS and more
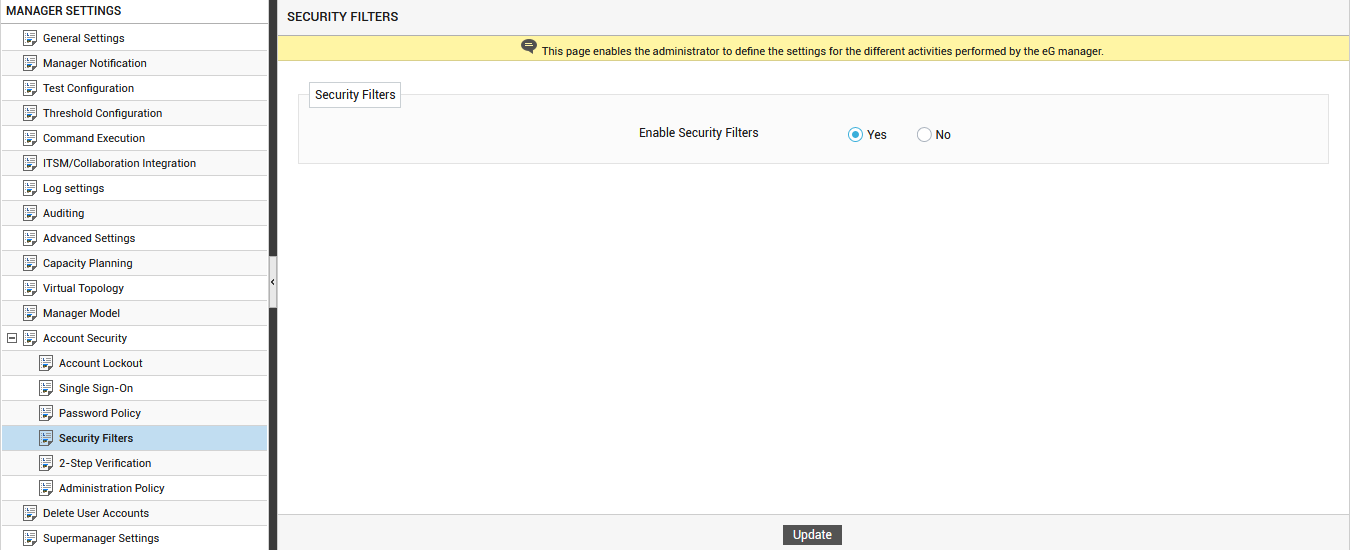
If you want to disable these security filters, then first click the Security Filters option in the Manager Settings panel . Then, when the Enable Security Filters flag comes up in the right panel, set the flag to No. Finally, click the Update button.
-
eG Enterprise supports two-factor authentication - a.k.a two-step verification - for validating user logons to the eG management console. This requires the user to validate with a unique code in addition to user name and password.
Using two-step verification, eG Enterprise:
- Discourages attacks that involve user impersonation to gain access to sensitive data;
- Ensures secure access to the eG Enterprise system, without putting the user network and sensitive information at risk;
-
Boosts user productivity and instills user confidence in the eG Enterprise system, by dispelling their fears of data breach
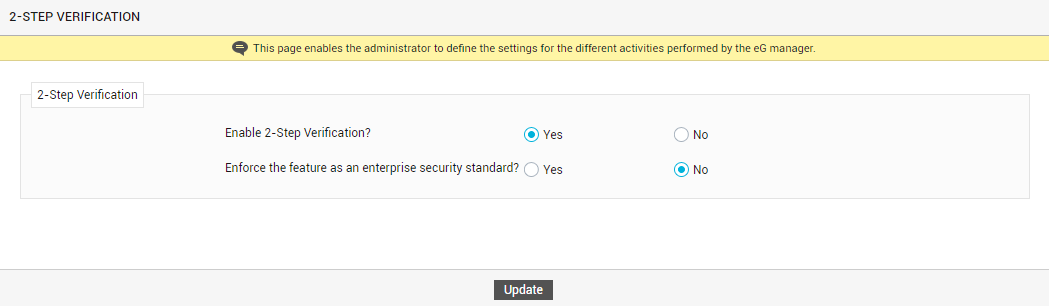
To enable support for two-step verification, click the 2-Step Verification option in the MANAGER SETTINGS panel. A 2-Step Verification section will then appear in the right panel (see Figure 20). To know how to use Figure 17 to enable 2FA support, refer to the Two-Step Verification topic.
-
By default, any user with administrative rights to the eG Enterprise system can login to the eG admin interface and make configuration changes, regardless of where he/she is coming from.
High security environments may consider this a vulnerability, as any user on the internet who can hack the login credentials of an administrative user, can gain access to the eG admin interface and make unauthorized changes to the eG Enterprise system! To protect admin user accesses from such security risks, eG Enterprise allows strict administration policies to be configured and enforced.
Using an administration policy, you can ensure that admin user access is allowed only for those users who connect to the eG management console from 'known' / 'reliable' / 'safe' locations. These 'secure locations' are indicated by an IP address, a range of IP addresses, or IP address patterns.
Where an administration policy is set, eG Enterprise allows a user to login to the eG admin interface only if:
- The user has 'administrative' rights to eG Enterprise, and;
-
The IP address from which the user is connecting belongs to the list of IP addresses configured under an administration policy.
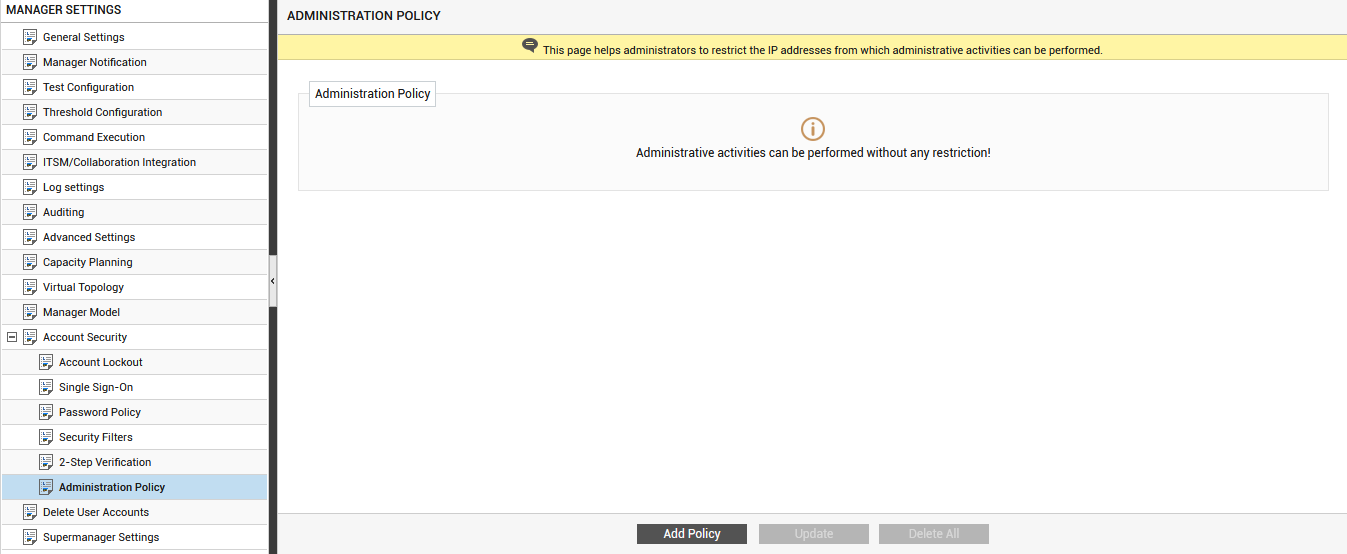
To configure an administration policy, first click the Administration Policy option in the MANAGER SETTINGS panel. An Administration Policy section will appear in the right panel (seeFigure 21). To know how to configure an administration policy using Figure 21, refer to Administration Policy topic.
-
If you want, you can have eG Enterprise automatically delete the infrastructure elements (eg., components, services, zones etc.) associated with an organizational unit as soon as that organizational unit is deleted. This capability is most useful in a SaaS deployment of the eG manager. In a SaaS deployment, tenants often self-register with the eG Enterprise system. Such tenants are automatically granted the privileges of an 'organizational unit' and are allowed to choose which infrastructure elements they want monitored. Because tenants service their own monitoring needs, an administrator may not know what elements were managed by which tenant.
Later, if a tenant chooses not to use the monitoring service any longer, the administrator may delete the organizational unit that corresponds to that tenant from the eG Enterprise system. Doing so however, does not automatically deprovision the removed tenant's monitored environment from the eG Enterprise system. This means that eG Enterprise will continue to monitor the environment of a deleted tenant, until such time the administrator manually identifies and removes the managed elements from the eG Enterprise system. Since administrators often have little knowledge of a tenant's monitoring scope, this exercise could take hours! In the meantime, eG agents will be unnecessarily monitoring an environment that does not exist! To put monitoring resources (eg., agents, licenses) to better use and to reduce administrator workload, you can configure eG Enterprise to automatically delete a tenant/organizational unit's environment as soon as that tenant/organizational unit is deleted.
Additionally, you can also instruct eG Enterprise to auto-delete expired user accounts. This helps you to declutter and focus on only those user accounts that are actively used.
To achieve all of the above, first click the Deleted User Accounts option in the MANAGER SETTINGS panel. The right panel will then change as depicted by Figure 22.
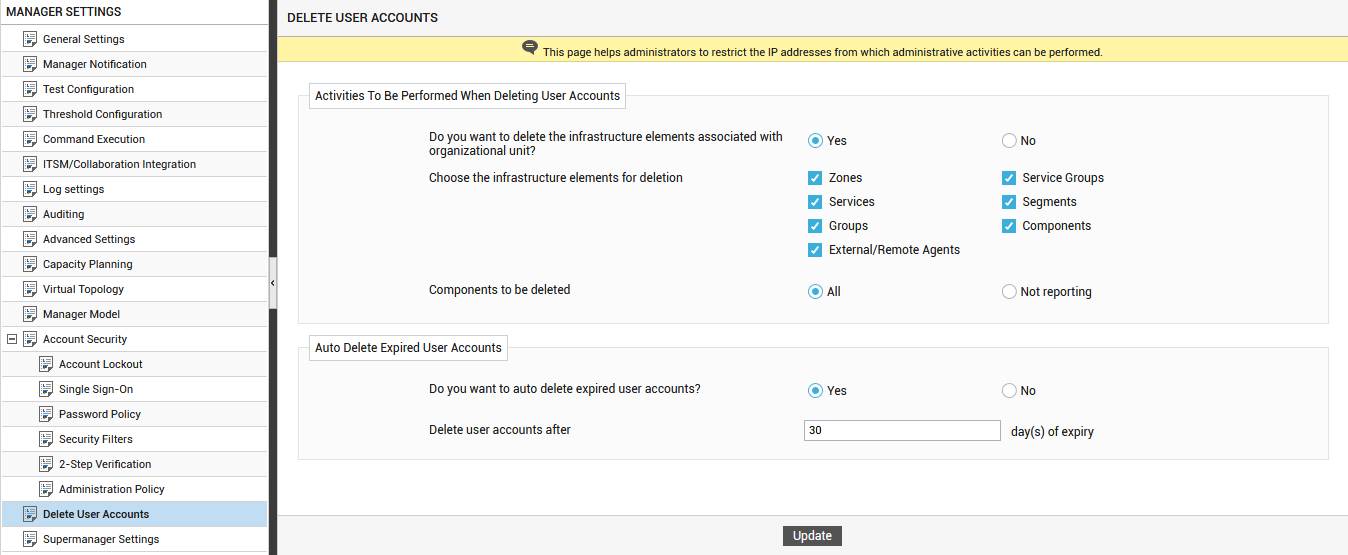
Figure 22 : Configuring the automatic deletion of elements associated with an organized unit and expired user accounts
-
In Figure 22, specify the following:
- If you want to automatically delete infrastructure elements associated with an organizational unit once the organization unit is deleted, then set the Do you want to delete the infrastructure elements associated with organizational unit? flag to Yes.
- If you set the Do you want to delete the infrastructure elements associated with organizational unit? to Yes, you must indicate which infrastructure elements you want to auto-delete. For this, select the relevant check boxes from the Choose infrastructure elements for deletion section.
- If the Components check box is chosen from the Choose infrastructure elements for deletion section, then you can indicate what type of components you want to auto-delete by selecting an option from the Components to be deleted section. Select the All option if you want to delete all components associated with the deleted organizational unit. Select the Not Reporting option if only those components for which the eG agent is no longer reporting metrics are to be deleted.
- If the Components to be deleted flag is set to Not Reporting, then in the Component not reporting for last text box, you can specify how long an eG agent should not be reporting metrics for a component so eG Enterprise auto-deletes that component. By default, this is set to 30 days. You can increase or decrease the duration as you see fit.
- To auto-delete expired user accounts, set the Do you want to auto-delete expired user accounts? flag to Yes.
- If the Do you want to auto-delete expired user accounts? flag is set to Yes, then in the Delete user accounts after text box, specify how long, post account expiry, eG Enterprise should wait to delete a user account. By default, eG Enterprise auto-deletes a user account 30 days after expiry. You can increase or decrease this waiting period as you deem fit.
- Finally, click the Update button.
-
To enable an eG manager to communicate with an eG SuperManager,
-
the details of the eG manager should be configured in the eG SuperManager and
-
the details of the eG SuperManager should be configured in every manager reporting to it.
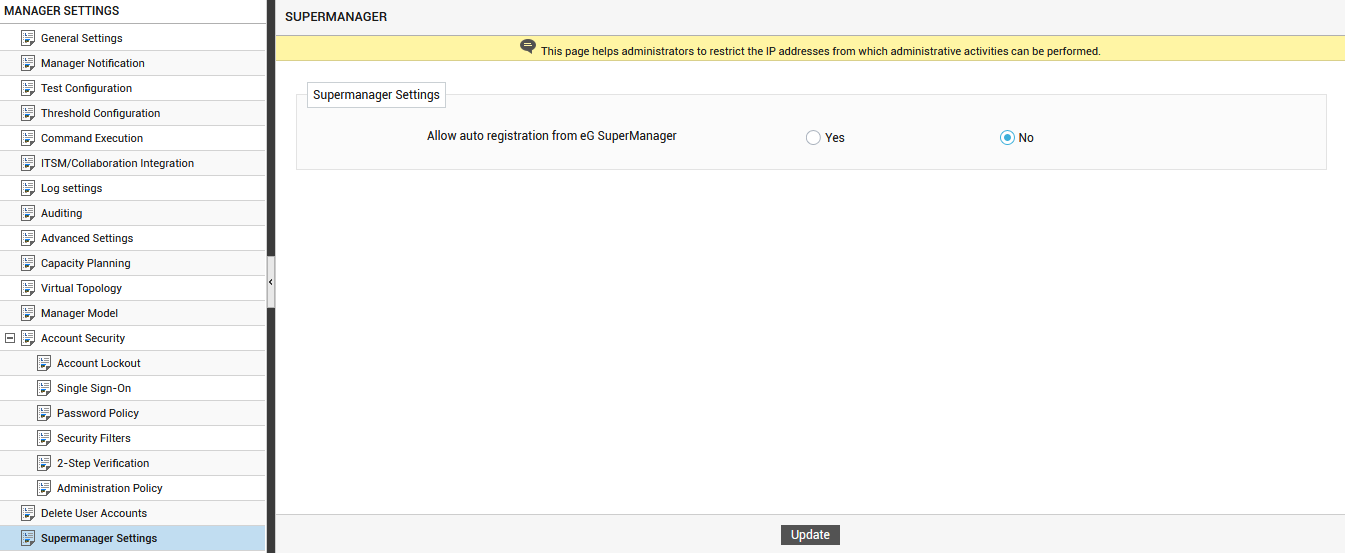
Figure 23 : Enabling automatic registration of eG SuperManager in eG manager
To simplify the registration of the eG SuperManager, you can use the SUPERMANAGER page (see Figure 20) that appears when you click the SuperManager Settings option in the MANAGER SETTINGS panel. Setting the Allow auto registration from eG SuperManager flag to Yes will automatically enable the eG SuperManager to register with each of the eG managers reporting to it. Once the eG SuperManager automatically registers with the eG manager, the details of the eG SuperManager will be automatically populated in the SUPERMANAGER SETTINGS page of the eG manager. By default, this flag is set to No.
-
-
eG Enterprise offers various eG monitoring licenses such as server-based, concurrent device based, per-node based etc. By default, eG Enterprise offers day wise graphs of the eG monitoring licenses based on usage. Administrators can change the default view of the graph based on their choice. To enable this change, administrators can click the License settings option in the left panel of Figure 24.
In the LICENSE SETTINGS page that appears in the right panel, by default, the Default View for graph is set to Total indicating that the day wise graphs of the eG monitoring licenses that appear when the
 icon is clicked in the Total License Usage tab of the LICENSE INFORMATION page (when accessed through the menu sequence: Admin -> Miscellaneous - > License Overview) lists the total licenses consumed as a single bar in the graph. If you set this flag to Distribution, then, the distribution of licenses based on the devices/VMs/endpoints etc will be displayed in the graph.
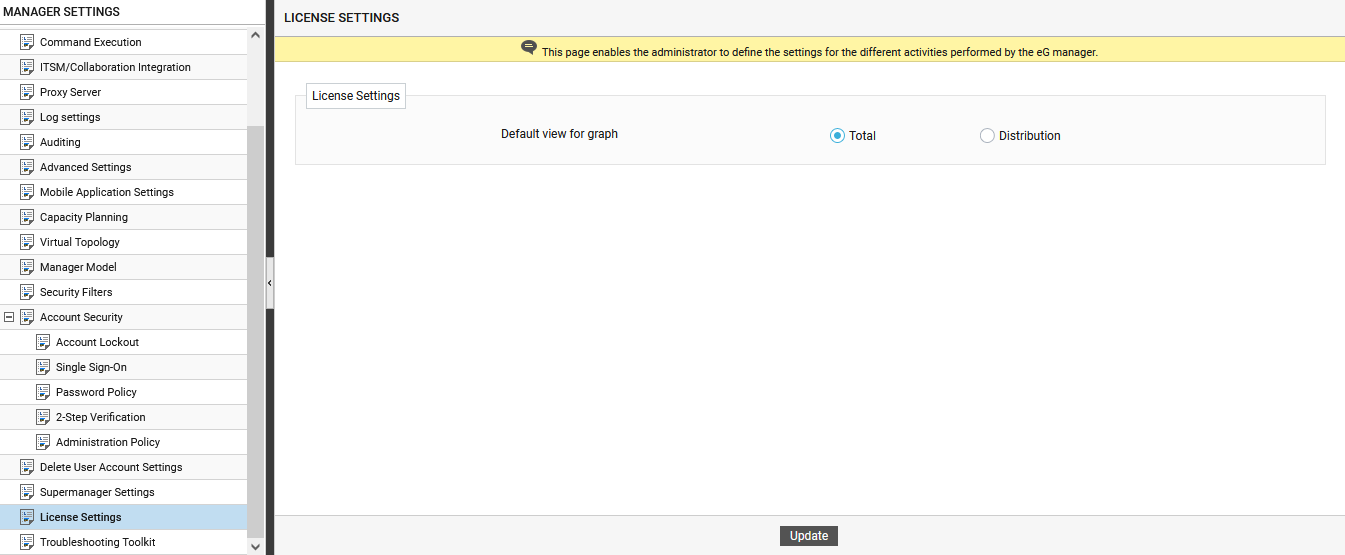
Figure 24 : Setting the default view of graph
-
Sometimes, eG customer support personnel may need to troubleshoot issues occurring in the eG manager without logging into the eG manager. To aid the customer support personnel in this regard, eG Enterprise offers a Toolkit capability.
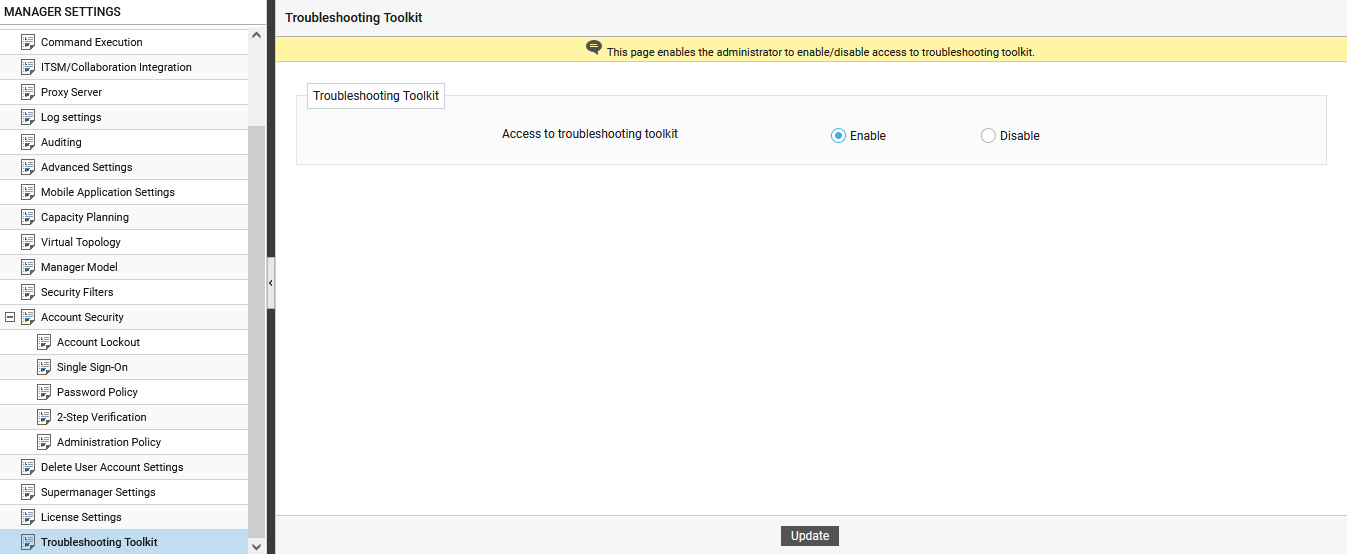
Figure 25 : Accessing the Troubleshooting Toolkit