Discovered Components Report
In large dynamic infrastructures, administrators may find it difficult to figure out which components were discovered most recently and when exactly (time and date) were they discovered. Also, a few components such as Citrix Virtual Apps servers are capable of being discovered by both eG manager and eG agent. In such cases, administrators may be unaware of the mode of discovery (agent-based or manager-based) that was used to discover such components. To enable administrators figure out these information at a single glance, eG Enterprise offers the Discovered Components Report.
To generate this report, do the following:
-
Login to eG admin interface.
-
Navigate through the menu sequence:
-
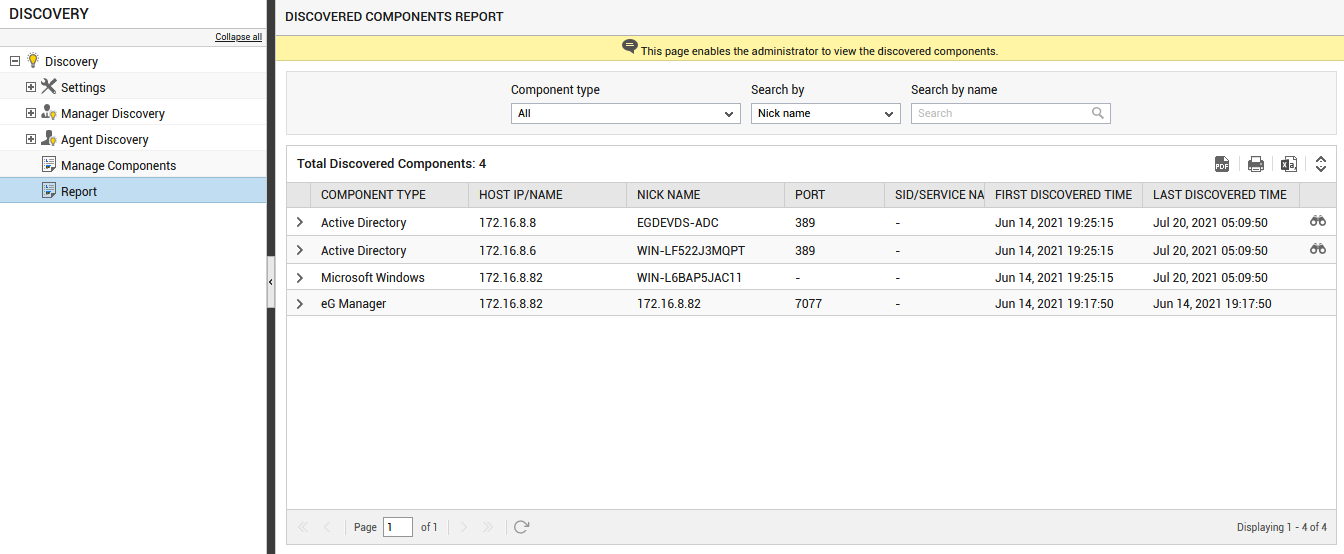
The DISCOVERED COMPONENTS REPORT page will then appear (see Figure 1).
-
By default, this report will list all the component types that are discovered in the target environment. Therefore, by default, All option will be chosen from the Component type list.
-
By default, the Nick name option will be chosen from the Search by list indicating that you can search for a component of your choice using the nick name of the component. Typing a few alphabets of the nick name in the Search by name text box will filter the components that match your search criteria. Similarly, you can choose to search for the component of your choice based on the Host IP/Name.
-
If you wish to choose to filter the discovered components based on the component type, then you can do so by choosing Component type option from the Search by list. Typing a few alphabets of the component type of your interest in the Search by name text box will filter the components that match your search criteria.
-
Alternately, if you wish to generate the report for only those components that were discovered in the time duration of your choice, you can do so by choosing the Last discovered time option from the Search by list. By default, 24 hours will be chosen from the Timeline indicating that the report will be generated for the components that were discovered in the last 24 hours. You can even search for a timeline of your choice by picking Any option from the Timeline list and choosing the dates of your choice using the From and To lists.
-
The generated report comprises of the following:
-
The name of the Component type
-
The Host IP/Name
-
The nick name of the component that is discovered
-
The port
-
If the Oracle Database server is discovered, then, the SID/Service name of the Oracle Database instance will be reported
-
The discovery mode using which the component was discovered.
-
The host from which the discovery was initiated.
-
The date and timestamp on which the component was discovered for the first time
-
The date and timestamp on which the component was last discovered
-
The last date and time on which the component was successfully discovered.
-
The last time the component’s information was reported or updated.
-
Indicates whether the component is excluded from monitoring.
-
-
If any of the discovered component remains unmanaged, then you can manage the component by clicking the
 icon available against that component. Clicking the icon will lead you to Figure 2 using which you can manage the component.
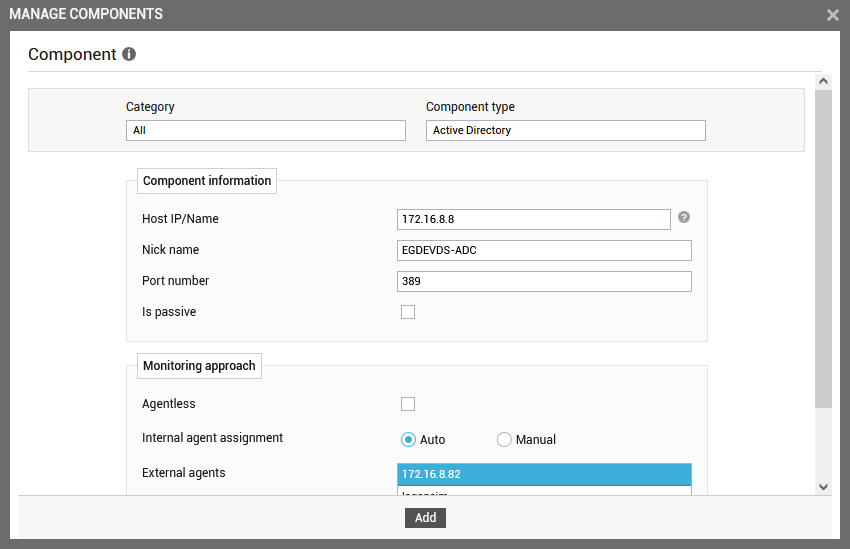
-
To export this report in a PDF format, click the
 icon.
icon. -
To print this report, click the
 icon.
icon. -
To export this report in a CSV format, click the
 icon.
icon.