Retrieving Uptime of Components
Using the eG REST API, administrators can retrieve the uptime/downtime of the components (i.e., servers/network devices/hypervisor) managed in the target environment for a chosen time period. The table below specifies the URL and the parameters that should be used to retrieve the measures of the tests.
URL: http://<eG manager IP:port>/api/eg/analytics/getUptimeForServers
Method: POST
Content-Type: application/json
| Parameters | Key values | Example |
|---|---|---|
|
Headers |
managerurl: Base URL of the eG Manager i.e., http://<IP address of the eG console:Port> user: eG username or domain/eG username pwd: Base64 encoded password |
Example to retrieve uptime of components for a week: { "timeline":"1 week" } Example to retrieve uptime of components during the last week: { "timeline":" LastWeek", "componentType":"VMware vSphere ESX", } Example to retrieve uptime of a chosen component: { "componentName":"EGDP156:7077", "timeline":"1 week" } Example to retrieve uptime of components of a chosen component type: { "componentType":"eG Manager", "timeline":"1 month" } Example to retrieve uptime of components for a chosen time duration: {
"componentName":"C2112TS2XA3", "timeline":"any", "startDate": "January 01, 2023 00:00:00", "endDate": "January 05, 2023 01:00:00" } |
|
Body |
Default: { "timeline":"time period specified in hours/days/months/LastWeek/LastMonth/Any" } |
|
|
Optional: { "componentName":"Hostname of the component:Port:SID", "componentType:":"Component Type", "startDate":"start_date", "endDate":"end_date" } |
| Type | Code | Content |
|---|---|---|
|
JSON |
200 |
[ { "componentName": "C2112TS2XA3", "componentType": "Citrix Virtual Apps 7.x", "uptime": 604740, "downtime": 60, "percentUptime": "99.9901", "percentDowntime": "0.0099" }, { "componentName": "C2112TS2DDC1", "componentType": "Citrix License", "uptime": 604800, "downtime": 0, "percentUptime": "100", "percentDowntime": "0" }, { "componentName": "172.16.10.90", "componentType": "eG Manager", "uptime": 604800, "downtime": 0, "percentUptime": "100", "percentDowntime": "0" }, . . . ] |
| Type | Code | Content |
|---|---|---|
|
JSON |
401 UNAUTHORIZED |
{"code": 401,"error": "Invalid username or password"} |
|
JSON |
400 BAD REQUEST |
You may receive one of the following responses: {"code": 400,"error": "Bad Request. Header parameters : Username or Password or Manager URL is missing"} (or) {"code": 400,"error": "Bad Request. Header parameters : Manager URL, Username or Password is not provided"} (or) {"code": 400,"error": "Unable to connect manager. Please verify manager URL and make sure that eG manager is running"} (or) {"code": 400,"error": "Bad Request. Please refer eG REST API documentation and add required parameters for this API"} (or) {"code": 400,"error": "Component not associated with the user"} (or) {"code": 400,"error": Please provide valid/associated componentType"} (or) {"code": 400,"error": "Uptime / Device Uptime / Uptime - ESX Test is not applicable for given Component"} (or) {"code": 400,"error": "Please provide valid timeline"} (or) {"code": 400,"error": "Bad Request. Please give Start date and End date if timeline is Any. Please refer eG REST API documentation for this API"} |
|
JSON |
500 Server Error |
{"code": 500,"error": " Server Error. Please check REST API parameter values and also check /manager/logs/error_log or managererr.log in the eG manager installation directory for more information."} |
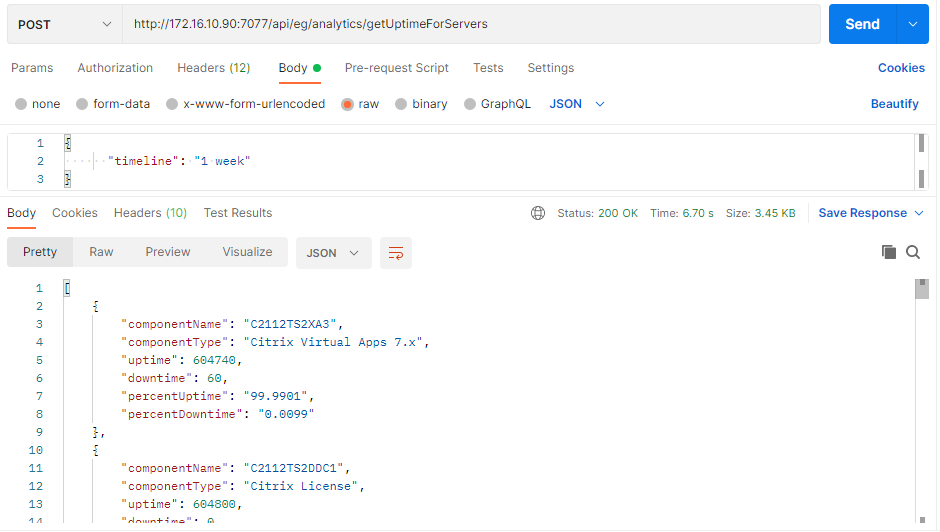
Figure 1 : Retrieving uptime of components for a chosen time period using Postman REST Client
Retrieving Uptime of Components using cURL
To retrieve the uptime of components managed in the target environment using cURL, the command with default parameters should be specified in the following format:
curl -L -X POST "http://<eG Manager IP:Port>/api/eg/analytics/getUptimeForServers" -H "user:<eG username or domain/eG username>" -H "pwd:Base64 encoded password" -H "managerurl:http://<eG Manager IP:Port>" -H"Content-Type:application/json" --data-raw "{\"timeline\":\"time duration in hours/days/months/LastWeek/LastMonth/Any\"}"
The command with both default and optional parameters can be specified in the following format:
curl -L -X POST "http://<eG Manager IP:Port>/api/eg/analytics/getUptimeForServers" -H "user:<eG username or domain/eG username>" -H "pwd:Base64 encoded password" -H "managerurl:http://<eG Manager IP:Port>" -H"Content-Type:application/json" --data-raw "{\"timeline\":\"time duration in hours/days/months/LastWeek/LastMonth/Any\",\"componentName\":\"Component Name\",\"componentType\":\"Component Type\"}"
Figure 2 shows an example and a sample output that retrieves the uptime of the components managed in the target environment during a chosen time duration using cURL. The cURL command with only the default parameter is used to retrieve the uptime of the components in Figure 2.
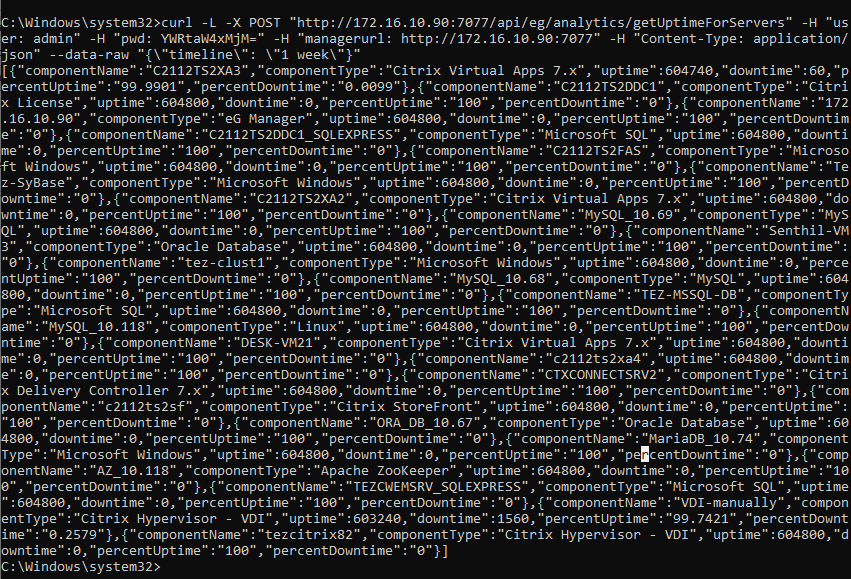
Figure 2 : An example cURL command to retrieve theuptime of components using cURL