Monitoring Boomi AtomSphere
eG Enterprise offers a special-purpose monitoring model for Boomi AtomSphere to monitor the status and overall performance of the target Boomi AtomSphere.
depicts the layer model of an Boomi AtomSphere.
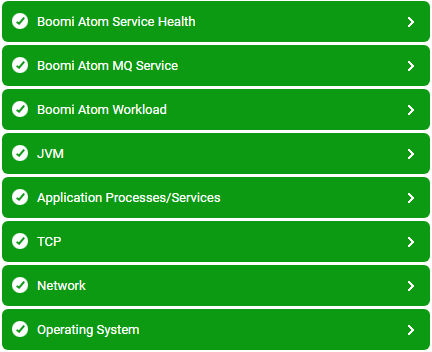
Figure 1 : Layer model for Boomi AtomSphere
Every layer in the is mapped to various tests to determine the critical statistics related to the performance of the target Boomi AtomSphere. Using the metrics reported by the tests, administrators can find accurate answers for the following performance queries:
- Are instances running in the target Boomi AtomSphere stopped, paused or restarted?
- Are instances running with low memory or out of memory?
- Were many warnings and errors noticed in Audit log?
- Were many documents processed with errors in the target Boomi AtomSphere?
- Were many failures noticed in Boomi execution process?
- Were many failures encountered during message download and upload processes?
- Is the time spent for the execution process in the target Boomi AtomSphere abnormal?
Since the Operating System, Application Processes/Services and TCP layers have been elaborately discussed in Monitoring Unix and Windows Servers document, the tests mapped to the Network layer have been elaborately discussed in Monitoring Cisco Router document and the tests mapped to the JVM layer have already been discussed in Monitoring Java Applications document, the sections to come will discuss the other layers in detail.