Chassis Fans Test
A Cisco Blade Server Chassis contains the following components:
- Cisco UCS Fabric Extenders—Up to two fabric extenders (FEX), each FEX provides four ports of 10-Gigabit Ethernet, Cisco Data Center Ethernet, and Fibre Channel over Ethernet (FCoE)
- SFP+ transceiver choices that include copper and fiber optic
- Power supply units—Up to four 2500 W hot-swappable power supply units
- Fan modules—Eight hot-swappable fan modules
- Cisco UCS Blade Servers —Up to eight half-wide blade servers or four full-width blade servers, each holding RAID capable hard drives
This test monitors the overall health of each fan present in each chassis managed by the Cisco UCS manager, and proactively alerts users to the following:
- Fans that are in an abnormal operational state;
- Fans that are in a critical performance/thermal/voltage state;
- Fans in a degraded/errored power state;
- Fans operating at abnormal speeds.
Target of the test : A Cisco UCS manager
Agent deploying the test : A remote agent
Outputs of the test : One set of results for each fan in each chassis managed by the Cisco UCS manager being monitored.
| Parameter | Description |
|---|---|
|
Test Period |
How often should the test be executed. |
|
Host |
The IP address of the host for which the test is being configured. |
|
Port |
The variable name of the port at which the specified host listens. |
|
UCS User and |
Provide the credentials of a user with at least read-only privileges to the target Cisco UCS manager. |
|
Confirm Password |
Confirm the password by retyping it here. |
|
SSL |
By default, the Cisco UCS manager is SSL-enabled. Accordingly, the SSL flag is set to Yes by default. |
|
Web Port |
By default, in most virtualized environments, Cisco UCS manager listens on port 80 (if not SSL-enabeld) or on port 443 (if SSL-enabled) only. This implies that while monitoring Cisco UCS manager, the eG agent, by default, connects to port 80 or 443, depending upon the SSL-enabled status of Cisco UCS manager - i.e., if Cisco UCS manager is not SSL-enabled (i.e., if the SSL flag above is set to No), then the eG agent connects to Cisco UCS manager using port 80 by default, and if Cisco UCS manager is SSL-enabled (i.e., if the SSL flag is set to Yes), then the agent-Cisco UCS manager communication occurs via port 443 by default. Accordingly, the WebPort parameter is set to default by default. In some environments however, the default ports 80 or 443 might not apply. In such a case, against the WebPort parameter, you can specify the exact port at which the Cisco UCS manager in your environment listens, so that the eG agent communicates with that port for collecting metrics from the Cisco UCS manager. |
|
Detailed Diagnosis |
To make diagnosis more efficient and accurate, the eG Enterprise embeds an optional detailed diagnostic capability. With this capability, the eG agents can be configured to run detailed, more elaborate tests as and when specific problems are detected. To enable the detailed diagnosis capability of this test for a particular server, choose the On option. To disable the capability, click on the Off option. The option to selectively enable/disable the detailed diagnosis capability will be available only if the following conditions are fulfilled:
|
| Measurement | Description | Measurement Unit | Interpretation | ||||||||||||||||||||||||||||||||||||||||||||||||||||||||
|---|---|---|---|---|---|---|---|---|---|---|---|---|---|---|---|---|---|---|---|---|---|---|---|---|---|---|---|---|---|---|---|---|---|---|---|---|---|---|---|---|---|---|---|---|---|---|---|---|---|---|---|---|---|---|---|---|---|---|---|
|
Overall status |
Indicates the overall status of this fan present in this chassis. |
|
The States reported by this measure and their corresponding numeric equivalents are described in the table below:
The detailed diagnosis of this measure provides the Time, ID, PID, Module, Revision, Serial Number, Tray and Vendor attributes for each fan in each chassis. |
||||||||||||||||||||||||||||||||||||||||||||||||||||||||
|
Operability |
Indicates the current operational state of this fan present in this chassis. |
|
The States reported by this measure and their corresponding numeric equivalents are described in the table below:
Note: By default, this measure reports the above-mentioned States while indicating the operability statusof a fan. However, in the graph of this measure, states will be represented using their corresponding numeric equivalents only. |
||||||||||||||||||||||||||||||||||||||||||||||||||||||||
|
Performance state |
Indicates the current performance status of this fan present in this chassis. |
|
The States reported by this measure and their corresponding numeric equivalents are described in the table below:
Note: By default, this measure reports the above-mentioned States while indicating the performance status of a fan. However, in the graph of this measure, states will be represented using the corresponding numeric equivalents only. |
||||||||||||||||||||||||||||||||||||||||||||||||||||||||
|
Power state |
Indicates the current power status of this fan present in this chassis. |
|
The States reported by this measure and their corresponding numeric equivalents are described in the table below:
Note: By default, this measure reports the above-mentioned States while indicating the power status of a fan. However, in the graph of this measure, states will be represented using their corresponding numeric equivalents only. |
||||||||||||||||||||||||||||||||||||||||||||||||||||||||
|
Presence state |
Indicates whether this fan currently exists in this chassis or not. |
|
The State values reported by this measure and their corresponding numeric equivalents are described in the table below:
Note: By default, this measure reports the above-mentioned States while indicating the current state of a fan. However, in the graph of this measure, states will be represented using their corresponding numeric equivalents only. |
||||||||||||||||||||||||||||||||||||||||||||||||||||||||
|
Thermal state |
Indicates the current thermal state of this fan present in this chassis. |
|
The State values reported by this measure and their corresponding numeric equivalents are described in the table below:
Note: By default, this measure reports the above-mentioned States while indicating the thermal state of a fan. However, in the graph of this measure, states will be represented using the corresponding numeric equivalents only. |
||||||||||||||||||||||||||||||||||||||||||||||||||||||||
|
Voltage state |
Indicates the current voltage state of this fan present in this chassis. |
|
The State values reported by this measure and their corresponding numeric equivalents are described in the table below:
Note: By default, this measure reports the above-mentioned States while indicating the voltage state of a fan. However, in the graph of this measure, states will be represented using their corresponding numeric equivalents only. |
||||||||||||||||||||||||||||||||||||||||||||||||||||||||
|
Speed |
Indicates the speed which this fan operates currently. |
RPM |
Ideally, the speed of the fans must be within normal limits. |
The detailed diagnosis of the Overall status measure reveals the Time, ID, PID, Module, Revision, Serial Number, Tray and Vendor attributes for each fan in each chassis.
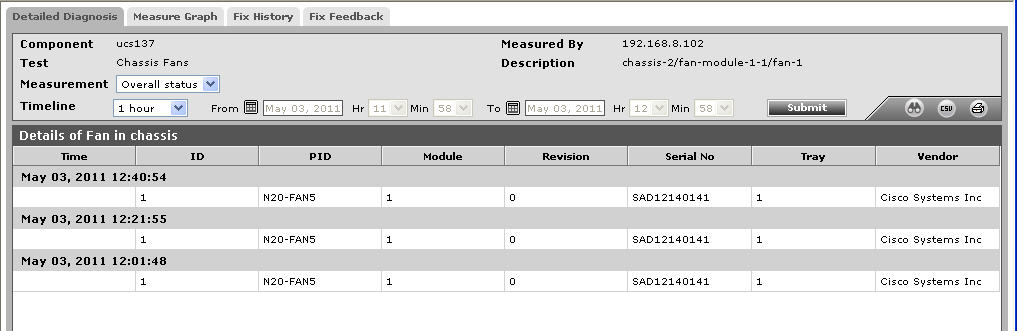
Figure 1 : The detailed diagnosis of the Overall status measure of the Chassis Fans test