Fabric Interconnect Details Test
Since fabric interconnects provide both network connectivity and management capabilities for the Cisco UCS system, an inoperable or resource-intensive fabric interconnect can shake the communication backbone for the blade servers and the blade server chassis of the system. Likewise, real and potential threats to the health of the interconnect hardware (eg., PSUs, mainboards, fans) can also result in significant latencies in network traffic flow over the interconnects. With the help of this test, you can keep track of the operational status and resource usage of the fabric interconnects, and also be alerted to sudden spikes in the temperature of the PSUs, mainboards, and fans supported by each interconnect.
Target of the test : A Cisco UCS manager
Agent deploying the test : A remote agent
Outputs of the test : One set of results for each fabric interconnect managed by the Cisco UCS manager being monitored.
| Parameter | Description |
|---|---|
|
Test Period |
How often should the test be executed. |
|
Host |
The IP address of the host for which the test is being configured. |
|
Port |
The variable name of the port at which the specified host listens. |
|
UCS User and |
Provide the credentials of a user with at least read-only privileges to the target Cisco UCS manager. |
|
Confirm Password |
Confirm the password by retyping it here. |
|
SSL |
By default, the Cisco UCS manager is SSL-enabled. Accordingly, the SSL flag is set to Yes by default. |
|
Web Port |
By default, in most virtualized environments, Cisco UCS manager listens on port 80 (if not SSL-enabeld) or on port 443 (if SSL-enabled) only. This implies that while monitoring Cisco UCS manager, the eG agent, by default, connects to port 80 or 443, depending upon the SSL-enabled status of Cisco UCS manager - i.e., if Cisco UCS manager is not SSL-enabled (i.e., if the SSL flag above is set to No), then the eG agent connects to Cisco UCS manager using port 80 by default, and if Cisco UCS manager is SSL-enabled (i.e., if the SSL flag is set to Yes), then the agent-Cisco UCS manager communication occurs via port 443 by default. Accordingly, the WebPort parameter is set to default by default. In some environments however, the default ports 80 or 443 might not apply. In such a case, against the WebPort parameter, you can specify the exact port at which the Cisco UCS manager in your environment listens, so that the eG agent communicates with that port for collecting metrics from the Cisco UCS manager. |
|
Detailed Diagnosis |
To make diagnosis more efficient and accurate, the eG Enterprise embeds an optional detailed diagnostic capability. With this capability, the eG agents can be configured to run detailed, more elaborate tests as and when specific problems are detected. To enable the detailed diagnosis capability of this test for a particular server, choose the On option. To disable the capability, click on the Off option. The option to selectively enable/disable the detailed diagnosis capability will be available only if the following conditions are fulfilled:
|
| Measurement | Description | Measurement Unit | Interpretation | ||||||||
|---|---|---|---|---|---|---|---|---|---|---|---|
|
Overall status |
Indicates the overall status of this fabric interconnect. |
|
The States reported by this measure and their corresponding numeric equivalents are described in the table below:
Note: By default, this measure reports the above-mentioned states while indicating the overall status of a fabric interconnect. However, in the graph of this measure, states will be represented using their corresponding numeric equivalents only. The detailed diagnosis of this measure provides the Time, Name, PID, Revision, Serial Number and Vendor attributes of each fabric interconnect. |
||||||||
|
Load |
Indicates the percentage of CPU utilized by this fabric interconnect. |
Percent |
A high value is indicative of excessive CPU usage, and is a cause for concern. |
||||||||
|
Available memory |
Indicates the amount of memory available with this fabric interconnect. |
MB |
A low value may indicate a memory bottleneck. |
||||||||
|
Cached memory |
Indicates the memory allotted for cache (frequently used main memory locations) in this fabric interconnect. |
MB |
|
||||||||
|
Total memory |
Indicates the total memory of this fabric interconnect. |
MB |
|||||||||
|
Fan control inlet1 |
Indicates the temperature of fan 1 of this fabric interconnect. |
Celsius |
A low value is desired for this measure. |
||||||||
|
Fan control inlet2 |
Indicates the temperature of fan 2 of this fabric interconnect. |
Celsius |
A low value is desired for this measure. |
||||||||
|
Fan control inlet3 |
Indicates the temperature of fan 3 of this fabric interconnect. |
Celsius |
A low value is desired for this measure. |
||||||||
|
Fan control inlet4 |
Indicates the temperature of fan 4 of this fabric interconnect. |
Celsius |
A low value is desired for this measure. |
||||||||
|
Mainboard outlet1 |
Indicates the temperature of the mainboard 1 of this fabric interconnect. |
Celsius |
A low value is desired for this measure. |
||||||||
|
Mainboard outlet2 |
Indicates the temperature of the mainboard 2 of this fabric interconnect. |
Celsius |
A low value is desired for this measure. |
||||||||
|
PSU control inlet1 |
Indicates the temperature of power supply unit 1 of this fabric interconnect. |
Celsius |
A low value is desired for this measure. |
||||||||
|
PSU control inlet2 |
Indicates the temperature of power supply unit 2 of this fabric interconnect. |
Celsius |
A low value is desired for this measure. |
The detailed diagnosis of the Overall status measure provides the Time, Name, PID, Revision, Serial Number and Vendor attributes of each fabric interconnect.
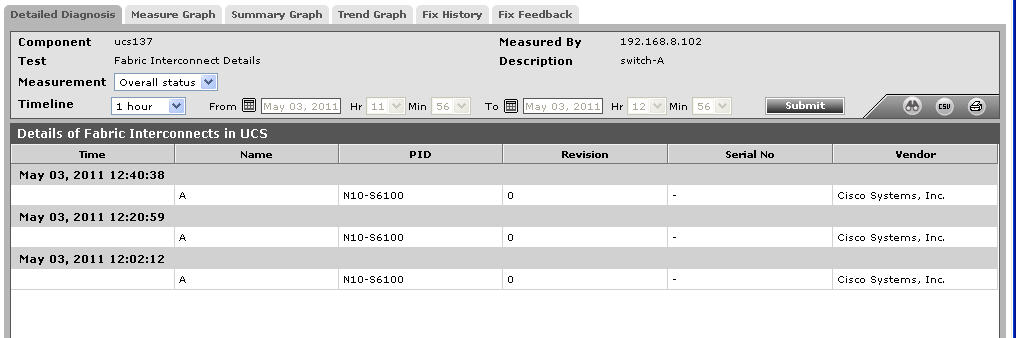
Figure 1 : The detailed diagnosis of the Overall status measure of the Fabric Interconnect Details test