LAN Cloud PC Ethernet Ports
You can aggregate a number of uplink ethernet ports by configuring them as a port channel, so traffic will forward between your upstream LAN switch and Cisco UCS fabric interconnect over the aggregate port channel ports as a single aggregated link.
This test auto-discovers the Ethernet ports aggregated in each port channel on every Fabric Interconnect and reports the overall health, operational speed, and VLAN status of each Ethernet port. With the help of this test, problematic and slow ports can be identified.
Target of the test : A Cisco UCS manager
Agent deploying the test : A remote agent
Outputs of the test : One set of results for each Ethernet port in each port channel configured on every fabric interconnect managed by the Cisco UCS manager being monitored.
| Parameter | Description |
|---|---|
|
Test Period |
How often should the test be executed |
|
Host |
The IP address of the host for which the test is being configured. |
|
Port |
The port at which the specified host listens. By default, this is NULL. |
|
UCS User and |
Provide the credentials of a user with at least read-only privileges to the target Cisco UCS manager. |
|
Confirm Password |
Confirm the password by retyping it here. |
|
SSL |
By default, the Cisco UCS manager is SSL-enabled. Accordingly, the SSL flag is set to Yes by default. |
|
Web Port |
By default, in most virtualized environments, Cisco UCS manager listens on port 80 (if not SSL-enabeld) or on port 443 (if SSL-enabled) only. This implies that while monitoring Cisco UCS manager, the eG agent, by default, connects to port 80 or 443, depending upon the SSL-enabled status of Cisco UCS manager - i.e., if Cisco UCS manager is not SSL-enabled (i.e., if the SSL flag above is set to No), then the eG agent connects to Cisco UCS manager using port 80 by default, and if Cisco UCS manager is SSL-enabled (i.e., if the SSL flag is set to Yes), then the agent-Cisco UCS manager communication occurs via port 443 by default. Accordingly, the WebPort parameter is set to default by default. In some environments however, the default ports 80 or 443 might not apply. In such a case, against the WebPort parameter, you can specify the exact port at which the Cisco UCS manager in your environment listens, so that the eG agent communicates with that port for collecting metrics from the Cisco UCS manager. |
|
Detailed Diagnosis |
To make diagnosis more efficient and accurate, the eG Enterprise embeds an optional detailed diagnostic capability. With this capability, the eG agents can be configured to run detailed, more elaborate tests as and when specific problems are detected. To enable the detailed diagnosis capability of this test for a particular server, choose the On option. To disable the capability, click on the Off option. The option to selectively enable/disable the detailed diagnosis capability will be available only if the following conditions are fulfilled:
|
| Measurement | Description | Measurement Unit | Interpretation | ||||||||||
|---|---|---|---|---|---|---|---|---|---|---|---|---|---|
|
Overall status |
Indicates the current overall status of this port. |
|
The values reported by this measure and their corresponding numeric values are described in the table below:
The detailed diagnosis of this measure provides the complete details of a port, such as, the ID of the port, the slot ID, the Fabric Interconnect for which the port has been configured, the Type, the Port type, the flow control policy, the transport, and the port, locale, and name. Note: By default, this measure reports the above-mentioned Measure Values while indicating the overall status of a port. However, in the graph of this measure, port status will be represented using their numeric equivalents only. |
||||||||||
|
Administrative state |
Indicates the current administrative status of this port. |
|
The values that this measure can report and the numeric values that correspond to the measure values have been detailed in the table below:
Note: By default, this measure reports the above-mentioned Measure Values while indicating the administrative status of a port. However, in the graph of this measure, states will be represented using the corresponding numeric equivalents only. |
The detailed diagnosis of the Overall status measure provides the complete details of a port, such as, the ID of the port, the slot ID, the Fabric Interconnect for which the port has been configured, the Type, the Port type, the flow control policy, the transport, and the port, locale, and name.
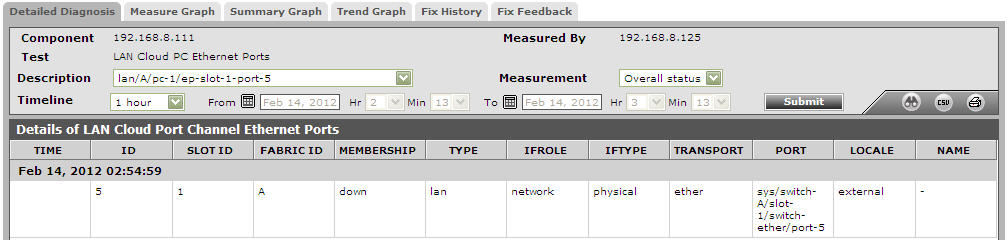
Figure 1 : The detailed diagnosis of the Overall Status measure of the LAN Cloud PC Ethernet Ports test