Web Servers Test
If users accessing a web server complain of slowness, administrators must be able to quickly figure out what is causing the slowness – is it because of a processing bottleneck with the web server? or is it owing to a latent server network? The Web Servers test accurately points administrators to the source of the slowness! This test tracks requests to each web server managed by ADM and reports the time every server takes to process the requests. The test thus sends out proactive alerts to administrators if it finds that any web server is responding very slowly to client requests. Additionally, the test also indicates if the slowdown experienced by the user can be attributed to a latent server-side network. This way, the test helps administrators identify slow servers and rapidly isolate the reason for the slowness, so that the problem can be fixed quickly and normalcy restored in no time.
Target of the test : Citrix ADM Web Insight
Agent deploying the test : A remote agent
Outputs of the test : One set of results for every web server managed by NetScaler ADC
| Parameter | Description |
|---|---|
|
Test period |
How often should the test be executed. It is recommended that you set the test period to 5 minutes. This is because, the Nitro API using which the eG agent collects metrics from Web Insight, is capable of capturing only the performance data related to the last 5 minutes. |
|
Host |
The host for which the test is to be configured. |
|
Insight Username, Insight password, and Confirm password |
To connect to Web Insight and collect the metrics it captures, the eG agent needs to be configured with the credentials of a user with read-only permissions to Web Insight. Type the name of this user against insight Username and the password of this user against Insight password. Then, confirm the password by retyping it in the Confirm password text box. |
|
SSL |
By default, Web Insight is not SSL-enabled. This is why, this flag is set to No by default. If it is SSL-enabled, then change this flag to Yes. |
|
DD Frequency |
Refers to the frequency with which detailed diagnosis measures are to be generated for this test. The default is 1:1. This indicates that, by default, detailed measures will be generated every time this test runs, and also every time the test detects a problem. You can modify this frequency, if you so desire. Also, if you intend to disable the detailed diagnosis capability for this test, you can do so by specifying none against DD Frequency. |
|
Detailed Diagnosis |
To make diagnosis more efficient and accurate, the eG Enterprise embeds an optional detailed diagnostic capability. With this capability, the eG agents can be configured to run detailed, more elaborate tests as and when specific problems are detected. To enable the detailed diagnosis capability of this test for a particular server, choose the On option. To disable the capability, click on the Off option. The option to selectively enable/disable the detailed diagnosis capability will be available only if the following conditions are fulfilled:
|
| Measurement | Description | Measurement Unit | Interpretation |
|---|---|---|---|
|
Hits |
Indicates the number of requests received by this web server. |
Number |
This is a good indicator of the load on the web server. Compare the value of this measure across web servers to know which server is receiving the maximum number of requests. If a single server appears to be servicing a significantly large number of requests than the rest, it could imply that the server is overloaded. This in turn indicates that a faulty/ineffective load-balancing algorithm is in use. Use the detailed diagnosis of this measure to know which NetScaler is managing this web server, so that the load-balancing logic of that NetScaler appliance can be reconfigured to avoid overloads. |
|
Avg bandwidth |
Indicates the total amount of data received by this web server. |
KB |
Compare the value of this measure across web servers to know which server is consuming bandwidth excessively. |
|
Server processing time |
Indicates the elapsed time, from when the server starts to receive the first byte of a request from the NetScaler appliance until the NetScaler appliance receives the first byte to response. |
msecs |
A high value for this measure indicates that the web server is processing requests slowly. Compare the value of this measure across web servers to isolate the slowest web server. In the event that a user complains of slowness, you can compare the value of this measure with that of the Server network latency measure to determine what is causing the slowness – the poor processing power of the web server? or a latent server network? |
|
Server network latency |
Indicates the average latency caused by the server network. |
msecs |
A high value for this measure indicates that the server network is latent. Compare the value of this measure across web servers to know which server’s network is the slowest. In the event that a user complains of slowness, you can compare the value of this measure with that of the Server processing time measure to determine what is causing the slowness – the poor processing power of the web server? or a latent server network? |
|
Cache hits |
Indicates the number of requests to this web server serviced by the cache. |
Number |
If the value of this measure is the same as that of the Hits measure, it implies that the web server has serviced all requests to it using the cache. This is indicative of optimal cache size and usage. On the other hand, if the value of this measure is much lower than that of the Hits measure, it could indicate improper cache sizing and ineffective cache usage. This measure will not be reported for Citrix NetScaler Insight versions lesser than v11.x. |
|
Cache miss |
Indicates the number of requests to this web server that were not serviced by the cache. |
Number |
Ideally, the value of this measure should be 0 or at least, very low. If the value is the same as that of the Hits measure, it could indicate improper cache sizing and ineffective cache usage. This measure will not be reported for Citrix NetScaler Insight versions lesser than v11.x. |
|
Cache hit ratio |
Indicates the percentage of requests to this web server that were serviced by the cache. |
Percent |
Ideally, the value of this measure should be > 80%. A low hit ratio on the other hand indicates that a majority of web requests were serviced by the origin server and not the cache server. This can significantly increase request processing time and related overheads. This measure will not be reported for Citrix NetScaler Insight versions lesser than v11.x. |
|
Cache bypass |
Indicates the number of requests that were serviced by the origin server, because the cache server was bypassed. |
Number |
This measure will not be reported for Citrix NetScaler Insight versions lesser than v11.x. |
|
Cache hits bandwidth consumed |
Indicates the bandwidth consumed when requests to this web server were serviced by the cache server. |
KB |
The difference between the value of the Avg bandwidth measure and this measure for a web server will reveal the bandwidth that may have been saved by request caching. Where cache is well-sized and used optimally, this difference will be high. You can compare this difference across web servers to know which web server is making the most effective use of the cache. This measure will not be reported for Citrix NetScaler Insight versions lesser than v11.x. |
|
Cache misses bandwidth consumed |
Indicates the bandwidth consumed when the cache server could not serve the requests to this web server. |
KB |
The difference between the value of this measure and the value of the Cache hits bandwidth consumed measure for a web server will reveal how much bandwidth was saved by cache hits. This measure will not be reported for Citrix NetScaler Insight versions lesser than v11.x. |
|
Cache bypass bandwidth consumed |
Indicates the bandwidth consumed when the cache server was bypassed and the request was served from this origin server. |
KB |
If the difference between the value of this measure and that of the Cache hits bandwidth consumed measure results in a ‘positive’ integer, it indicates that cache usage has saved considerable bandwidth. This measure will not be reported for Citrix NetScaler Insight versions lesser than v11.x. |
Use the detailed diagnosis of the Hits measure to know which NetScaler is managing this web server, so that the load-balancing logic of that NetScaler appliance can be reconfigured to avoid overloads.
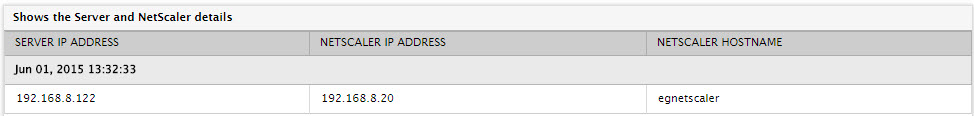
Figure 1 : The detailed diagnosis of the Hits measure of the Web Servers test