Kubernetes Monitoring - An Overview
A Kubernetes cluster is an orchestration platform designed to run containerized applications efficiently, ensuring scalability, high availability, and automated deployment. At its core, a cluster comprises a control plane/ master node and a set of worker nodes. The control plane is responsible for maintaining the cluster’s state, scheduling workloads, and managing communications between components. The worker nodes are the execution layer, each node hosts a container runtime such as Docker or CRI-O and is capable of running multiple pods, the smallest deployable units in Kubernetes that package one or more application containers. Supporting components like the Kubelet ensure communication between the control plane and nodes, while the Kube Proxy manages networking for seamless pod-to-pod and external connectivity. Kubernetes works by receiving deployment instructions via its API, scheduling workloads to suitable nodes, creating and running containers inside pods, and automatically scaling or replacing them to maintain the desired application state. This ensures high availability, optimal resource usage, and consistent application performance.
In some deployments, certain nodes are designated as infrastructure nodes to handle critical system services and monitoring workloads without interfering with application execution. The applications themselves are abstracted from the underlying hardware and run in these pods, distributed across nodes according to available resources and workload requirements. This layered architecture provides flexibility and resilience but also introduces complexity, making effective monitoring a necessity.
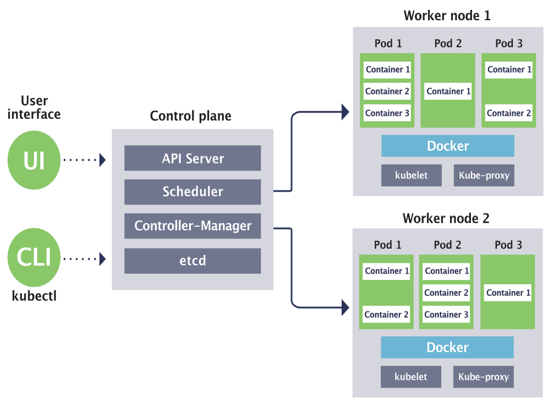
Figure 1 : Kubernetes Architecture
Why Monitoring Kubernetes is Essential?
While Kubernetes automates much of the operational overhead in container management, it does not eliminate the need for proactive visibility into cluster health. A seemingly minor issue, such as a single node experiencing resource exhaustion, can cascade into widespread service disruptions. Application failures, performance degradation, and unpredictable scaling behavior can all result from unmonitored bottlenecks.
Effective Kubernetes monitoring must therefore cover three critical tiers:
-
Cluster Tier- Monitors the availability and responsiveness of critical Kubernetes control plane services like the API Server and scheduler. Ensures cluster stability and prevents management disruptions.
-
Node Tier - Tracks resource usage and performance of master, worker, and infra nodes, including CPU, memory, disk, and network. Helps identify bottlenecks and prevent node failures.
-
Application Tier - Observing the status, performance, and reliability of pods and containers, ensuring that services meet performance expectations.
Without visibility across all three, administrators may be forced into reactive firefighting rather than strategic, proactive management.
eG Enterprise Kubernetes Monitoring
eG Enterprise delivers comprehensive visibility into Kubernetes environments, monitoring everything from clusters and nodes to containerized applications. Its unified approach ensures proactive issue detection, optimized performance, and simplified management across the entire stack.
-
eG Enterprise monitors Kubernetes clusters in an agentless manner through a remote agent that connects via the cluster’s API endpoint (Cluster URL). This provides complete visibility into overall cluster health, resource capacity, and workload distribution. For more details on this, refer to,
-
Within a Kubernetes cluster, each node is treated as a monitored machine. eG Enterprise monitors nodes using an agent-based approach, allowing administrators to track node availability, performance, and container runtime health.
-
Applications run as pods across the nodes. Using eG Enterprise’s internal agent assignment technique, pods are monitored in detail. Metrics from Kubernetes APIs, kube-state-metrics, and container runtimes provide deep insights into application performance and help identify issues before they impact end-users. To know more. refer to
Licensing Requirements for Kubernetes Monitoring
Each component of the Kubernetes environment consumes licenses based on how it is monitored:
-
Cluster - Consumes one Premium License per cluster monitored via remote agent.
-
Node - Consumes one Premium License per node when monitored using the agent-based approach.
The same license can also be used to monitor up to 5 containerized applications on that node for free.
For example: 3 master + 5 worker nodes = 8 Premium Licenses.
-
Container Applications - Consume a Container App License, when application-level metrics are collected from pods using internal agent assignment.
The first 5 applications per node are monitored for free. From the 6th application onward, 1 Container App License is required per application.
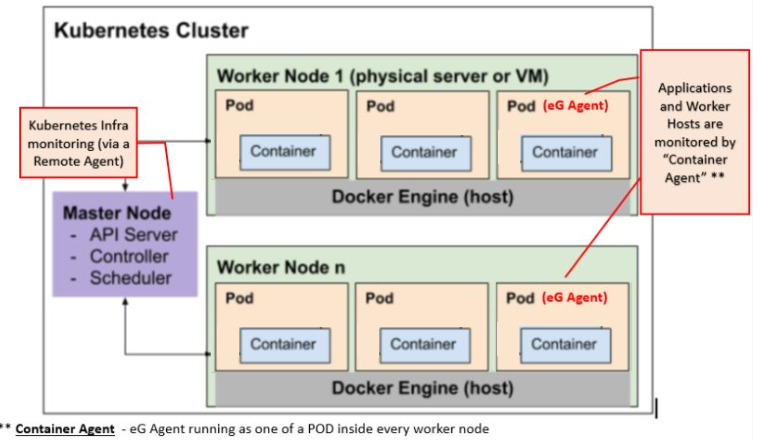
Figure 2 : eG Agent Deployment Across Kubernetes Cluster
eG Enterprise collects metrics from multiple data sources - including Kubernetes APIs, kube-state-metrics, and container runtime statistics - to provide insights into cluster capacity, workload distribution, node availability, and application health. This holistic approach ensures that issues can be detected and resolved before they impact service delivery.
eG Enterprise offers two installation options for Kubernetes monitoring, Full-Stack Monitoring and Selective Monitoring.
-
Kubernetes Full-stack Monitoring is an installation option that enables comprehensive monitoring of Kubernetes clusters, nodes, and containerized applications. It automates the deployment of monitoring components across the entire Kubernetes ecosystem.
Kubernetes full-stack monitoring provides flexible deployment options to accommodate different operational preferences. It supports both:
-
Helm-based deployment: Installs monitoring components using Helm charts, providing a templated and streamlined installation process ideal for quicker setups.
-
Manifest (YAML) deployment: Deploys monitoring components through native Kubernetes YAML files and includes the eG Universal Agent Operator for automated lifecycle management.
These methods enable teams to select the approach that best aligns with their workflow and expertise.
Kubernetes Full-stack Monitoring utilizes the eG Innovations Universal Agent Operator (a Kubernetes Operator) to :
-
Automate agent deployment with the Kubernetes Operator
-
Enable automatic instrumentation and zero-code changes for application monitoring
-
Provide full-stack visibility across infrastructure and applications
-
-
Selective Monitoring - Allows users to target specific Kubernetes components for monitoring, such as clusters, nodes, or individual namespaces, based on their preferences. Unlike K8s Fullstack Monitoring, it does not require an operator and instead deploys a DaemonSet on selected nodes for monitoring. This option utilizes the Kubernetes DaemonSet to:
-
Automated agent deployment across all the nodes.
-
Zero-code change for instrumentation - just by adding env vars in application YAML file.
-
To learn more about monitoring Kubernetes clusters and worker nodes using Full-Stack and Selective Monitoring, refer to
Auto-Discovery and Auto-Management
Kubernetes environments are highly dynamic - applications, pods, and containers are constantly created, scaled, and terminated. Manual tracking of these changes is nearly impossible and prone to errors. Hence, eG Enterprise offers auto-discovery and auto-management capabilities that automatically detect and monitor all cluster components in real time, eliminate manual effort, ensure seamless multi-tenant support, and guarantee full monitoring coverage even in fast-changing environments.
Supported Kubernetes Variants and Distributions
Kubernetes has become the standard for orchestrating containerized workloads. Modern containerized applications run on a variety of Kubernetes-based platforms, ranging from upstream Kubernetes deployments to managed cloud services and vendor-specific distributions. This includes:
-
Kubernetes - The open-source core orchestrator.
-
OpenShift (RedHat OCP) - Red Hat’s enterprise-grade Kubernetes distribution with built-in CI/CD, developer tools, and enhanced security.
-
VMware vSphere Kubernetes Service- A Kubernetes distribution with strong integration into VMware vSphere and Cluster API.
-
Rancher- A Kubernetes management platform that simplifies multi-cluster management.
-
Azure Kubernetes Service (AKS ) - A fully managed Kubernetes service from Microsoft Azure.
-
Amazon Elastic Kubernetes Service (EKS) - A fully managed Kubernetes service from AWS.
-
Google Kubernetes Engine (GKE) – A managed Kubernetes service from Google Cloud.
-
Naver Cloud Kubernetes Service (NKS) – A managed Kubernetes offering from Naver Cloud Platform.
-
IBM Kubernetes Service – A managed Kubernetes platform hosted on IBM Cloud.
Although each has its own management tools, APIs, and integrations, they share the same core orchestration engine - Kubernetes - and thus share a common monitoring framework.
Why a Unified Monitoring Model?
Regardless of the Kubernetes variant or hosting environment, the core objectives of monitoring, ensuring performance, availability, and reliability, remain unchanged. A unified monitoring model standardizes visibility across diverse deployments, enabling administrators to proactively detect, diagnose, and resolve issues before they impact end users. This approach:
-
Provides a single pane of glass for multi-platform Kubernetes environments.
-
Reduces operational complexity for hybrid or multi-cloud deployments.
-
Enables faster problem detection and resolution by applying standardized metrics across platforms.
-
Ensures consistency in alerting, reporting, and performance baselines.
Unified Monitoring Model with eG Enterprise
Kubernetes environments are dynamic and distributed, making it challenging for administrators to gain complete visibility into performance across clusters, nodes, workloads, and applications. Traditional tools often focus on isolated layers, leading to fragmented insights and slower problem resolution.
With eG Enterprise’s unified monitoring model, organizations get a single, correlated view of their entire Kubernetes ecosystem - control plane, worker nodes, networking, storage, and application tiers. By automatically mapping dependencies and correlating events across all layers, eG Enterprise ensures that performance issues are detected early, their root causes are identified accurately, and remediation is accelerated. This holistic approach not only reduces downtime but also optimizes resource usage, delivering consistent service quality in even the most complex Kubernetes deployments.
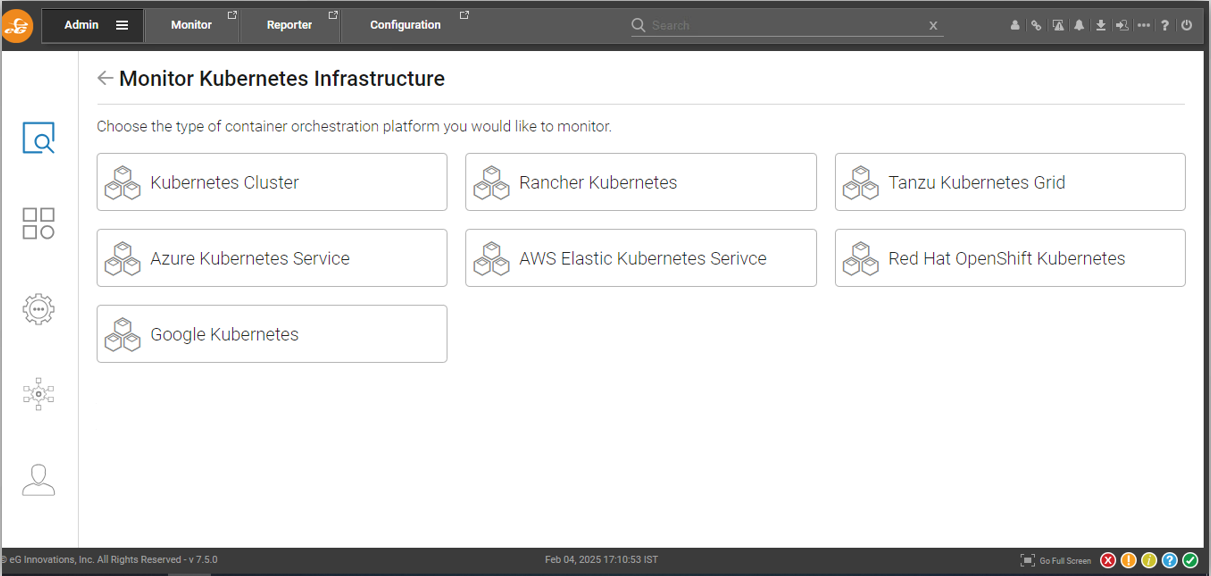
Figure 3 : eG Enterprise monitoring across multiple Kubernetes platforms.
eG's unified monitoring model for Kubernetes and its variants enables administrators to:
-
Detect and resolve performance bottlenecks before they affect applications.
-
Maintain visibility across on-premises, hybrid, and multi-cloud deployments.
-
Apply consistent monitoring, alerting, and reporting, regardless of platform.
-
Reduce training needs by standardizing monitoring workflows.
This unified approach ensures that your organization can scale containerized applications efficiently while maintaining reliability and performance, whether running in a private data center, a public cloud, or both. For detailed setup and configuration guidelines, refer to the corresponding platform-specific documentation:
Kubernetes Cluster Overview: Roles of Master and Worker Nodes
An Introduction to Rancher Kubernetes
Introduction to VMware vSphere Kubernetes Service (VKS)
Understanding Azure Kubernetes Service and AKS Worker Nodes
An overview of Amazon Elastic Kubernetes Service (EKS)