Monitoring the EMC VNXe Storage system
eG Enterprise offers a specialized EMC VNXe monitoring model that monitors the core functions and components of the EMC VNXe storage system, and proactively alerts administrators to issues in its overall performance and its critical operations, so that the holes are plugged before any data loss occurs.

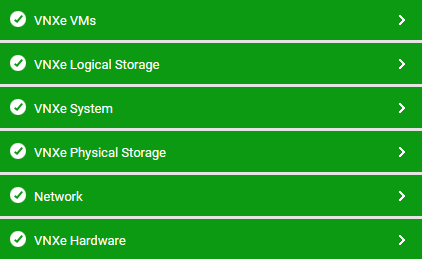
Figure 1 : The layer model of the EMC VNXe Storage system
Each layer of this model is mapped to tests that monitor a critical component of the device such as the disks, the LUNs, the storage processors, etc
Once the pre-requisites discussed in Pre-requisites for Monitoring EMC VNXe Storage system are fulfilled, the eG agent will extract useful statistics from the storage system and report it to the eG manager.
Using these metrics, the following critical performance queries can be answered:
- What is the current health of each battery in the Battery Backup Unit? Which batteries are currently unhealthy?
- How many cache clean pages are available in each storage processor?
- How many free cache pages are available in each storage processor?
- How well the read and write requests to each storage processor were serviced by the cache?
- How well the I/O operations were performed using the CIFS protocol on each storage processor?
- How well bandwidth was consumed when CIFS reads and writes are performed on each storage processor?
- How well the I/O Operation were performed on each disk ?
- Which disk was performing too much of I/O operations?
- What is the average time taken by each disk to service user requests?
- What is the maximum time taken by each disk to service user requests?
- What is the average time taken by the disk to respond to user requests?
- What is the current health of each Disk Processor Enclosure?
- What is the current health of each disk?
- What is the amount of disk space allocated to the users accessing each disk?
- What is the health of each storage processor port and management port of each storage processor?
- How well data was sent through and received by each storage processor port and management port of each storage processor?
- What is the maximum amount of packets sent through the storage processor port and management port per second?
- How many warning and critical events were generated for the target storage system?
- What is the current health of each fan? Which fan is currently unhealthy or has failed?
- What is the current health of each Fiber Channel Port?
- How well I/O operations were performed through each Fiber Channel Port?
- What is the amount of data sent through and received by each Fiber Channel Port per second?
- What is the current health of each host connected to the target storage system?
- What is the current health of each initiator?
- What is the current health of each I/O module?
- What is the current health of each iSCSI port? Which port is currently unhealthy or has failed critically?
- What is the current health of each LUN?
- How well data was read from and written to each LUN per second?
- What is the average time taken by each LUN to respond to user requests?
- What is the current health of each memory module?
- How well I/O operations were performed using the NFS protocol on each storage processor?
- What is the total amount of data transacted per second when performing NFS reads and writes?
- What is the current health of each power supply unit?
- What is the current health of each SAS port?
- What is the current health of each SSD on the target storage system?
- What is the current health of each storage pool?
- What is the current health of each storage processor?
- Has the storage processor rebooted recently?
- What is the current temperature of each storage processor?
- What is the current size of the memory allocated to each storage processor?
- What is the total capacity of each disk group?
- How many drives are available in each disk group?
- How many spare drives are available for each disk group?
- What is the health of each VM that is provisioned through the target storage system?