PAN Resources Test
This test provides useful insights into the type of resources available to the PAN manager and the amount of resources of each type that has been configured for the PAN manager.
Target of the test : An Egenera PAN Manager
Agent deploying the test : A remote agent
Outputs of the test : One set of results for the PAN manager being monitored.
| Parameter | Description |
|---|---|
|
Test Period |
How often should the test be executed. |
|
Host |
The IP address of the Egenera PAN Manager for which this test is to be configured. |
|
PAN Manager User, PAN Manager Password, and Confirm Password |
To monitor the Egenera PAN Manager, the eG agent has to be configured with administrator privileges. This is why, you need to specify the credentials of an administrator against the PAN Manager User and PAN Manager Password parameters of this test. Confirm the pan manager password by retyping it in the Confirm Password text box. |
|
SSL |
By default, the Egenera PAN Manager is not SSL-enabled. Accordingly, the SSL flag is set to No by default. |
|
PAN Manager Webport |
By default, in most environments, the Egenera PAN Manager listens on port 80 (if not SSL-enabled) or on port 443 (if SSL-enabled) only. This implies that while monitoring the Egenera PAN Manager, the eG agent, by default, connects to port 80 or 443, depending upon the SSL-enabled status of Egenera PAN Manager - i.e., if Egenera PAN Manager is not SSL-enabled (i.e., if the SSL flag above is set to No), then the eG agent connects to Egenera PAN Manager using port 80 by default, and if Egenera PAN Manager is SSL-enabled (i.e., if the SSL flag is set to Yes), then the agent-Egenera PAN Manager communication occurs via port 443 by default. Accordingly, the PAN Manager Webport parameter is set to default by default. In some environments however, the default ports 80 or 443 might not apply. In such a case, against the PAN Manager Webport parameter, you can specify the exact port at which the Egenera PAN Manager in your environment listens, so that the eG agent communicates with that port for collecting metrics from the Egenera PAN Manager. |
|
Detailed Diagnosis |
To make diagnosis more efficient and accurate, the eG Enterprise embeds an optional detailed diagnostic capability. With this capability, the eG agents can be configured to run detailed, more elaborate tests as and when specific problems are detected. To enable the detailed diagnosis capability of this test for a particular server, choose the On option. To disable the capability, click on the Off option. The option to selectively enabled/disable the detailed diagnosis capability will be available only if the following conditions are fulfilled:
|
| Measurement | Description | Measurement Unit | Interpretation |
|---|---|---|---|
|
Processing nodes |
Indicates the total number of pNodes in this PAN Manager. |
Number |
The PAN architecture was designed around simplifying pServer management and monitoring. A pServer is a logical server that possesses all the resources of a conventional server, but which is not tied to a specific processing resource. In PAN Manager, these processing resources are called Processing Nodes, or simply pNodes. |
|
Pools |
Indicates the total number of global pools available in this PAN Manager. |
Number |
A pool consists of one or more pNodes that can be used as primary pNodes or failover pNodes for pServers. The detailed diagnosis of this measure lists out the name of the pools and the number of pNodes available in each pool. |
|
Uplinks |
Indicates the total number of uplinks allocated in this PAN Manager. |
Number |
An uplink is a PAN Manager resource that is the logical grouping of physical ports on the uplink module. The detailed diagnosis capability of this measure if enabled, lists out the name of the uplinks and the type of each uplink available in this PAN Manager. |
|
Virtual switches |
Indicates the total number of vSwitches currently available in this PAN Manager. |
Number |
A vSwitch (Virtual Switch) is a logical representation of a physical switch - this network resource connects an uplink to a pServer. |
|
Media image |
Indicates the total number of media images that are currently available in this PAN Manager. |
Number |
A media image is an ISO Image that you register with PAN Manager for use in the VCD of a pServer. The detailed diagnosis capability of this measure if enabled, lists out the name of the media images available in this PAN Manager. |
|
MACs |
Indicates the total number of MAC addresses that are allocated to this PAN Manager. |
Number |
The Media Access Control (MAC) Address is a hardware address that uniquely identifies a component in an Ethernet network. In PAN Manager, each pServer vNIC has a unique MAC address. |
|
WWNs |
Indicates the total number of WWNs (World Wide Names) that are currently allocated to this PAN Manager. |
Number |
A WWN (World Wide Number) is a hardware address that uniquely identifies a target in a Storage Area Network. In PAN Manager, you assign WWNs to LPANs after which you use a vHBA to assign WWNs to a pServer. |
|
|
vLans Indicates the total number of VLANs that are currently allocated to this PAN Manager. |
Number |
A vLAN refers to a Virtual LAN. It is a standard, trunk-forwarding network protocol. In the PAN manager, VLANs are used on different levels by different PAN entities:
|
The detailed diagnosis capability of the Uplinks measure if enabled, lists out the name of the uplinks and the type of each uplink available in this PAN Manager.
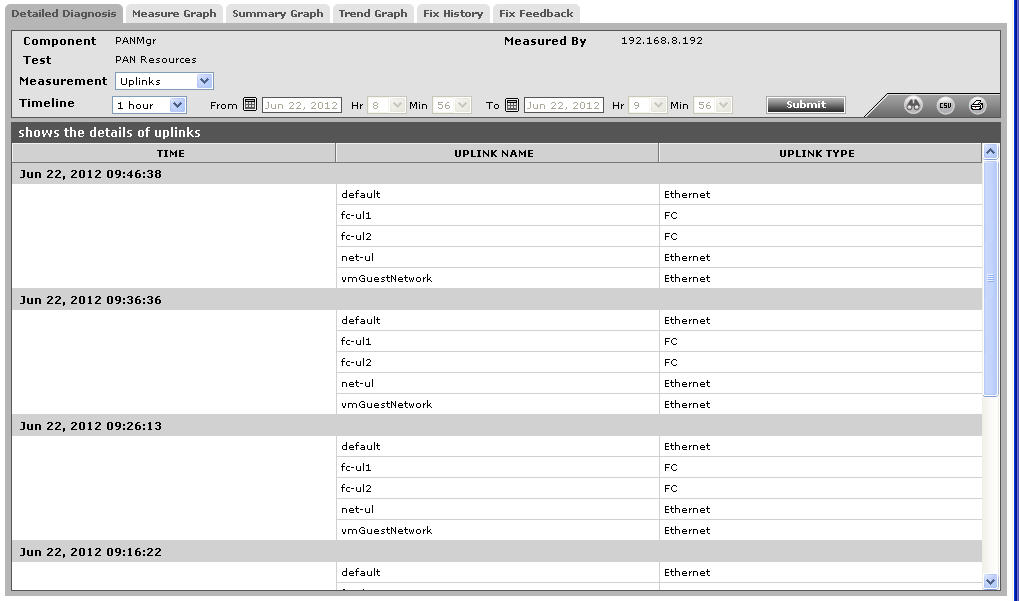
Figure 1 : The detailed diagnosis of the Uplinks measure
The detailed diagnosis capability of the Media image measure if enabled, lists out the name of the media images available in this PAN Manager.
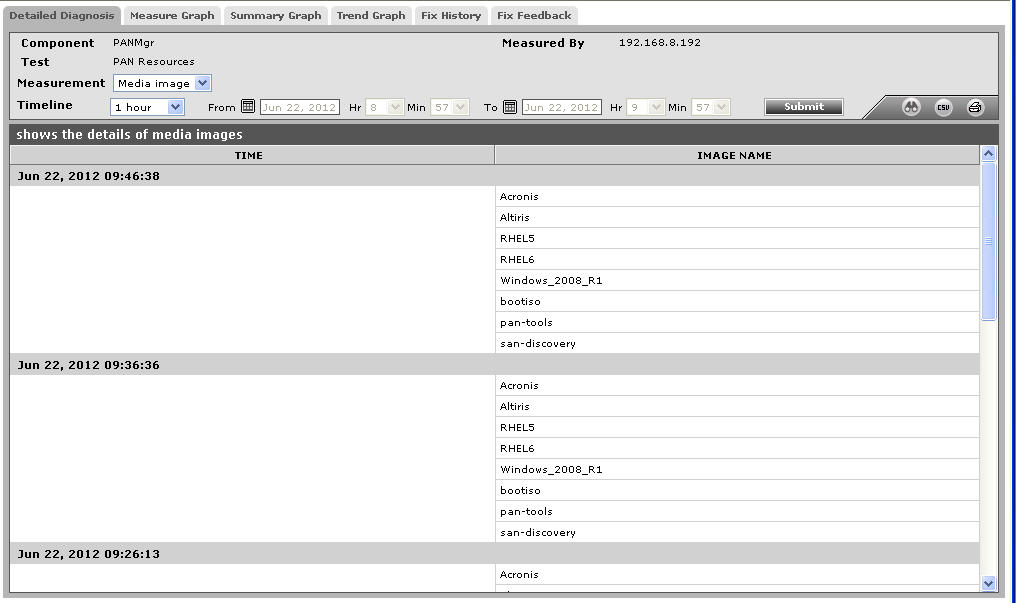
Figure 2 : The detailed diagnosis of the Media image measure