PAN Virtual Switch Details Test
The virtual switch created by PAN Manager functions just like a physical switch. A vSwitch is designated for either network (Ethernet) or storage traffic (Fibre Channel), but cannot be used for both. PAN Manager supports two types of Ethernet vSwitches:
- Uplinked vSwitch: The Ethernet vSwitch associated with a network uplink, which provides external connectivity. An uplinked Ethernet vSwitch must have a VLAN ID configured on the premises network and can be enabled for link dependency.
- Non-uplinked vSwitch: The Ethernet vSwitch that provides internal connectivity between pServers. A non-uplinked Ethernet vSwitch should use a VLAN ID already added to PAN Manager.
Normally, pServers are connected to the pNodes using vSwitches. This test auto-discovers the vSwitches in a PAN network and reports the following:
- The type of each vSwitch;
- What is the uplink status of every vSwitch? Is link dependancy capability is enabled for this vSwitch?
- How many LPANS are allocated to each vSwitch?
- How many pServers are connected through every vSwitch and what is the VLAN ID of each connection?
Target of the test : An Egenera PAN Manager
Agent deploying the test : A remote agent
Outputs of the test : One set of results for each vSwitch in a PAN domain.
| Parameter | Description |
|---|---|
|
Test Period |
How often should the test be executed. |
|
Host |
The IP address of the Egenera PAN Manager for which this test is to be configured. |
|
PAN Manager User, PAN Manager Password, and Confirm Password |
To monitor the Egenera PAN Manager, the eG agent has to be configured with administrator privileges. This is why, you need to specify the credentials of an administrator against the PAN Manager User and PAN Manager Password parameters of this test. Confirm the pan manager password by retyping it in the Confirm Password text box. |
|
SSL |
By default, the Egenera PAN Manager is not SSL-enabled. Accordingly, the SSL flag is set to No by default. |
|
PAN Manager Webport |
By default, in most environments, the Egenera PAN Manager listens on port 80 (if not SSL-enabled) or on port 443 (if SSL-enabled) only. This implies that while monitoring the Egenera PAN Manager, the eG agent, by default, connects to port 80 or 443, depending upon the SSL-enabled status of Egenera PAN Manager - i.e., if Egenera PAN Manager is not SSL-enabled (i.e., if the SSL flag above is set to No), then the eG agent connects to Egenera PAN Manager using port 80 by default, and if Egenera PAN Manager is SSL-enabled (i.e., if the SSL flag is set to Yes), then the agent-Egenera PAN Manager communication occurs via port 443 by default. Accordingly, the PAN Manager Webport parameter is set to default by default. In some environments however, the default ports 80 or 443 might not apply. In such a case, against the PAN Manager Webport parameter, you can specify the exact port at which the Egenera PAN Manager in your environment listens, so that the eG agent communicates with that port for collecting metrics from the Egenera PAN Manager. |
|
Detailed Diagnosis |
To make diagnosis more efficient and accurate, the eG Enterprise embeds an optional detailed diagnostic capability. With this capability, the eG agents can be configured to run detailed, more elaborate tests as and when specific problems are detected. To enable the detailed diagnosis capability of this test for a particular server, choose the On option. To disable the capability, click on the Off option. The option to selectively enabled/disable the detailed diagnosis capability will be available only if the following conditions are fulfilled:
|
| Measurement | Description | Measurement Unit | Interpretation | ||||||
|---|---|---|---|---|---|---|---|---|---|
|
Type |
Indicates the type of this switch. |
|
This measure reports Ethernet or Fibre Channel based on the type of the vSwitch. The numeric values that correspond to the above-mentioned types are as follows:
Note: By default, this measure reports the above-mentioned Types while indicating the type of the vSwitch. However, in the graph of this measure, the switch type will be represented using the corresponding numeric equivalents i.e., 1 or 2. |
||||||
|
Is uplink attached? |
Indicates whether/not this vSwitch is uplinked. |
|
An uplink is a collection of one or more ports bound together into a single entity that connects to external switches for either Ethernet (network) or Fibre Channel (storage) connectivity. This measure reports a value Uplinked if this vSwitch is uplinked and a value Not uplinked if otherwise. The numeric values that correspond to the above-mentioned values are as follows:
Note: By default, this measure reports the above-mentioned Measure Values while indicating whether/not this vSwitch is uplinked. However, in the graph of this measure, the same will be represented using the corresponding numeric equivalents i.e., 0 or 1. The detailed diagnosis capability of this measure, if enabled, lists out the NAME OF THE UPLINK to which this vSwitch is uplinked. |
||||||
|
Link dependency |
Indicates whether/not the link dependancy is enabled on this vSwitch. |
|
PAN Manager supports link dependency, a feature of a physical switch (usually an edge switch) that reflects the state of the switch's uplink port(s) to the downlink ports. In PAN Manager, you enable/disable link dependency on a vSwitch. If a disruption in network connectivity that is external to the PAN occurs, the bonding/teaming software in the pServer's operating system redirects network traffic over the pServer's other available path to the external network. This measure reports a value On if link dependancy is enabled on this vSwitch and a value Off if the link dependancy is disabled. The numeric values that correspond to the above-mentioned measure values are as follows:
Note: By default, this measure reports the above-mentioned Measure Values while indicating whether/not the link dependancy is enabled on this vSwitch. However, in the graph of this measure, the same will be represented using the corresponding numeric equivalents i.e., 0 or 1. |
||||||
|
Vlan ID |
Indicates the VLAN ID through which this vSwitch is connected to the pServer. |
Number |
|
||||||
|
LPANS allocated |
Indicates the total number of LPANS to allocated to this vSwitch. |
Number |
LPANs consist of isolated groups of PAN and external hardware resources. They include resources and pServers that remain logically separate from the other resources of the PAN. The detailed diagnosis capability of this measure, if enabled lists out the NAME OF THE LPANs to which this vSwitch is allocated. |
||||||
|
Number of pServers attached |
Indicates the total number of pServers that are connected through this vSwitch. |
Number |
The detailed diagnosis capability of this measure, if enabled lists out the NAME OF THE LPAN, the PSERVER NAME and the VSWITCH TYPE. |
The detailed diagnosis capability of the LPANS Allocated measure, if enabled, lists out the NAME OF THE LPANs to which this vSwitch is allocated.
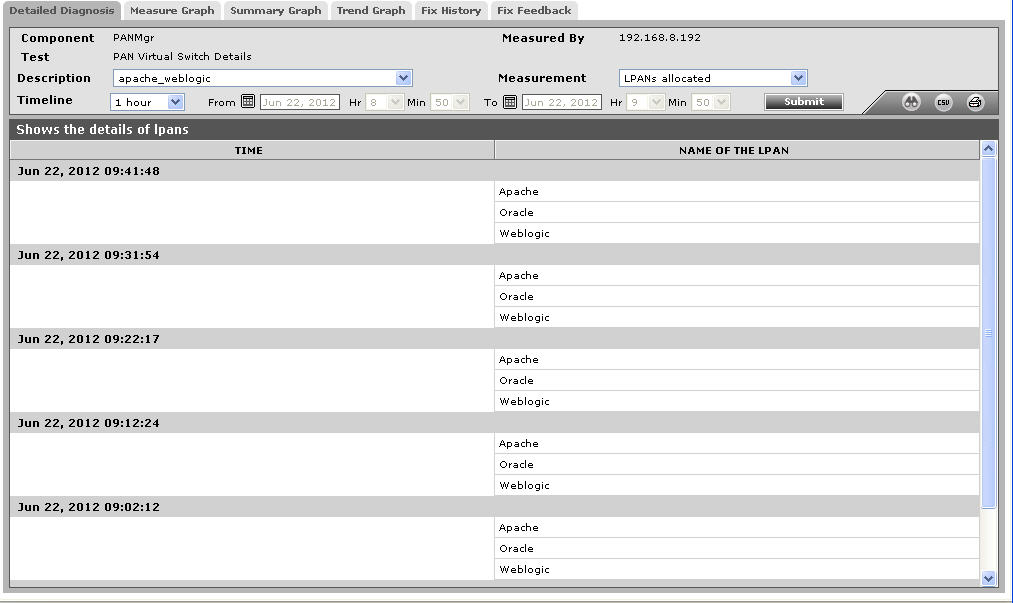
Figure 1 : The detailed diagnosis of the LPANS allocated measure
The detailed diagnosis capability of the Number of pServers attached measure, if enabled lists out the NAME OF THE LPAN, the PSERVER NAME and the VSWITCH TYPE.
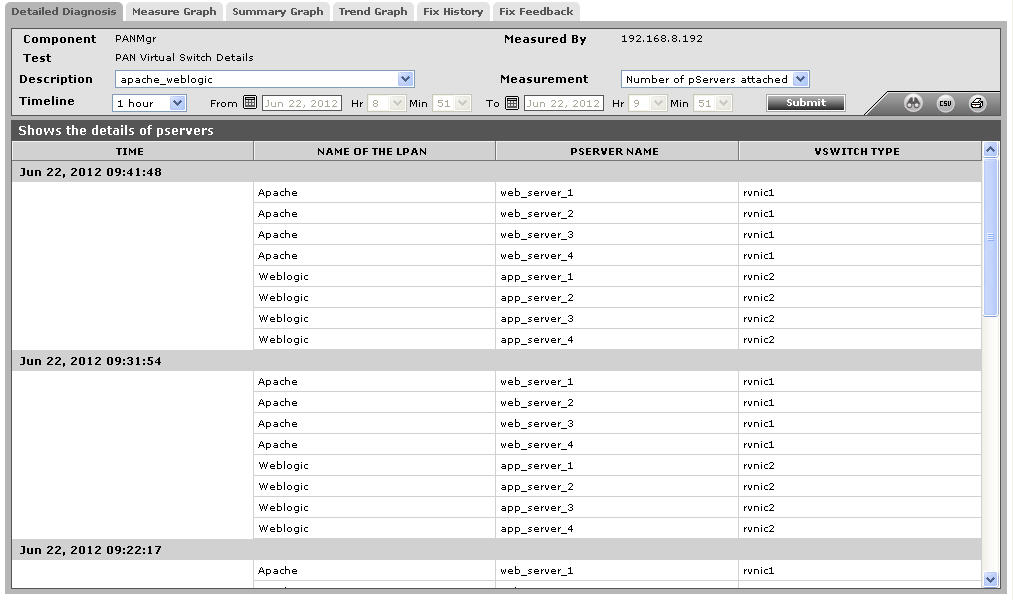
Figure 2 : The detailed diagnosis of the Number of pServers attached measure
