Multi-Host TCP Ports Test
Using this test, administrators can determine whether the target IP address is able to send requests or receive responses through different TCP ports of multiple systems. This test tracks the configured ports and reveals the availability and response time of the TCP ports from an external perspective.
Target of the test : A host server
Agent deploying the test : An external agent
Outputs of the test : One set of results for the target host server that hosts web applications/services.
| Parameter | Description |
|---|---|
|
Test Period |
How often should the test be executed. |
|
Host |
Specify the IP address of the host server in this text box. |
|
Port |
Enter the port number to which the specified host listens. |
|
Targets |
In this text box, specify a comma-separated list of IP address:port number pairs. While the name is just a display name, the port refers to the port to be monitored. This specification will ensure that the test connects to TCP ports on multiple IP addresses. For example - 192.168.9.86:7077,192.168.8.122:4443 |
|
Timeout |
Here, specify the maximum duration (in seconds) for which the test will wait for a response from the server. The default Timeout period is 60 seconds. |
|
Detailed Diagnosis |
To make diagnosis more efficient and accurate, the eG Enterprise embeds an optional detailed diagnostic capability. With this capability, the eG agents can be configured to run detailed, more elaborate tests as and when specific problems are detected. To enable the detailed diagnosis capability of this test for a particular server, choose the On option. To disable the capability, click on the Off option. The option to selectively enable/disable the detailed diagnosis capability will be available only if the following conditions are fulfilled:
|
| Measurement | Description | Measurement Unit | Interpretation |
|---|---|---|---|
|
Average availability |
Indicates the average percentage of TCP connection availability to the host system. |
Percent |
An availability problem can be caused by different factors - e.g., the server process may not be up, a network problem may exist, or there could be a configuration problem with the DNS server. The detailed diagnosis of this measure reveals the IP address and port number of each target server. In addition, administrators can find out whether each port is available for transmission or not. |
|
Average response time |
Indicates the average time taken (in seconds) by the server to respond to the requests through the configured ports. |
Seconds |
An increase in response time can be caused by several factors such as a server bottleneck, a configuration problem with the DNS server, a network problem, etc. The detailed diagnosis of this measure reveals the IP address and port number of each target server. In addition, administrators can find out how long each port took to respond to the requests. |
Use the detailed diagnosis of the Average availability measure to find out the IP address and port number of each target IP address. In addition, administrators can find out whether each port is available for transmission or not.
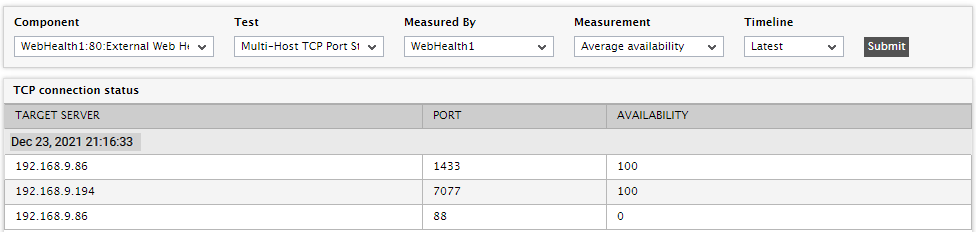
Figure 1 : The detailed diagnosis reported by the Average packet loss measure
Use the detailed diagnosis of the Average response time measure to find out IP address and port number of each target server. In addition, administrators can find out how long each port took to respond to the requests.
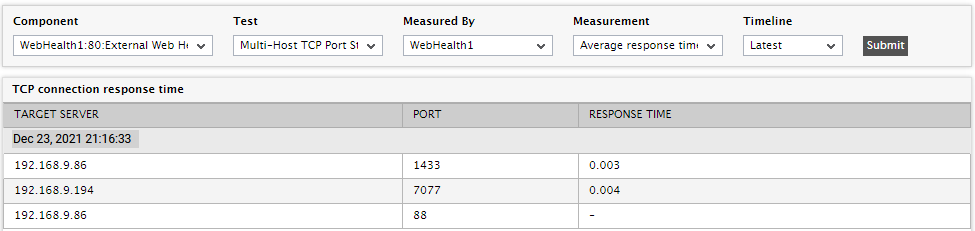
Figure 2 : The detailed diagnosis reported by the Average response time measure