Monitoring the F5 BIG-IP LTM Analytics
Since application delivery delays, inefficiencies in traffic flow, and failures can cause prolonged service outages, and affect the user experience with the application thus costing an enterprise money and reputation, it is imperative to monitor the Analytics module of the F5 traffic manager. To ensure this, eG Enterprise provides a specialized F5 Analytics monitoring model.
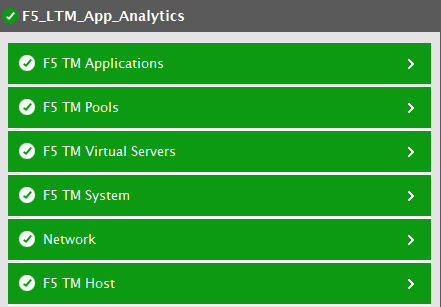
Figure 1 : Layer model of the F5 BIG-IP LTM Analytics
Each layer of Figure 1 is mapped to a variety of tests that provide valuable insights into the overall performance of the F5 Traffic Manager when the Analytics module is enabled. With the help of the metrics reported by these tests, administrators can find quick and accurate answers for the following queries:
- How well the I/O operations were performed on each disk of the target F5 Traffic manager?
- What is the average read latency of each disk of the target F5 Traffic manager?
- What is the average percentage of data serviced by the RAM cache?
- What is the percentage of data removed from the RAM cache?
- How many connections are active to the traffic manager?
- How many new server connections are available to the traffic manager?
- What was the average rate at which SSL transactions were made to the traffic manager?
- What was the average rate at which packets were transmitted to and from the traffic manager?
- What was the response time of the applications that were load balanced by the traffic manager when user requests were made through each predefined client subnet?
- How many transactions were processed by the applications that were accessed through each client subnet?
- What is the average page load time of the applications when accessed through each application launched by the user?
- What was the response time of the applications that were load balanced by the traffic manager when user requests were made through each application?
- How many transactions were processed by the applications that were accessed by the user through each application?
- What is the average page load time of the applications when accessed by the user through each application?
- What was the response time of the applications that were load balanced by the traffic manager when user requests were made through each URL?
- How many transactions were processed by the applications that were accessed by the user through each URL?
- What is the average page load time of the applications when accessed by the user through each URL?
- What was the response time of the applications that were load balanced by the traffic manager when user requests were made through each application pool member?
- How many transactions were processed by the applications that were accessed by the user through each application pool member?
- What is the average page load time of the applications when accessed by the user through each application pool member?
Since the tests pertaining to the F5 TM Pools layer and the F5 TM Virtual Servers layer have already been discussed in the Monitoring F5 Traffic Managers document and the Network layer has already been discussed in the Monitoring Unix and Windows Servers document, the remaining layers are discussed in detail in this document.